
|
|||||
|
 | |
| |
| |
| |
| |
| |
|
Gene: EPDR1 |
Gene summary for EPDR1 |
| Gene information | Species | Human | Gene symbol | EPDR1 | Gene ID | 54749 |
| Gene name | ependymin related 1 | |
| Gene Alias | EPDR | |
| Cytomap | 7p14.1 | |
| Gene Type | protein-coding | GO ID | GO:0006928 | UniProtAcc | Q96J80 |
Top |
Malignant transformation analysis |
| Identification of the aberrant gene expression in precancerous and cancerous lesions by comparing the gene expression of stem-like cells in diseased tissues with normal stem cells |
| Entrez ID | Symbol | Replicates | Species | Organ | Tissue | Adj P-value | Log2FC | Malignancy |
| 54749 | EPDR1 | P11T-E | Human | Esophagus | ESCC | 8.96e-16 | 6.20e-01 | 0.1426 |
| 54749 | EPDR1 | P15T-E | Human | Esophagus | ESCC | 3.60e-02 | 1.19e-01 | 0.1149 |
| 54749 | EPDR1 | P16T-E | Human | Esophagus | ESCC | 1.47e-14 | 2.55e-01 | 0.1153 |
| 54749 | EPDR1 | P22T-E | Human | Esophagus | ESCC | 2.94e-19 | 3.72e-01 | 0.1236 |
| 54749 | EPDR1 | P24T-E | Human | Esophagus | ESCC | 1.10e-02 | 7.87e-02 | 0.1287 |
| 54749 | EPDR1 | P32T-E | Human | Esophagus | ESCC | 6.48e-21 | 4.01e-01 | 0.1666 |
| 54749 | EPDR1 | P36T-E | Human | Esophagus | ESCC | 4.41e-04 | 2.83e-01 | 0.1187 |
| 54749 | EPDR1 | P37T-E | Human | Esophagus | ESCC | 4.37e-03 | 8.76e-02 | 0.1371 |
| 54749 | EPDR1 | P44T-E | Human | Esophagus | ESCC | 1.90e-04 | 3.25e-01 | 0.1096 |
| 54749 | EPDR1 | P47T-E | Human | Esophagus | ESCC | 3.97e-04 | 1.05e-01 | 0.1067 |
| 54749 | EPDR1 | P52T-E | Human | Esophagus | ESCC | 4.17e-05 | 1.30e-01 | 0.1555 |
| 54749 | EPDR1 | P56T-E | Human | Esophagus | ESCC | 1.84e-03 | 9.36e-01 | 0.1613 |
| 54749 | EPDR1 | P74T-E | Human | Esophagus | ESCC | 7.99e-04 | 1.50e-01 | 0.1479 |
| 54749 | EPDR1 | P76T-E | Human | Esophagus | ESCC | 9.53e-09 | 1.53e-01 | 0.1207 |
| 54749 | EPDR1 | P83T-E | Human | Esophagus | ESCC | 1.19e-23 | 8.21e-01 | 0.1738 |
| 54749 | EPDR1 | P89T-E | Human | Esophagus | ESCC | 3.79e-09 | 6.14e-01 | 0.1752 |
| 54749 | EPDR1 | HCC1_Meng | Human | Liver | HCC | 8.30e-09 | -3.00e-02 | 0.0246 |
| 54749 | EPDR1 | HCC2_Meng | Human | Liver | HCC | 3.96e-12 | 6.95e-02 | 0.0107 |
| 54749 | EPDR1 | HCC1 | Human | Liver | HCC | 3.16e-07 | 2.93e+00 | 0.5336 |
| 54749 | EPDR1 | S014 | Human | Liver | HCC | 2.91e-30 | 1.07e+00 | 0.2254 |
| Page: 1 2 |
| Tissue | Expression Dynamics | Abbreviation |
| Esophagus |  | ESCC: Esophageal squamous cell carcinoma |
| HGIN: High-grade intraepithelial neoplasias | ||
| LGIN: Low-grade intraepithelial neoplasias | ||
| Liver | 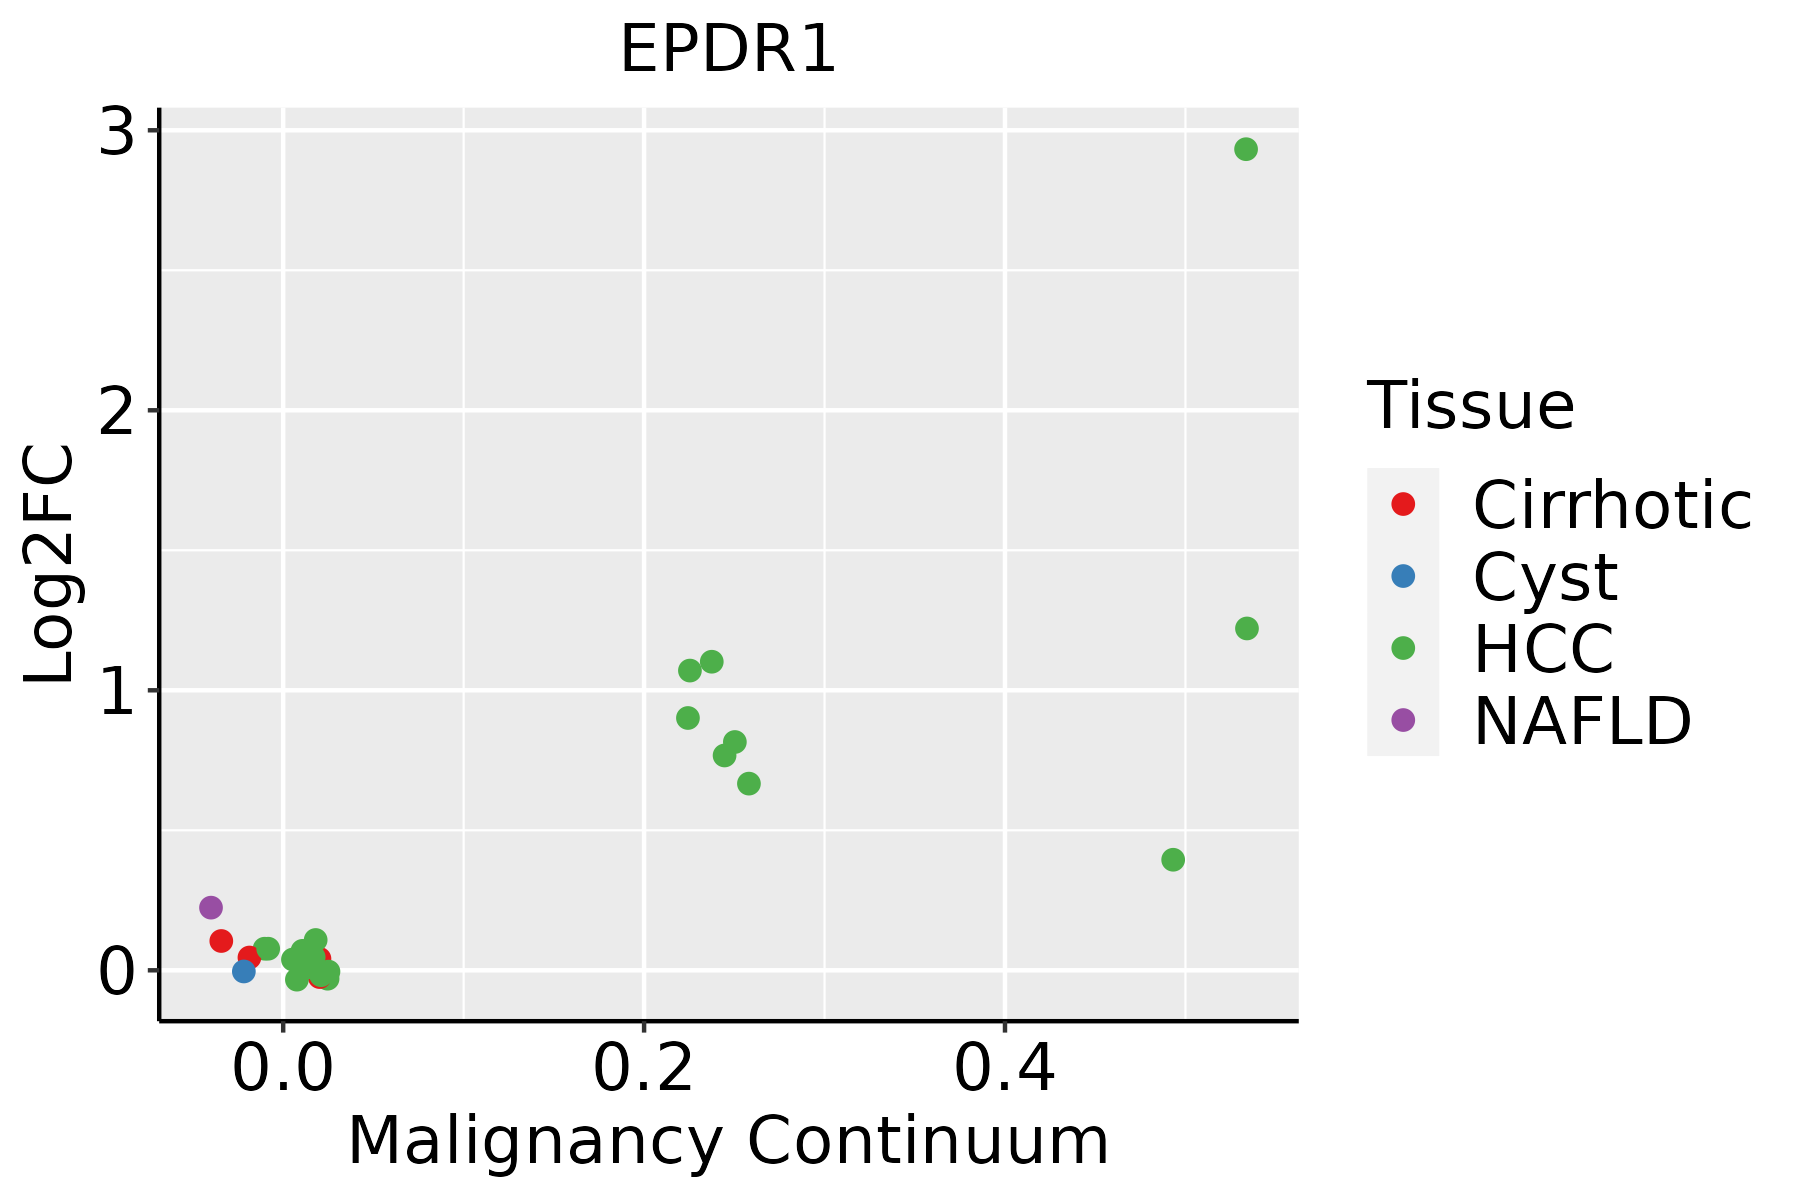 | HCC: Hepatocellular carcinoma |
| NAFLD: Non-alcoholic fatty liver disease |
| ∗log2FC in expression of this searched gene in stem-like cells from each diseased tissue sample relative to stem-like cells in normal samples in each tissue plotted against the malignancy continuum. Samples are colored based on if they are from different disease stage. |
Top |
Malignant transformation related pathway analysis |
| Find out the enriched GO biological processes and KEGG pathways involved in transition from healthy to precancer to cancer |
| Tissue | Disease Stage | Enriched GO biological Processes |
| Colorectum | AD |  |
| Colorectum | SER |  |
| Colorectum | MSS |  |
| Colorectum | MSI-H |  |
| Colorectum | FAP |  |
| ∗Top 15 enriched GO BP terms are showed in the bar plot of each disease state in each tissue. Each row represents a significant GO biological process which is colored according to the -log10(p.adjust). |
| Page: 1 2 3 4 5 6 7 8 9 |
| GO ID | Tissue | Disease Stage | Description | Gene Ratio | Bg Ratio | pvalue | p.adjust | Count |
| GO:003158919 | Esophagus | ESCC | cell-substrate adhesion | 221/8552 | 363/18723 | 3.06e-09 | 6.62e-08 | 221 |
| GO:000716018 | Esophagus | ESCC | cell-matrix adhesion | 141/8552 | 233/18723 | 3.33e-06 | 3.71e-05 | 141 |
| GO:003158922 | Liver | HCC | cell-substrate adhesion | 188/7958 | 363/18723 | 2.00e-04 | 1.55e-03 | 188 |
| GO:000716021 | Liver | HCC | cell-matrix adhesion | 123/7958 | 233/18723 | 9.34e-04 | 5.47e-03 | 123 |
| Page: 1 |
| Pathway ID | Tissue | Disease Stage | Description | Gene Ratio | Bg Ratio | pvalue | p.adjust | qvalue | Count |
| Page: 1 |
Top |
Cell-cell communication analysis |
| Identification of potential cell-cell interactions between two cell types and their ligand-receptor pairs for different disease states |
| Ligand | Receptor | LRpair | Pathway | Tissue | Disease Stage |
| Page: 1 |
Top |
Single-cell gene regulatory network inference analysis |
| Find out the significant the regulons (TFs) and the target genes of each regulon across cell types for different disease states |
| TF | Cell Type | Tissue | Disease Stage | Target Gene | RSS | Regulon Activity |
| ∗The dot plots of a searched regulon are shown for all cell subpopulations in each disease state of each tissue based on the regulon specific score inferred using pySCENIC and by calculating the average expression. |
| Page: 1 |
Top |
Somatic mutation of malignant transformation related genes |
| Annotation of somatic variants for genes involved in malignant transformation |
| Hugo Symbol | Variant Class | Variant Classification | dbSNP RS | HGVSc | HGVSp | HGVSp Short | SWISSPROT | BIOTYPE | SIFT | PolyPhen | Tumor Sample Barcode | Tissue | Histology | Sex | Age | Stage | Therapy Types | Drugs | Outcome |
| EPDR1 | SNV | Missense_Mutation | rs369217258 | c.442N>A | p.Val148Ile | p.V148I | Q9UM22 | protein_coding | deleterious(0.04) | benign(0.357) | TCGA-AR-A24S-01 | Breast | breast invasive carcinoma | Female | <65 | I/II | Hormone Therapy | anastrozole | SD |
| EPDR1 | SNV | Missense_Mutation | rs768217022 | c.500A>G | p.Tyr167Cys | p.Y167C | Q9UM22 | protein_coding | deleterious(0) | probably_damaging(0.99) | TCGA-D8-A142-01 | Breast | breast invasive carcinoma | Female | >=65 | I/II | Chemotherapy | cyclophosphamid | SD |
| EPDR1 | SNV | Missense_Mutation | novel | c.355A>G | p.Thr119Ala | p.T119A | Q9UM22 | protein_coding | tolerated(0.2) | benign(0.038) | TCGA-2W-A8YY-01 | Cervix | cervical & endocervical cancer | Female | <65 | I/II | Chemotherapy | cisplatin | CR |
| EPDR1 | SNV | Missense_Mutation | rs746300859 | c.658N>A | p.Glu220Lys | p.E220K | Q9UM22 | protein_coding | tolerated(0.07) | benign(0.01) | TCGA-AA-A00N-01 | Colorectum | colon adenocarcinoma | Male | >=65 | I/II | Unknown | Unknown | PD |
| EPDR1 | SNV | Missense_Mutation | rs746506034 | c.179G>A | p.Gly60Glu | p.G60E | Q9UM22 | protein_coding | tolerated(0.11) | benign(0.314) | TCGA-AF-A56N-01 | Colorectum | rectum adenocarcinoma | Female | <65 | I/II | Chemotherapy | xeloda | CR |
| EPDR1 | SNV | Missense_Mutation | novel | c.413C>A | p.Ser138Tyr | p.S138Y | Q9UM22 | protein_coding | tolerated(1) | benign(0.047) | TCGA-A5-A1OF-01 | Endometrium | uterine corpus endometrioid carcinoma | Female | <65 | I/II | Unknown | Unknown | SD |
| EPDR1 | SNV | Missense_Mutation | rs750207754 | c.568N>T | p.Arg190Trp | p.R190W | Q9UM22 | protein_coding | deleterious(0) | probably_damaging(0.972) | TCGA-AJ-A3EL-01 | Endometrium | uterine corpus endometrioid carcinoma | Female | <65 | I/II | Unknown | Unknown | SD |
| EPDR1 | SNV | Missense_Mutation | c.293N>C | p.Tyr98Ser | p.Y98S | Q9UM22 | protein_coding | deleterious(0.01) | probably_damaging(0.967) | TCGA-B5-A0JY-01 | Endometrium | uterine corpus endometrioid carcinoma | Female | <65 | III/IV | Chemotherapy | doxorubicin | SD | |
| EPDR1 | SNV | Missense_Mutation | rs750207754 | c.568N>T | p.Arg190Trp | p.R190W | Q9UM22 | protein_coding | deleterious(0) | probably_damaging(0.972) | TCGA-B5-A1MX-01 | Endometrium | uterine corpus endometrioid carcinoma | Female | <65 | I/II | Hormone Therapy | megace | SD |
| EPDR1 | SNV | Missense_Mutation | rs771376229 | c.518N>G | p.Tyr173Cys | p.Y173C | Q9UM22 | protein_coding | deleterious(0) | probably_damaging(0.992) | TCGA-D1-A177-01 | Endometrium | uterine corpus endometrioid carcinoma | Female | >=65 | I/II | Unknown | Unknown | PD |
| Page: 1 2 3 4 |
Top |
Related drugs of malignant transformation related genes |
| Identification of chemicals and drugs interact with genes involved in malignant transfromation |
| (DGIdb 4.0) |
| Entrez ID | Symbol | Category | Interaction Types | Drug Claim Name | Drug Name | PMIDs |
| Page: 1 |

Copyright 2023-Present -The University of Texas Health Science Center at Houston |