
|
|||||
|
 | |
| |
| |
| |
| |
| |
|
Gene: EPCAM |
Gene summary for EPCAM |
| Gene information | Species | Human | Gene symbol | EPCAM | Gene ID | 4072 |
| Gene name | epithelial cell adhesion molecule | |
| Gene Alias | DIAR5 | |
| Cytomap | 2p21 | |
| Gene Type | protein-coding | GO ID | GO:0001655 | UniProtAcc | P16422 |
Top |
Malignant transformation analysis |
| Identification of the aberrant gene expression in precancerous and cancerous lesions by comparing the gene expression of stem-like cells in diseased tissues with normal stem cells |
| Entrez ID | Symbol | Replicates | Species | Organ | Tissue | Adj P-value | Log2FC | Malignancy |
| 4072 | EPCAM | GSM4909281 | Human | Breast | IDC | 3.55e-08 | 4.28e-01 | 0.21 |
| 4072 | EPCAM | GSM4909285 | Human | Breast | IDC | 3.04e-30 | 6.38e-01 | 0.21 |
| 4072 | EPCAM | GSM4909286 | Human | Breast | IDC | 4.98e-04 | -4.51e-02 | 0.1081 |
| 4072 | EPCAM | GSM4909288 | Human | Breast | IDC | 1.20e-06 | 3.29e-01 | 0.0988 |
| 4072 | EPCAM | GSM4909294 | Human | Breast | IDC | 6.90e-09 | -1.26e-01 | 0.2022 |
| 4072 | EPCAM | GSM4909296 | Human | Breast | IDC | 1.49e-23 | -5.74e-01 | 0.1524 |
| 4072 | EPCAM | GSM4909297 | Human | Breast | IDC | 1.70e-16 | -2.47e-01 | 0.1517 |
| 4072 | EPCAM | GSM4909298 | Human | Breast | IDC | 7.01e-17 | -5.41e-01 | 0.1551 |
| 4072 | EPCAM | GSM4909301 | Human | Breast | IDC | 8.40e-13 | -4.34e-01 | 0.1577 |
| 4072 | EPCAM | GSM4909302 | Human | Breast | IDC | 7.09e-18 | -5.71e-01 | 0.1545 |
| 4072 | EPCAM | GSM4909304 | Human | Breast | IDC | 1.77e-02 | -3.19e-01 | 0.1636 |
| 4072 | EPCAM | GSM4909306 | Human | Breast | IDC | 3.03e-10 | -4.17e-01 | 0.1564 |
| 4072 | EPCAM | GSM4909307 | Human | Breast | IDC | 1.23e-05 | -3.63e-01 | 0.1569 |
| 4072 | EPCAM | GSM4909311 | Human | Breast | IDC | 2.84e-40 | -5.96e-01 | 0.1534 |
| 4072 | EPCAM | GSM4909312 | Human | Breast | IDC | 2.24e-12 | -3.21e-01 | 0.1552 |
| 4072 | EPCAM | GSM4909313 | Human | Breast | IDC | 1.30e-03 | -2.78e-01 | 0.0391 |
| 4072 | EPCAM | GSM4909316 | Human | Breast | IDC | 5.22e-04 | -8.24e-03 | 0.21 |
| 4072 | EPCAM | GSM4909317 | Human | Breast | IDC | 6.39e-07 | 3.65e-01 | 0.1355 |
| 4072 | EPCAM | GSM4909319 | Human | Breast | IDC | 5.54e-50 | -6.26e-01 | 0.1563 |
| 4072 | EPCAM | GSM4909320 | Human | Breast | IDC | 1.50e-14 | -7.28e-01 | 0.1575 |
| Page: 1 2 3 4 5 6 7 8 9 10 11 12 13 14 15 |
| Tissue | Expression Dynamics | Abbreviation |
| Breast |  | IDC: Invasive ductal carcinoma |
| DCIS: Ductal carcinoma in situ | ||
| Precancer(BRCA1-mut): Precancerous lesion from BRCA1 mutation carriers | ||
| Cervix | 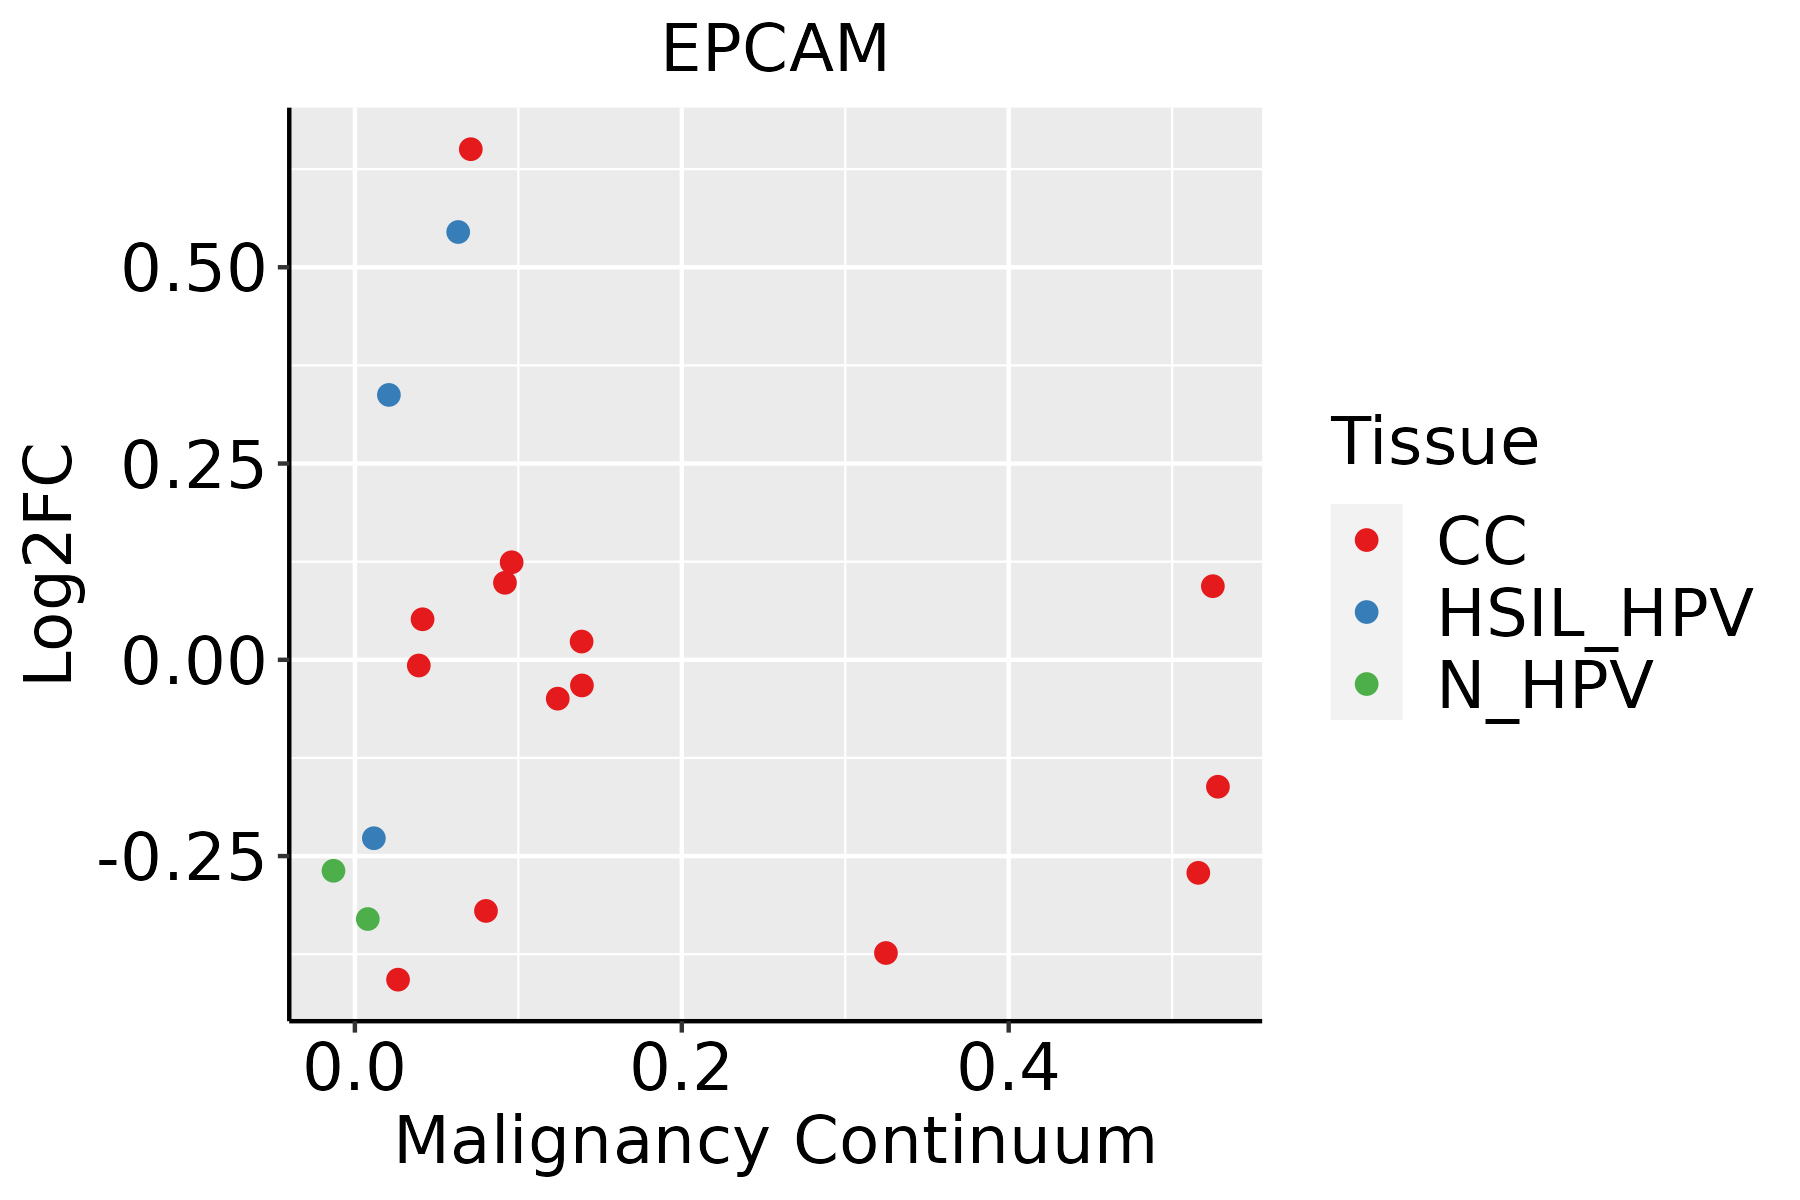 | CC: Cervix cancer |
| HSIL_HPV: HPV-infected high-grade squamous intraepithelial lesions | ||
| N_HPV: HPV-infected normal cervix | ||
| Colorectum (GSE201348) |  | FAP: Familial adenomatous polyposis |
| CRC: Colorectal cancer | ||
| Colorectum (HTA11) |  | AD: Adenomas |
| SER: Sessile serrated lesions | ||
| MSI-H: Microsatellite-high colorectal cancer | ||
| MSS: Microsatellite stable colorectal cancer | ||
| Endometrium | 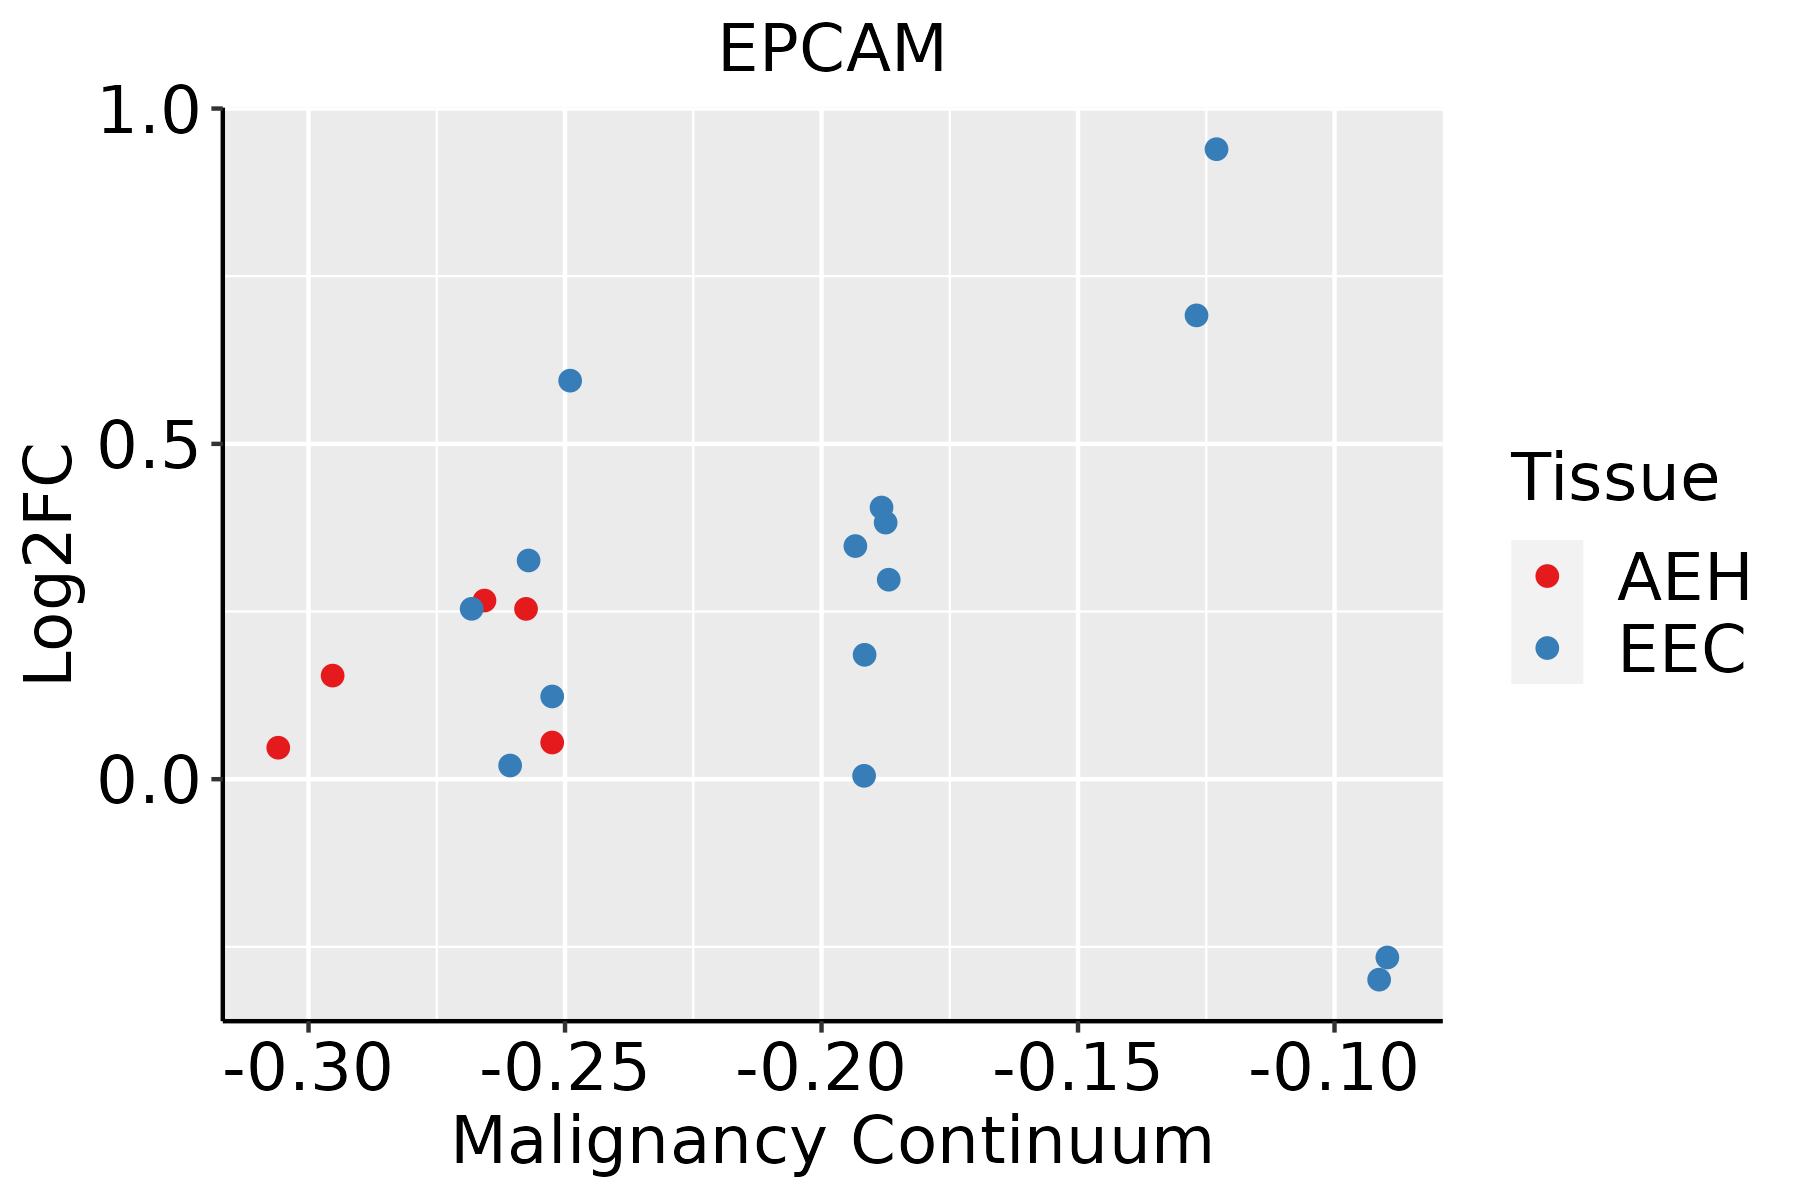 | AEH: Atypical endometrial hyperplasia |
| EEC: Endometrioid Cancer | ||
| Esophagus |  | ESCC: Esophageal squamous cell carcinoma |
| HGIN: High-grade intraepithelial neoplasias | ||
| LGIN: Low-grade intraepithelial neoplasias | ||
| GC |  | CAG: Chronic atrophic gastritis |
| CAG with IM: Chronic atrophic gastritis with intestinal metaplasia | ||
| CSG: Chronic superficial gastritis | ||
| GC: Gastric cancer | ||
| SIM: Severe intestinal metaplasia | ||
| WIM: Wild intestinal metaplasia | ||
| Liver | 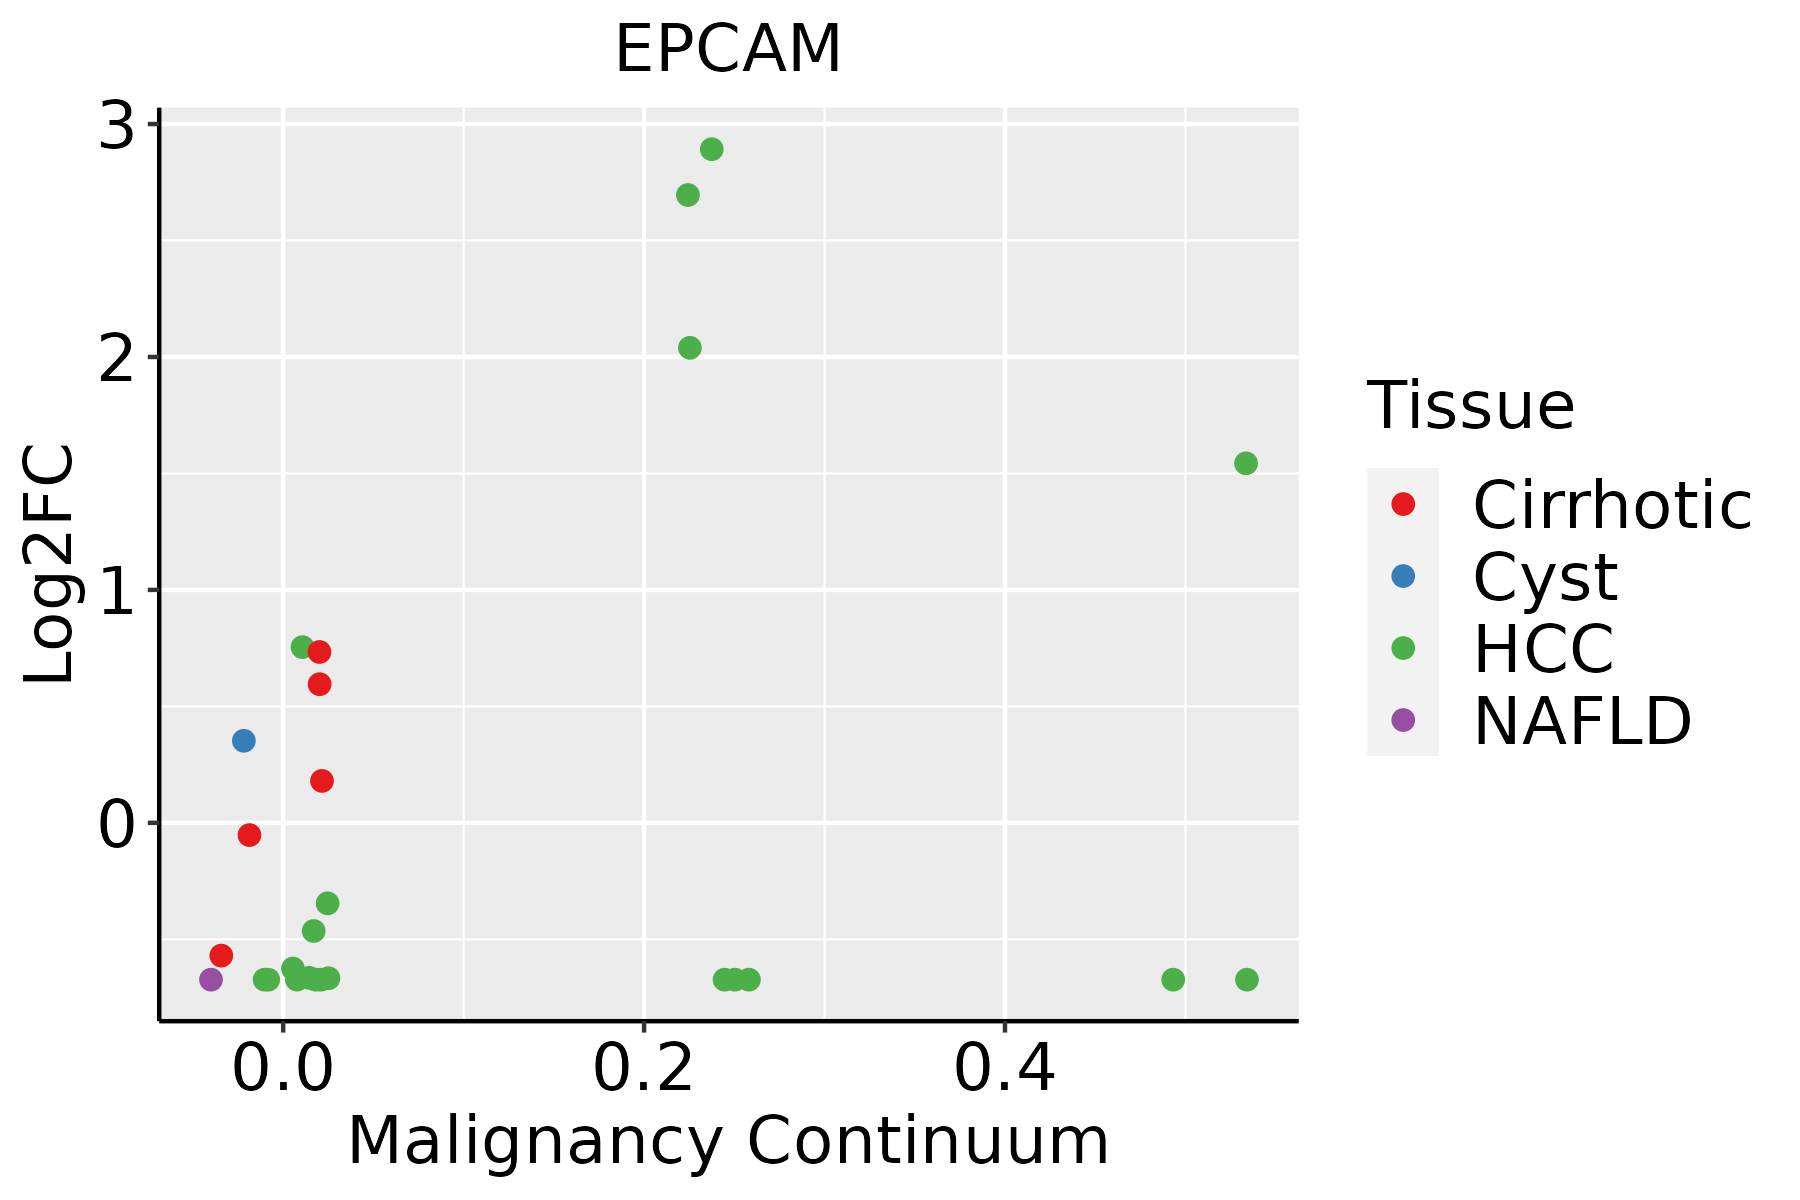 | HCC: Hepatocellular carcinoma |
| NAFLD: Non-alcoholic fatty liver disease | ||
| Oral Cavity |  | EOLP: Erosive Oral lichen planus |
| LP: leukoplakia | ||
| NEOLP: Non-erosive oral lichen planus | ||
| OSCC: Oral squamous cell carcinoma | ||
| Prostate |  | BPH: Benign Prostatic Hyperplasia |
| Skin | 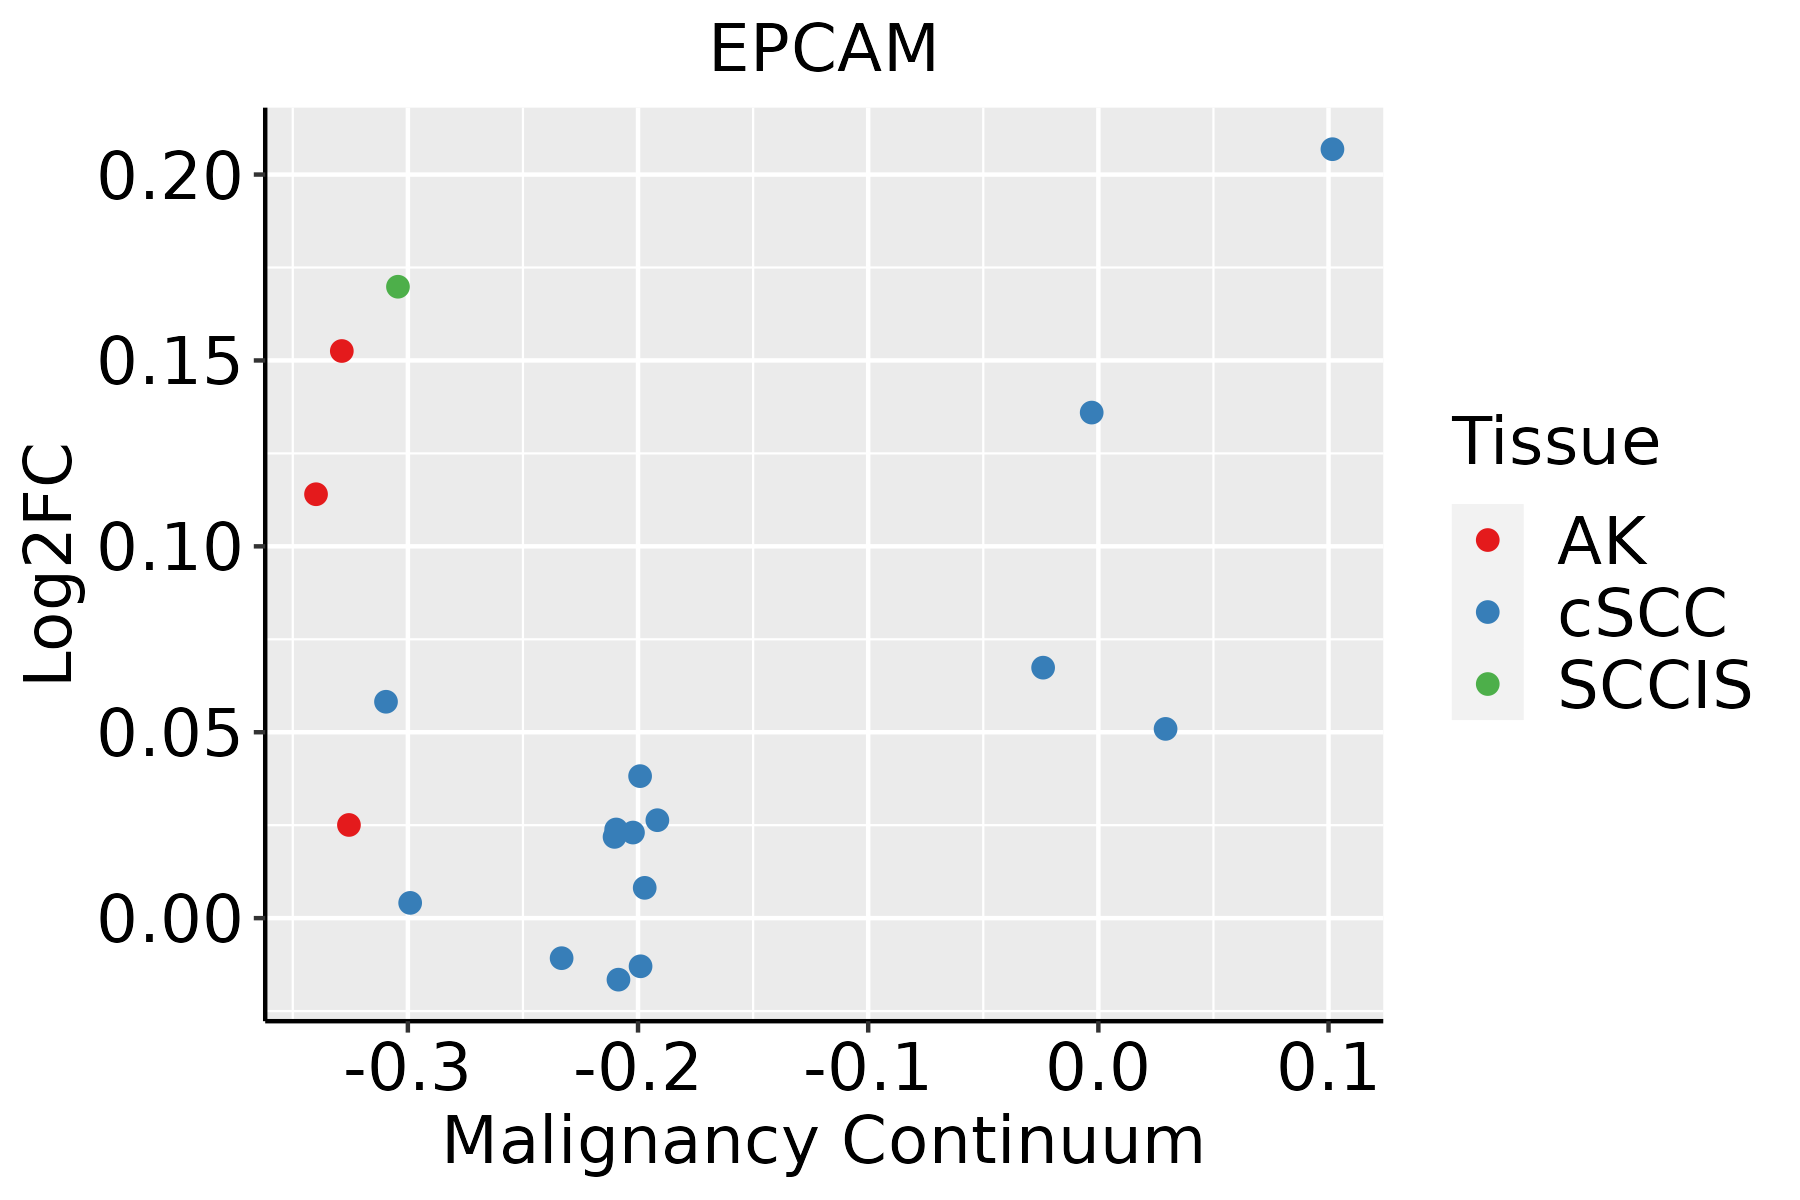 | AK: Actinic keratosis |
| cSCC: Cutaneous squamous cell carcinoma | ||
| SCCIS:squamous cell carcinoma in situ | ||
| Thyroid | 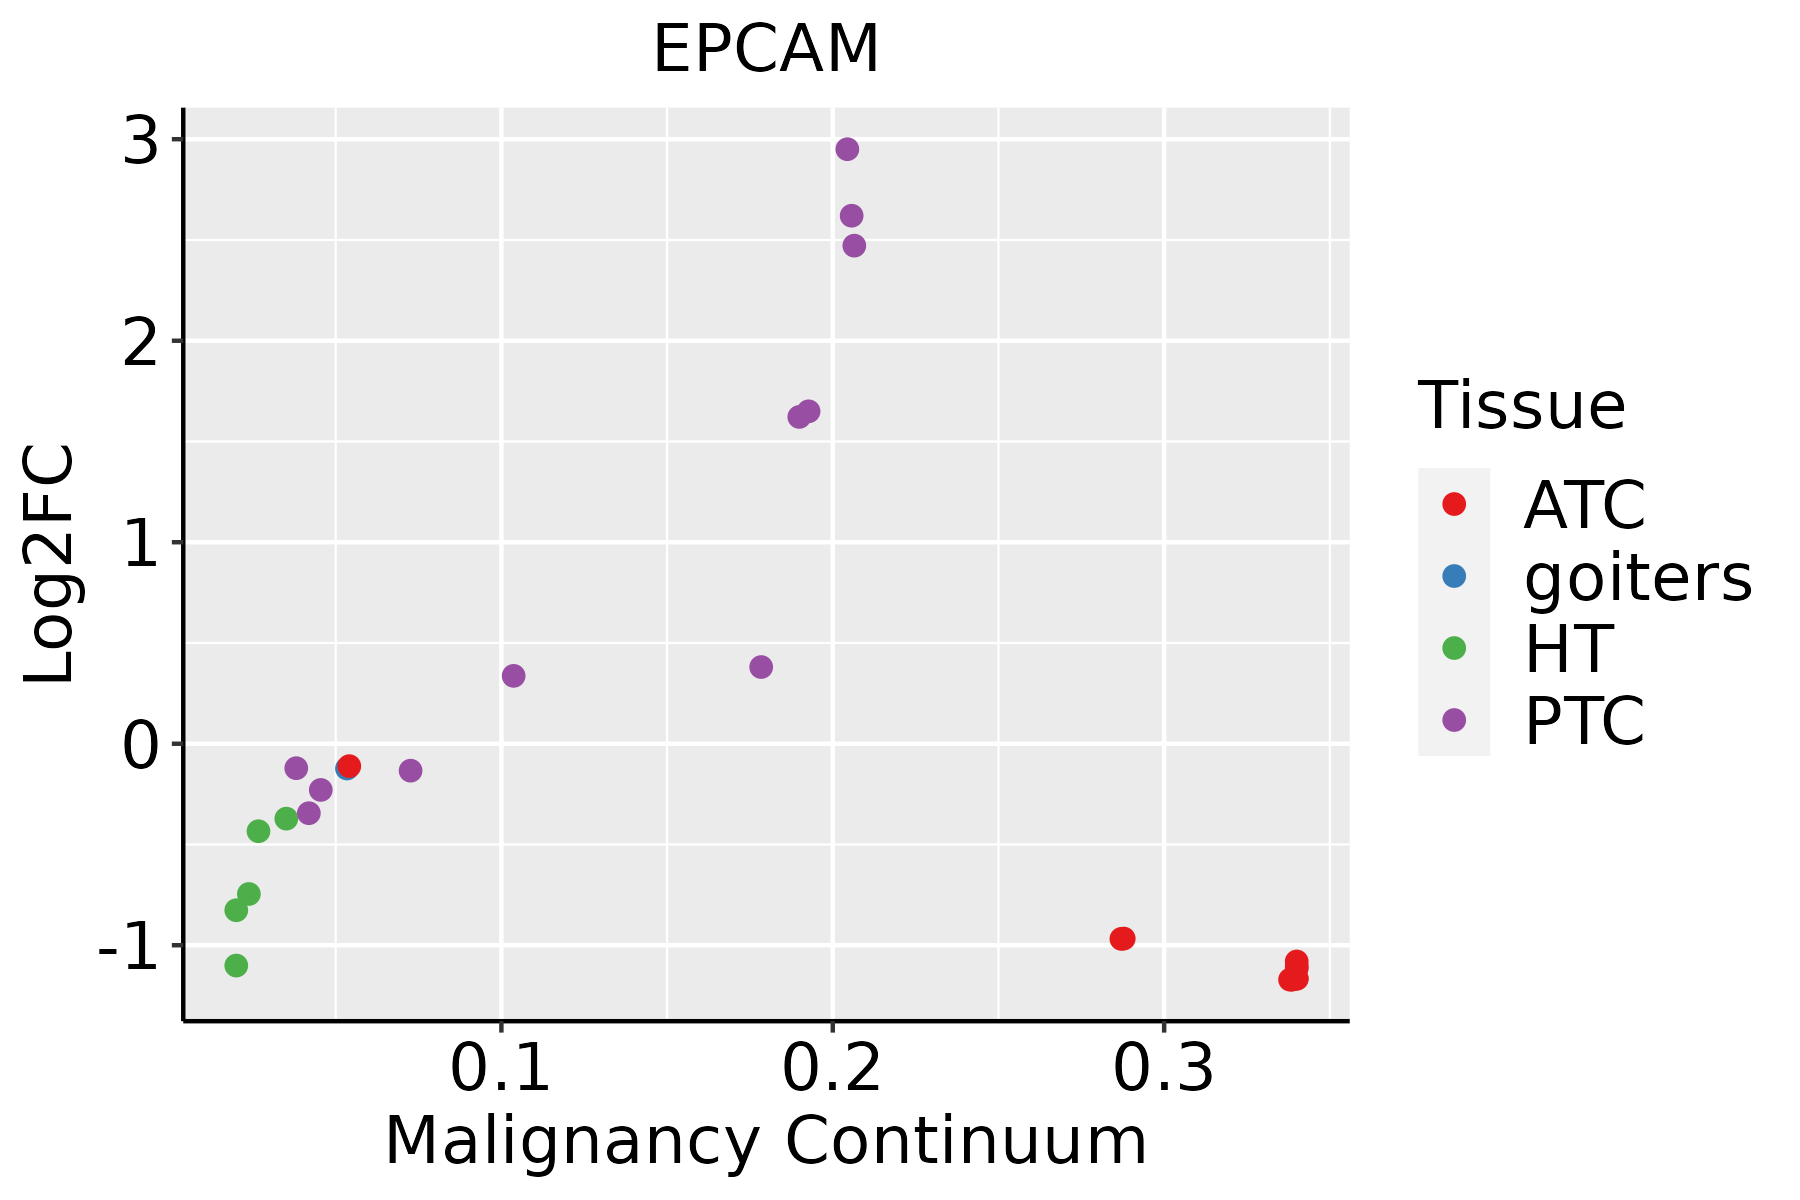 | ATC: Anaplastic thyroid cancer |
| HT: Hashimoto's thyroiditis | ||
| PTC: Papillary thyroid cancer |
| ∗log2FC in expression of this searched gene in stem-like cells from each diseased tissue sample relative to stem-like cells in normal samples in each tissue plotted against the malignancy continuum. Samples are colored based on if they are from different disease stage. |
Top |
Malignant transformation related pathway analysis |
| Find out the enriched GO biological processes and KEGG pathways involved in transition from healthy to precancer to cancer |
| Tissue | Disease Stage | Enriched GO biological Processes |
| Colorectum | AD |  |
| Colorectum | SER |  |
| Colorectum | MSS |  |
| Colorectum | MSI-H |  |
| Colorectum | FAP |  |
| ∗Top 15 enriched GO BP terms are showed in the bar plot of each disease state in each tissue. Each row represents a significant GO biological process which is colored according to the -log10(p.adjust). |
| Page: 1 2 3 4 5 6 7 8 9 |
| GO ID | Tissue | Disease Stage | Description | Gene Ratio | Bg Ratio | pvalue | p.adjust | Count |
| GO:00224079 | Breast | Precancer | regulation of cell-cell adhesion | 45/1080 | 448/18723 | 2.12e-04 | 3.30e-03 | 45 |
| GO:00720735 | Breast | Precancer | kidney epithelium development | 16/1080 | 136/18723 | 5.21e-03 | 3.88e-02 | 16 |
| GO:00016572 | Breast | Precancer | ureteric bud development | 12/1080 | 91/18723 | 5.97e-03 | 4.22e-02 | 12 |
| GO:00721632 | Breast | Precancer | mesonephric epithelium development | 12/1080 | 92/18723 | 6.51e-03 | 4.51e-02 | 12 |
| GO:00721642 | Breast | Precancer | mesonephric tubule development | 12/1080 | 92/18723 | 6.51e-03 | 4.51e-02 | 12 |
| GO:002240712 | Breast | IDC | regulation of cell-cell adhesion | 55/1434 | 448/18723 | 3.43e-04 | 5.07e-03 | 55 |
| GO:00071625 | Breast | IDC | negative regulation of cell adhesion | 37/1434 | 303/18723 | 3.27e-03 | 2.75e-02 | 37 |
| GO:007207312 | Breast | IDC | kidney epithelium development | 20/1434 | 136/18723 | 3.58e-03 | 2.94e-02 | 20 |
| GO:00016571 | Breast | IDC | ureteric bud development | 15/1434 | 91/18723 | 3.70e-03 | 3.04e-02 | 15 |
| GO:00721631 | Breast | IDC | mesonephric epithelium development | 15/1434 | 92/18723 | 4.12e-03 | 3.26e-02 | 15 |
| GO:00721641 | Breast | IDC | mesonephric tubule development | 15/1434 | 92/18723 | 4.12e-03 | 3.26e-02 | 15 |
| GO:00018231 | Breast | IDC | mesonephros development | 15/1434 | 96/18723 | 6.17e-03 | 4.40e-02 | 15 |
| GO:00016555 | Breast | IDC | urogenital system development | 39/1434 | 338/18723 | 6.75e-03 | 4.68e-02 | 39 |
| GO:002240722 | Breast | DCIS | regulation of cell-cell adhesion | 56/1390 | 448/18723 | 8.53e-05 | 1.61e-03 | 56 |
| GO:000716212 | Breast | DCIS | negative regulation of cell adhesion | 36/1390 | 303/18723 | 3.49e-03 | 2.90e-02 | 36 |
| GO:002240710 | Cervix | CC | regulation of cell-cell adhesion | 103/2311 | 448/18723 | 1.78e-10 | 2.87e-08 | 103 |
| GO:00071626 | Cervix | CC | negative regulation of cell adhesion | 72/2311 | 303/18723 | 2.36e-08 | 1.70e-06 | 72 |
| GO:00224084 | Cervix | CC | negative regulation of cell-cell adhesion | 48/2311 | 196/18723 | 1.99e-06 | 6.18e-05 | 48 |
| GO:00488634 | Cervix | CC | stem cell differentiation | 46/2311 | 206/18723 | 4.11e-05 | 6.36e-04 | 46 |
| GO:0044331 | Cervix | CC | cell-cell adhesion mediated by cadherin | 9/2311 | 28/18723 | 5.02e-03 | 2.98e-02 | 9 |
| Page: 1 2 3 4 5 6 7 |
| Pathway ID | Tissue | Disease Stage | Description | Gene Ratio | Bg Ratio | pvalue | p.adjust | qvalue | Count |
| Page: 1 |
Top |
Cell-cell communication analysis |
| Identification of potential cell-cell interactions between two cell types and their ligand-receptor pairs for different disease states |
| Ligand | Receptor | LRpair | Pathway | Tissue | Disease Stage |
| Page: 1 |
Top |
Single-cell gene regulatory network inference analysis |
| Find out the significant the regulons (TFs) and the target genes of each regulon across cell types for different disease states |
| TF | Cell Type | Tissue | Disease Stage | Target Gene | RSS | Regulon Activity |
| ∗The dot plots of a searched regulon are shown for all cell subpopulations in each disease state of each tissue based on the regulon specific score inferred using pySCENIC and by calculating the average expression. |
| Page: 1 |
Top |
Somatic mutation of malignant transformation related genes |
| Annotation of somatic variants for genes involved in malignant transformation |
| Hugo Symbol | Variant Class | Variant Classification | dbSNP RS | HGVSc | HGVSp | HGVSp Short | SWISSPROT | BIOTYPE | SIFT | PolyPhen | Tumor Sample Barcode | Tissue | Histology | Sex | Age | Stage | Therapy Types | Drugs | Outcome |
| EPCAM | SNV | Missense_Mutation | rs766626946 | c.334N>A | p.Gly112Ser | p.G112S | P16422 | protein_coding | tolerated(0.06) | probably_damaging(0.976) | TCGA-A6-2686-01 | Colorectum | colon adenocarcinoma | Female | >=65 | I/II | Unknown | Unknown | SD |
| EPCAM | SNV | Missense_Mutation | rs587780767 | c.491N>T | p.Thr164Ile | p.T164I | P16422 | protein_coding | tolerated(0.17) | benign(0.026) | TCGA-AA-3811-01 | Colorectum | colon adenocarcinoma | Female | >=65 | III/IV | Unknown | Unknown | PD |
| EPCAM | SNV | Missense_Mutation | novel | c.911N>C | p.Glu304Ala | p.E304A | P16422 | protein_coding | deleterious(0) | probably_damaging(0.996) | TCGA-AZ-4315-01 | Colorectum | colon adenocarcinoma | Male | <65 | I/II | Unknown | Unknown | SD |
| EPCAM | SNV | Missense_Mutation | novel | c.545N>T | p.Thr182Met | p.T182M | P16422 | protein_coding | deleterious(0.02) | possibly_damaging(0.446) | TCGA-A5-A0G2-01 | Endometrium | uterine corpus endometrioid carcinoma | Female | <65 | III/IV | Unknown | Unknown | SD |
| EPCAM | SNV | Missense_Mutation | novel | c.592N>C | p.Asn198His | p.N198H | P16422 | protein_coding | deleterious(0.04) | probably_damaging(0.972) | TCGA-A5-A2K5-01 | Endometrium | uterine corpus endometrioid carcinoma | Female | >=65 | I/II | Unknown | Unknown | SD |
| EPCAM | SNV | Missense_Mutation | c.721N>T | p.Asp241Tyr | p.D241Y | P16422 | protein_coding | deleterious(0.01) | possibly_damaging(0.459) | TCGA-AP-A051-01 | Endometrium | uterine corpus endometrioid carcinoma | Female | >=65 | I/II | Unknown | Unknown | SD | |
| EPCAM | SNV | Missense_Mutation | c.521N>G | p.Tyr174Cys | p.Y174C | P16422 | protein_coding | deleterious(0.05) | probably_damaging(0.991) | TCGA-AP-A056-01 | Endometrium | uterine corpus endometrioid carcinoma | Female | <65 | I/II | Unknown | Unknown | SD | |
| EPCAM | SNV | Missense_Mutation | c.353N>T | p.Cys118Phe | p.C118F | P16422 | protein_coding | deleterious(0) | probably_damaging(0.977) | TCGA-BG-A0LW-01 | Endometrium | uterine corpus endometrioid carcinoma | Female | <65 | I/II | Unknown | Unknown | SD | |
| EPCAM | SNV | Missense_Mutation | novel | c.155G>T | p.Gly52Val | p.G52V | P16422 | protein_coding | deleterious(0) | probably_damaging(0.999) | TCGA-BG-A0VW-01 | Endometrium | uterine corpus endometrioid carcinoma | Female | >=65 | I/II | Unknown | Unknown | SD |
| EPCAM | SNV | Missense_Mutation | novel | c.773A>C | p.Glu258Ala | p.E258A | P16422 | protein_coding | deleterious(0) | possibly_damaging(0.876) | TCGA-E6-A1LX-01 | Endometrium | uterine corpus endometrioid carcinoma | Female | <65 | I/II | Unknown | Unknown | SD |
| Page: 1 2 3 |
Top |
Related drugs of malignant transformation related genes |
| Identification of chemicals and drugs interact with genes involved in malignant transfromation |
| (DGIdb 4.0) |
| Entrez ID | Symbol | Category | Interaction Types | Drug Claim Name | Drug Name | PMIDs |
| 4072 | EPCAM | CELL SURFACE, CLINICALLY ACTIONABLE, DRUGGABLE GENOME | VB4-845 | OPORTUZUMAB MONATOX | ||
| 4072 | EPCAM | CELL SURFACE, CLINICALLY ACTIONABLE, DRUGGABLE GENOME | CHEMBL2108660 | TUCOTUZUMAB CELMOLEUKIN | ||
| 4072 | EPCAM | CELL SURFACE, CLINICALLY ACTIONABLE, DRUGGABLE GENOME | TAG-72 | 2316628 | ||
| 4072 | EPCAM | CELL SURFACE, CLINICALLY ACTIONABLE, DRUGGABLE GENOME | ALVAC | 12855617 | ||
| 4072 | EPCAM | CELL SURFACE, CLINICALLY ACTIONABLE, DRUGGABLE GENOME | ALUM | 11768621 | ||
| 4072 | EPCAM | CELL SURFACE, CLINICALLY ACTIONABLE, DRUGGABLE GENOME | FREUND&APOS;S ADJUVANT | 15637741 | ||
| 4072 | EPCAM | CELL SURFACE, CLINICALLY ACTIONABLE, DRUGGABLE GENOME | VIRAL VECTOR | 10811480 | ||
| 4072 | EPCAM | CELL SURFACE, CLINICALLY ACTIONABLE, DRUGGABLE GENOME | INCOMPLETE FREUNDS ADJUVANT | 11768621 | ||
| 4072 | EPCAM | CELL SURFACE, CLINICALLY ACTIONABLE, DRUGGABLE GENOME | MINERAL OIL | 14741172 | ||
| 4072 | EPCAM | CELL SURFACE, CLINICALLY ACTIONABLE, DRUGGABLE GENOME | ADECATUMUMAB | ADECATUMUMAB |
| Page: 1 2 3 4 |

Copyright 2023-Present -The University of Texas Health Science Center at Houston |