
|
|||||
|
 | |
| |
| |
| |
| |
| |
|
Gene: EPC2 |
Gene summary for EPC2 |
| Gene information | Species | Human | Gene symbol | EPC2 | Gene ID | 26122 |
| Gene name | enhancer of polycomb homolog 2 | |
| Gene Alias | EPC-LIKE | |
| Cytomap | 2q23.1 | |
| Gene Type | protein-coding | GO ID | GO:0006139 | UniProtAcc | Q52LR7 |
Top |
Malignant transformation analysis |
| Identification of the aberrant gene expression in precancerous and cancerous lesions by comparing the gene expression of stem-like cells in diseased tissues with normal stem cells |
| Entrez ID | Symbol | Replicates | Species | Organ | Tissue | Adj P-value | Log2FC | Malignancy |
| 26122 | EPC2 | RNA-P25T1-P25T1-1 | Human | Lung | AIS | 3.67e-02 | 3.10e-01 | -0.2116 |
| 26122 | EPC2 | RNA-P25T1-P25T1-4 | Human | Lung | AIS | 1.03e-03 | 3.83e-01 | -0.2119 |
| 26122 | EPC2 | RNA-P6T1-P6T1-4 | Human | Lung | MIAC | 2.76e-02 | 5.57e-01 | -0.0263 |
| 26122 | EPC2 | RNA-P6T2-P6T2-1 | Human | Lung | IAC | 2.73e-06 | 3.54e-01 | -0.0166 |
| 26122 | EPC2 | RNA-P6T2-P6T2-2 | Human | Lung | IAC | 2.00e-12 | 4.82e-01 | -0.0132 |
| 26122 | EPC2 | RNA-P6T2-P6T2-3 | Human | Lung | IAC | 3.56e-10 | 3.94e-01 | -0.013 |
| 26122 | EPC2 | RNA-P6T2-P6T2-4 | Human | Lung | IAC | 4.01e-07 | 4.32e-01 | -0.0121 |
| 26122 | EPC2 | RNA-P7T1-P7T1-1 | Human | Lung | AIS | 2.38e-04 | 6.06e-01 | -0.0961 |
| 26122 | EPC2 | RNA-P7T1-P7T1-2 | Human | Lung | AIS | 1.93e-03 | 5.52e-01 | -0.0876 |
| 26122 | EPC2 | RNA-P7T1-P7T1-4 | Human | Lung | AIS | 3.43e-04 | 5.33e-01 | -0.0809 |
| 26122 | EPC2 | HTA12-15-2 | Human | Pancreas | PDAC | 2.23e-10 | 6.65e-01 | 0.2315 |
| 26122 | EPC2 | HTA12-23-1 | Human | Pancreas | PDAC | 4.36e-03 | 5.42e-01 | 0.3405 |
| 26122 | EPC2 | HTA12-25-1 | Human | Pancreas | PDAC | 1.45e-10 | 7.17e-01 | 0.313 |
| 26122 | EPC2 | HTA12-26-1 | Human | Pancreas | PDAC | 4.23e-16 | 7.91e-01 | 0.3728 |
| 26122 | EPC2 | HTA12-29-1 | Human | Pancreas | PDAC | 4.81e-41 | 8.30e-01 | 0.3722 |
| Page: 1 |
| Tissue | Expression Dynamics | Abbreviation |
| Lung | 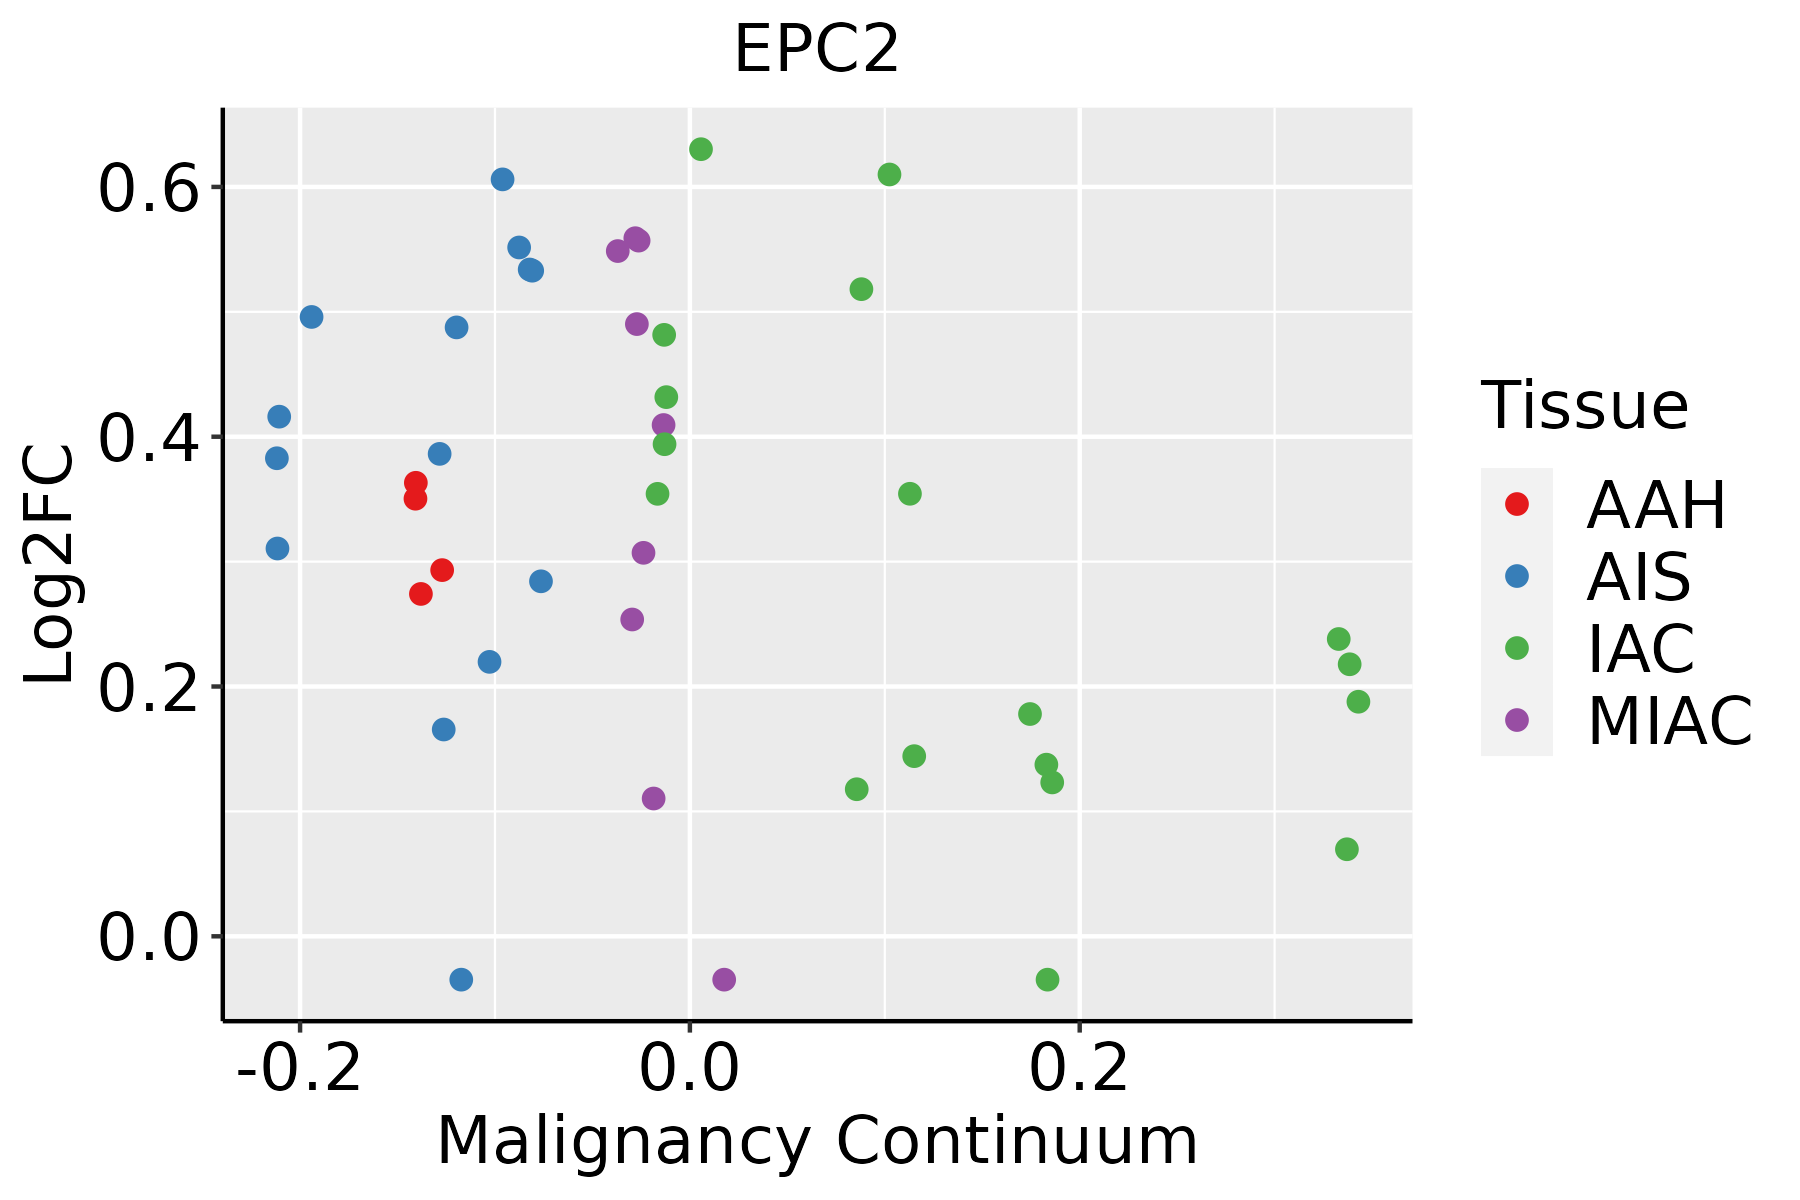 | AAH: Atypical adenomatous hyperplasia |
| AIS: Adenocarcinoma in situ | ||
| IAC: Invasive lung adenocarcinoma | ||
| MIA: Minimally invasive adenocarcinoma |
| ∗log2FC in expression of this searched gene in stem-like cells from each diseased tissue sample relative to stem-like cells in normal samples in each tissue plotted against the malignancy continuum. Samples are colored based on if they are from different disease stage. |
Top |
Malignant transformation related pathway analysis |
| Find out the enriched GO biological processes and KEGG pathways involved in transition from healthy to precancer to cancer |
| Tissue | Disease Stage | Enriched GO biological Processes |
| Colorectum | AD |  |
| Colorectum | SER |  |
| Colorectum | MSS |  |
| Colorectum | MSI-H |  |
| Colorectum | FAP |  |
| ∗Top 15 enriched GO BP terms are showed in the bar plot of each disease state in each tissue. Each row represents a significant GO biological process which is colored according to the -log10(p.adjust). |
| Page: 1 2 3 4 5 6 7 8 9 |
| GO ID | Tissue | Disease Stage | Description | Gene Ratio | Bg Ratio | pvalue | p.adjust | Count |
| GO:00165704 | Lung | IAC | histone modification | 93/2061 | 463/18723 | 5.41e-09 | 8.03e-07 | 93 |
| GO:00182053 | Lung | IAC | peptidyl-lysine modification | 62/2061 | 376/18723 | 7.55e-04 | 9.82e-03 | 62 |
| GO:001657012 | Lung | AIS | histone modification | 81/1849 | 463/18723 | 2.30e-07 | 2.16e-05 | 81 |
| GO:001657022 | Lung | MIAC | histone modification | 45/967 | 463/18723 | 3.58e-05 | 1.97e-03 | 45 |
| GO:001820511 | Lung | MIAC | peptidyl-lysine modification | 34/967 | 376/18723 | 1.12e-03 | 2.19e-02 | 34 |
| Page: 1 |
| Pathway ID | Tissue | Disease Stage | Description | Gene Ratio | Bg Ratio | pvalue | p.adjust | qvalue | Count |
| Page: 1 |
Top |
Cell-cell communication analysis |
| Identification of potential cell-cell interactions between two cell types and their ligand-receptor pairs for different disease states |
| Ligand | Receptor | LRpair | Pathway | Tissue | Disease Stage |
| Page: 1 |
Top |
Single-cell gene regulatory network inference analysis |
| Find out the significant the regulons (TFs) and the target genes of each regulon across cell types for different disease states |
| TF | Cell Type | Tissue | Disease Stage | Target Gene | RSS | Regulon Activity |
| ∗The dot plots of a searched regulon are shown for all cell subpopulations in each disease state of each tissue based on the regulon specific score inferred using pySCENIC and by calculating the average expression. |
| Page: 1 |
Top |
Somatic mutation of malignant transformation related genes |
| Annotation of somatic variants for genes involved in malignant transformation |
| Hugo Symbol | Variant Class | Variant Classification | dbSNP RS | HGVSc | HGVSp | HGVSp Short | SWISSPROT | BIOTYPE | SIFT | PolyPhen | Tumor Sample Barcode | Tissue | Histology | Sex | Age | Stage | Therapy Types | Drugs | Outcome |
| EPC2 | SNV | Missense_Mutation | rs185289361 | c.1481N>T | p.Ser494Phe | p.S494F | Q52LR7 | protein_coding | tolerated(0.75) | benign(0.135) | TCGA-B6-A0IK-01 | Breast | breast invasive carcinoma | Female | <65 | III/IV | Unknown | Unknown | PD |
| EPC2 | SNV | Missense_Mutation | c.1063G>C | p.Glu355Gln | p.E355Q | Q52LR7 | protein_coding | tolerated(0.57) | probably_damaging(0.954) | TCGA-B6-A0RT-01 | Breast | breast invasive carcinoma | Female | <65 | III/IV | Unknown | Unknown | SD | |
| EPC2 | SNV | Missense_Mutation | c.434N>A | p.Arg145Lys | p.R145K | Q52LR7 | protein_coding | deleterious(0) | probably_damaging(0.973) | TCGA-D8-A1X7-01 | Breast | breast invasive carcinoma | Female | <65 | I/II | ChemotherapyHormone Therapy | doxorubicine+cyclophosphamide+tamoxifen | SD | |
| EPC2 | SNV | Missense_Mutation | c.285N>T | p.Lys95Asn | p.K95N | Q52LR7 | protein_coding | deleterious(0) | probably_damaging(0.913) | TCGA-D8-A1XK-01 | Breast | breast invasive carcinoma | Female | <65 | I/II | Chemotherapy | doxorubicine+cyclophosphamide | SD | |
| EPC2 | deletion | Frame_Shift_Del | c.200delN | p.Glu70ArgfsTer39 | p.E70Rfs*39 | Q52LR7 | protein_coding | TCGA-AN-A0AK-01 | Breast | breast invasive carcinoma | Female | >=65 | I/II | Unknown | Unknown | SD | |||
| EPC2 | insertion | Frame_Shift_Ins | novel | c.396_397insACATATACATGTT | p.Glu133ThrfsTer5 | p.E133Tfs*5 | Q52LR7 | protein_coding | TCGA-AR-A0U0-01 | Breast | breast invasive carcinoma | Female | >=65 | I/II | Unknown | Unknown | SD | ||
| EPC2 | SNV | Missense_Mutation | c.304N>G | p.His102Asp | p.H102D | Q52LR7 | protein_coding | deleterious(0) | probably_damaging(0.991) | TCGA-IR-A3LK-01 | Cervix | cervical & endocervical cancer | Female | >=65 | I/II | Chemotherapy | cisplatin | PD | |
| EPC2 | SNV | Missense_Mutation | c.1592N>T | p.Arg531Met | p.R531M | Q52LR7 | protein_coding | deleterious(0) | probably_damaging(0.984) | TCGA-A6-5661-01 | Colorectum | colon adenocarcinoma | Female | >=65 | I/II | Unknown | Unknown | SD | |
| EPC2 | SNV | Missense_Mutation | c.1140N>T | p.Gln380His | p.Q380H | Q52LR7 | protein_coding | deleterious(0.03) | possibly_damaging(0.496) | TCGA-A6-6781-01 | Colorectum | colon adenocarcinoma | Male | <65 | III/IV | Chemotherapy | oxaliplatin | SD | |
| EPC2 | SNV | Missense_Mutation | novel | c.97T>A | p.Ser33Thr | p.S33T | Q52LR7 | protein_coding | tolerated(0.07) | probably_damaging(0.973) | TCGA-AA-3947-01 | Colorectum | colon adenocarcinoma | Female | <65 | I/II | Unknown | Unknown | SD |
| Page: 1 2 3 4 5 6 7 8 |
Top |
Related drugs of malignant transformation related genes |
| Identification of chemicals and drugs interact with genes involved in malignant transfromation |
| (DGIdb 4.0) |
| Entrez ID | Symbol | Category | Interaction Types | Drug Claim Name | Drug Name | PMIDs |
| Page: 1 |

Copyright 2023-Present -The University of Texas Health Science Center at Houston |