
|
|||||
|
 | |
| |
| |
| |
| |
| |
|
Gene: EPB41L4B |
Gene summary for EPB41L4B |
| Gene information | Species | Human | Gene symbol | EPB41L4B | Gene ID | 54566 |
| Gene name | erythrocyte membrane protein band 4.1 like 4B | |
| Gene Alias | CG1 | |
| Cytomap | 9q31.3 | |
| Gene Type | protein-coding | GO ID | GO:0001667 | UniProtAcc | Q9H329 |
Top |
Malignant transformation analysis |
| Identification of the aberrant gene expression in precancerous and cancerous lesions by comparing the gene expression of stem-like cells in diseased tissues with normal stem cells |
| Entrez ID | Symbol | Replicates | Species | Organ | Tissue | Adj P-value | Log2FC | Malignancy |
| 54566 | EPB41L4B | HTA11_78_2000001011 | Human | Colorectum | AD | 8.59e-05 | 4.47e-01 | -0.1088 |
| 54566 | EPB41L4B | HTA11_347_2000001011 | Human | Colorectum | AD | 4.54e-30 | 9.15e-01 | -0.1954 |
| 54566 | EPB41L4B | A015-C-203 | Human | Colorectum | FAP | 5.07e-21 | -3.01e-01 | -0.1294 |
| 54566 | EPB41L4B | A002-C-201 | Human | Colorectum | FAP | 1.84e-08 | -3.58e-01 | 0.0324 |
| 54566 | EPB41L4B | A002-C-203 | Human | Colorectum | FAP | 3.55e-06 | -2.28e-01 | 0.2786 |
| 54566 | EPB41L4B | A001-C-119 | Human | Colorectum | FAP | 2.46e-04 | -4.63e-01 | -0.1557 |
| 54566 | EPB41L4B | A001-C-108 | Human | Colorectum | FAP | 3.38e-14 | -2.80e-01 | -0.0272 |
| 54566 | EPB41L4B | A002-C-205 | Human | Colorectum | FAP | 2.97e-15 | -5.00e-01 | -0.1236 |
| 54566 | EPB41L4B | A001-C-104 | Human | Colorectum | FAP | 1.85e-04 | -2.70e-01 | 0.0184 |
| 54566 | EPB41L4B | A015-C-006 | Human | Colorectum | FAP | 6.99e-12 | -5.71e-01 | -0.0994 |
| 54566 | EPB41L4B | A015-C-106 | Human | Colorectum | FAP | 8.46e-11 | -3.36e-01 | -0.0511 |
| 54566 | EPB41L4B | A002-C-114 | Human | Colorectum | FAP | 6.87e-10 | -3.37e-01 | -0.1561 |
| 54566 | EPB41L4B | A015-C-104 | Human | Colorectum | FAP | 2.08e-24 | -4.03e-01 | -0.1899 |
| 54566 | EPB41L4B | A001-C-014 | Human | Colorectum | FAP | 1.12e-13 | -2.70e-01 | 0.0135 |
| 54566 | EPB41L4B | A002-C-016 | Human | Colorectum | FAP | 1.56e-14 | -2.88e-01 | 0.0521 |
| 54566 | EPB41L4B | A015-C-002 | Human | Colorectum | FAP | 2.16e-08 | -3.89e-01 | -0.0763 |
| 54566 | EPB41L4B | A001-C-203 | Human | Colorectum | FAP | 8.82e-11 | -2.15e-01 | -0.0481 |
| 54566 | EPB41L4B | A002-C-116 | Human | Colorectum | FAP | 5.77e-29 | -3.40e-01 | -0.0452 |
| 54566 | EPB41L4B | A014-C-008 | Human | Colorectum | FAP | 4.52e-07 | -4.06e-01 | -0.191 |
| 54566 | EPB41L4B | A018-E-020 | Human | Colorectum | FAP | 7.92e-10 | -3.70e-01 | -0.2034 |
| Page: 1 2 |
| Tissue | Expression Dynamics | Abbreviation |
| Colorectum (GSE201348) |  | FAP: Familial adenomatous polyposis |
| CRC: Colorectal cancer | ||
| Colorectum (HTA11) |  | AD: Adenomas |
| SER: Sessile serrated lesions | ||
| MSI-H: Microsatellite-high colorectal cancer | ||
| MSS: Microsatellite stable colorectal cancer | ||
| Liver |  | HCC: Hepatocellular carcinoma |
| NAFLD: Non-alcoholic fatty liver disease | ||
| Prostate | 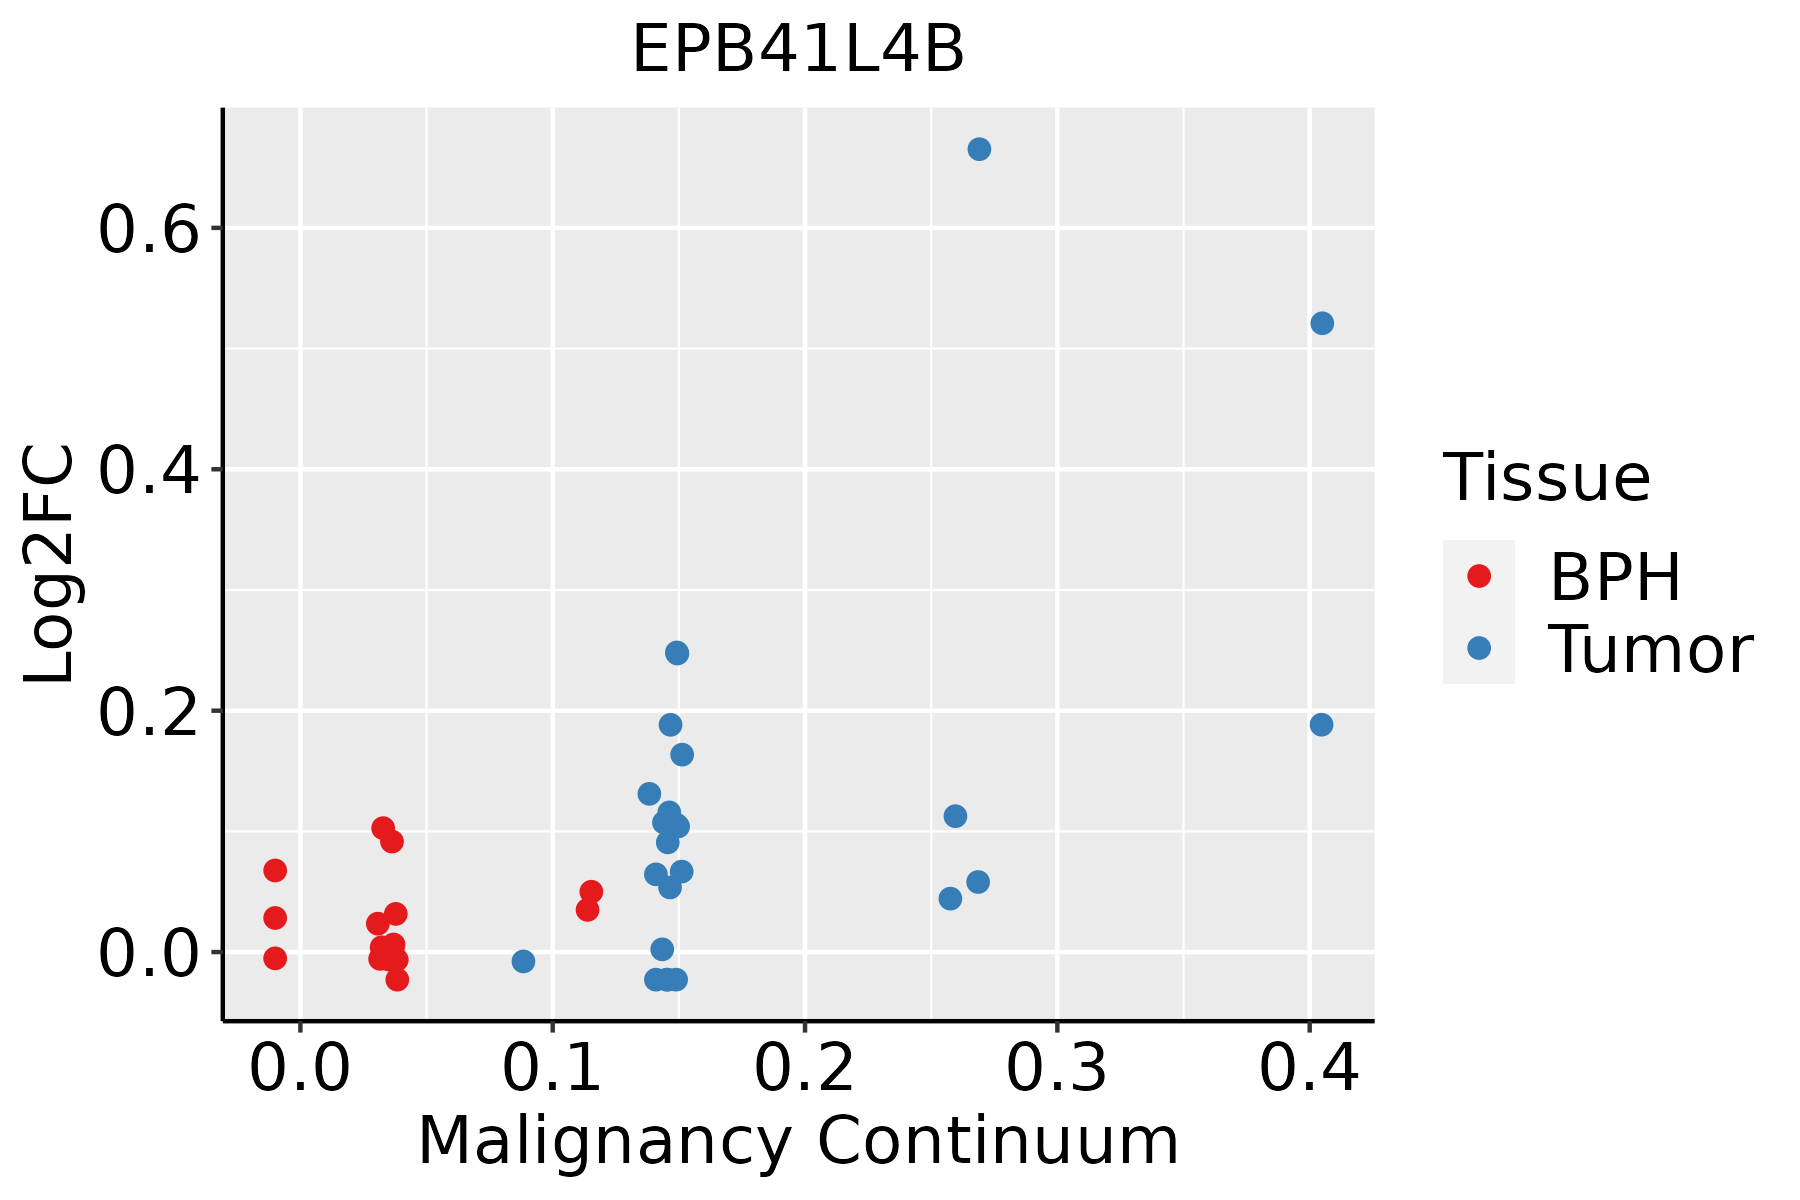 | BPH: Benign Prostatic Hyperplasia |
| ∗log2FC in expression of this searched gene in stem-like cells from each diseased tissue sample relative to stem-like cells in normal samples in each tissue plotted against the malignancy continuum. Samples are colored based on if they are from different disease stage. |
Top |
Malignant transformation related pathway analysis |
| Find out the enriched GO biological processes and KEGG pathways involved in transition from healthy to precancer to cancer |
| Tissue | Disease Stage | Enriched GO biological Processes |
| Colorectum | AD |  |
| Colorectum | SER |  |
| Colorectum | MSS |  |
| Colorectum | MSI-H |  |
| Colorectum | FAP |  |
| ∗Top 15 enriched GO BP terms are showed in the bar plot of each disease state in each tissue. Each row represents a significant GO biological process which is colored according to the -log10(p.adjust). |
| Page: 1 2 3 4 5 6 7 8 9 |
| GO ID | Tissue | Disease Stage | Description | Gene Ratio | Bg Ratio | pvalue | p.adjust | Count |
| GO:0042060 | Colorectum | AD | wound healing | 128/3918 | 422/18723 | 2.73e-06 | 7.89e-05 | 128 |
| GO:0001667 | Colorectum | AD | ameboidal-type cell migration | 137/3918 | 475/18723 | 2.17e-05 | 4.33e-04 | 137 |
| GO:0031032 | Colorectum | AD | actomyosin structure organization | 65/3918 | 196/18723 | 4.17e-05 | 7.37e-04 | 65 |
| GO:0090132 | Colorectum | AD | epithelium migration | 105/3918 | 360/18723 | 1.18e-04 | 1.73e-03 | 105 |
| GO:0010632 | Colorectum | AD | regulation of epithelial cell migration | 88/3918 | 292/18723 | 1.19e-04 | 1.75e-03 | 88 |
| GO:0010631 | Colorectum | AD | epithelial cell migration | 104/3918 | 357/18723 | 1.33e-04 | 1.90e-03 | 104 |
| GO:0090130 | Colorectum | AD | tissue migration | 105/3918 | 365/18723 | 2.10e-04 | 2.77e-03 | 105 |
| GO:0045785 | Colorectum | AD | positive regulation of cell adhesion | 122/3918 | 437/18723 | 2.65e-04 | 3.28e-03 | 122 |
| GO:0010634 | Colorectum | AD | positive regulation of epithelial cell migration | 56/3918 | 176/18723 | 4.51e-04 | 5.03e-03 | 56 |
| GO:00420604 | Colorectum | FAP | wound healing | 99/2622 | 422/18723 | 9.50e-08 | 6.33e-06 | 99 |
| GO:00310323 | Colorectum | FAP | actomyosin structure organization | 51/2622 | 196/18723 | 5.89e-06 | 1.88e-04 | 51 |
| GO:00016673 | Colorectum | FAP | ameboidal-type cell migration | 100/2622 | 475/18723 | 1.42e-05 | 3.79e-04 | 100 |
| GO:00457854 | Colorectum | FAP | positive regulation of cell adhesion | 92/2622 | 437/18723 | 3.09e-05 | 7.04e-04 | 92 |
| GO:00106343 | Colorectum | FAP | positive regulation of epithelial cell migration | 44/2622 | 176/18723 | 7.02e-05 | 1.31e-03 | 44 |
| GO:00901324 | Colorectum | FAP | epithelium migration | 77/2622 | 360/18723 | 7.70e-05 | 1.38e-03 | 77 |
| GO:00106314 | Colorectum | FAP | epithelial cell migration | 76/2622 | 357/18723 | 1.00e-04 | 1.69e-03 | 76 |
| GO:00901304 | Colorectum | FAP | tissue migration | 77/2622 | 365/18723 | 1.23e-04 | 2.00e-03 | 77 |
| GO:00106324 | Colorectum | FAP | regulation of epithelial cell migration | 64/2622 | 292/18723 | 1.45e-04 | 2.26e-03 | 64 |
| GO:00420605 | Colorectum | CRC | wound healing | 80/2078 | 422/18723 | 1.06e-06 | 6.54e-05 | 80 |
| GO:00310324 | Colorectum | CRC | actomyosin structure organization | 45/2078 | 196/18723 | 1.49e-06 | 8.14e-05 | 45 |
| Page: 1 2 3 |
| Pathway ID | Tissue | Disease Stage | Description | Gene Ratio | Bg Ratio | pvalue | p.adjust | qvalue | Count |
| hsa04530 | Colorectum | AD | Tight junction | 76/2092 | 169/8465 | 5.49e-09 | 9.69e-08 | 6.18e-08 | 76 |
| hsa045301 | Colorectum | AD | Tight junction | 76/2092 | 169/8465 | 5.49e-09 | 9.69e-08 | 6.18e-08 | 76 |
| hsa045308 | Colorectum | FAP | Tight junction | 60/1404 | 169/8465 | 1.40e-09 | 9.33e-08 | 5.67e-08 | 60 |
| hsa045309 | Colorectum | FAP | Tight junction | 60/1404 | 169/8465 | 1.40e-09 | 9.33e-08 | 5.67e-08 | 60 |
| hsa0453010 | Colorectum | CRC | Tight junction | 44/1091 | 169/8465 | 2.51e-06 | 7.61e-05 | 5.16e-05 | 44 |
| hsa0453011 | Colorectum | CRC | Tight junction | 44/1091 | 169/8465 | 2.51e-06 | 7.61e-05 | 5.16e-05 | 44 |
| hsa0453014 | Liver | NAFLD | Tight junction | 33/1043 | 169/8465 | 4.52e-03 | 4.12e-02 | 3.32e-02 | 33 |
| hsa0453015 | Liver | NAFLD | Tight junction | 33/1043 | 169/8465 | 4.52e-03 | 4.12e-02 | 3.32e-02 | 33 |
| hsa0453022 | Liver | Cirrhotic | Tight junction | 82/2530 | 169/8465 | 2.14e-07 | 2.85e-06 | 1.76e-06 | 82 |
| hsa0453032 | Liver | Cirrhotic | Tight junction | 82/2530 | 169/8465 | 2.14e-07 | 2.85e-06 | 1.76e-06 | 82 |
| hsa0453042 | Liver | HCC | Tight junction | 110/4020 | 169/8465 | 2.45e-06 | 2.28e-05 | 1.27e-05 | 110 |
| hsa0453052 | Liver | HCC | Tight junction | 110/4020 | 169/8465 | 2.45e-06 | 2.28e-05 | 1.27e-05 | 110 |
| hsa0453029 | Prostate | Tumor | Tight junction | 69/1791 | 169/8465 | 3.92e-09 | 6.18e-08 | 3.83e-08 | 69 |
| hsa0453037 | Prostate | Tumor | Tight junction | 69/1791 | 169/8465 | 3.92e-09 | 6.18e-08 | 3.83e-08 | 69 |
| Page: 1 |
Top |
Cell-cell communication analysis |
| Identification of potential cell-cell interactions between two cell types and their ligand-receptor pairs for different disease states |
| Ligand | Receptor | LRpair | Pathway | Tissue | Disease Stage |
| Page: 1 |
Top |
Single-cell gene regulatory network inference analysis |
| Find out the significant the regulons (TFs) and the target genes of each regulon across cell types for different disease states |
| TF | Cell Type | Tissue | Disease Stage | Target Gene | RSS | Regulon Activity |
| ∗The dot plots of a searched regulon are shown for all cell subpopulations in each disease state of each tissue based on the regulon specific score inferred using pySCENIC and by calculating the average expression. |
| Page: 1 |
Top |
Somatic mutation of malignant transformation related genes |
| Annotation of somatic variants for genes involved in malignant transformation |
| Hugo Symbol | Variant Class | Variant Classification | dbSNP RS | HGVSc | HGVSp | HGVSp Short | SWISSPROT | BIOTYPE | SIFT | PolyPhen | Tumor Sample Barcode | Tissue | Histology | Sex | Age | Stage | Therapy Types | Drugs | Outcome |
| EPB41L4B | SNV | Missense_Mutation | novel | c.1549N>T | p.His517Tyr | p.H517Y | Q9H329 | protein_coding | tolerated(0.39) | possibly_damaging(0.469) | TCGA-AC-A23H-01 | Breast | breast invasive carcinoma | Female | >=65 | I/II | Unknown | Unknown | PD |
| EPB41L4B | SNV | Missense_Mutation | c.982N>A | p.Val328Ile | p.V328I | Q9H329 | protein_coding | deleterious(0.04) | possibly_damaging(0.672) | TCGA-D8-A1JK-01 | Breast | breast invasive carcinoma | Female | >=65 | I/II | Unknown | Unknown | SD | |
| EPB41L4B | SNV | Missense_Mutation | rs368177192 | c.2578G>A | p.Val860Ile | p.V860I | Q9H329 | protein_coding | tolerated_low_confidence(0.61) | benign(0.003) | TCGA-D8-A27W-01 | Breast | breast invasive carcinoma | Female | <65 | III/IV | Chemotherapy | doxorubicine+cyclophosphamide | SD |
| EPB41L4B | insertion | Frame_Shift_Ins | novel | c.1910_1911insACCCAGCTGCCTCCAGG | p.Asn638ProfsTer17 | p.N638Pfs*17 | Q9H329 | protein_coding | TCGA-A8-A0A1-01 | Breast | breast invasive carcinoma | Female | >=65 | I/II | Hormone Therapy | tamoxiphen | SD | ||
| EPB41L4B | insertion | Nonsense_Mutation | novel | c.1908_1909insTTGTCTTACTCCTGAGATAC | p.Ile637LeufsTer5 | p.I637Lfs*5 | Q9H329 | protein_coding | TCGA-A8-A0A1-01 | Breast | breast invasive carcinoma | Female | >=65 | I/II | Hormone Therapy | tamoxiphen | SD | ||
| EPB41L4B | insertion | Frame_Shift_Ins | novel | c.1556dupA | p.Asn519LysfsTer38 | p.N519Kfs*38 | Q9H329 | protein_coding | TCGA-AN-A0AK-01 | Breast | breast invasive carcinoma | Female | >=65 | I/II | Unknown | Unknown | SD | ||
| EPB41L4B | SNV | Missense_Mutation | novel | c.2302N>A | p.Ala768Thr | p.A768T | Q9H329 | protein_coding | tolerated_low_confidence(0.07) | possibly_damaging(0.604) | TCGA-2W-A8YY-01 | Cervix | cervical & endocervical cancer | Female | <65 | I/II | Chemotherapy | cisplatin | CR |
| EPB41L4B | SNV | Missense_Mutation | novel | c.649N>A | p.Glu217Lys | p.E217K | Q9H329 | protein_coding | deleterious(0) | possibly_damaging(0.863) | TCGA-2W-A8YY-01 | Cervix | cervical & endocervical cancer | Female | <65 | I/II | Chemotherapy | cisplatin | CR |
| EPB41L4B | SNV | Missense_Mutation | novel | c.808G>C | p.Glu270Gln | p.E270Q | Q9H329 | protein_coding | deleterious(0.01) | probably_damaging(0.994) | TCGA-JW-A5VL-01 | Cervix | cervical & endocervical cancer | Female | <65 | I/II | Unknown | Unknown | SD |
| EPB41L4B | SNV | Missense_Mutation | c.698C>A | p.Pro233Gln | p.P233Q | Q9H329 | protein_coding | deleterious(0.01) | possibly_damaging(0.897) | TCGA-Q1-A5R3-01 | Cervix | cervical & endocervical cancer | Female | <65 | I/II | Chemotherapy | cisplatin | PR |
| Page: 1 2 3 4 5 6 7 8 9 |
Top |
Related drugs of malignant transformation related genes |
| Identification of chemicals and drugs interact with genes involved in malignant transfromation |
| (DGIdb 4.0) |
| Entrez ID | Symbol | Category | Interaction Types | Drug Claim Name | Drug Name | PMIDs |
| Page: 1 |

Copyright 2023-Present -The University of Texas Health Science Center at Houston |