
|
|||||
|
 | |
| |
| |
| |
| |
| |
|
Gene: EPB41L3 |
Gene summary for EPB41L3 |
| Gene information | Species | Human | Gene symbol | EPB41L3 | Gene ID | 23136 |
| Gene name | erythrocyte membrane protein band 4.1 like 3 | |
| Gene Alias | 4.1B | |
| Cytomap | 18p11.31 | |
| Gene Type | protein-coding | GO ID | GO:0000902 | UniProtAcc | Q9Y2J2 |
Top |
Malignant transformation analysis |
| Identification of the aberrant gene expression in precancerous and cancerous lesions by comparing the gene expression of stem-like cells in diseased tissues with normal stem cells |
| Entrez ID | Symbol | Replicates | Species | Organ | Tissue | Adj P-value | Log2FC | Malignancy |
| 23136 | EPB41L3 | HTA11_3410_2000001011 | Human | Colorectum | AD | 1.38e-08 | -4.61e-01 | 0.0155 |
| 23136 | EPB41L3 | HTA11_866_3004761011 | Human | Colorectum | AD | 7.14e-11 | -5.37e-01 | 0.096 |
| 23136 | EPB41L3 | HTA11_7696_3000711011 | Human | Colorectum | AD | 1.53e-06 | -3.17e-01 | 0.0674 |
| 23136 | EPB41L3 | HTA11_6818_2000001021 | Human | Colorectum | AD | 5.23e-04 | -5.28e-01 | 0.0588 |
| 23136 | EPB41L3 | HTA11_99999970781_79442 | Human | Colorectum | MSS | 6.47e-06 | -3.01e-01 | 0.294 |
| 23136 | EPB41L3 | HTA11_99999965104_69814 | Human | Colorectum | MSS | 2.38e-05 | -5.43e-01 | 0.281 |
| 23136 | EPB41L3 | HTA11_99999971662_82457 | Human | Colorectum | MSS | 4.60e-22 | -5.54e-01 | 0.3859 |
| 23136 | EPB41L3 | HTA11_99999973899_84307 | Human | Colorectum | MSS | 4.78e-06 | -5.69e-01 | 0.2585 |
| 23136 | EPB41L3 | HTA11_99999974143_84620 | Human | Colorectum | MSS | 3.31e-23 | -5.55e-01 | 0.3005 |
| 23136 | EPB41L3 | F007 | Human | Colorectum | FAP | 9.42e-04 | -4.35e-01 | 0.1176 |
| 23136 | EPB41L3 | A002-C-010 | Human | Colorectum | FAP | 1.06e-26 | -5.56e-01 | 0.242 |
| 23136 | EPB41L3 | A001-C-207 | Human | Colorectum | FAP | 1.61e-04 | -3.94e-01 | 0.1278 |
| 23136 | EPB41L3 | A015-C-203 | Human | Colorectum | FAP | 2.38e-20 | -4.19e-01 | -0.1294 |
| 23136 | EPB41L3 | A015-C-204 | Human | Colorectum | FAP | 3.66e-05 | -4.19e-01 | -0.0228 |
| 23136 | EPB41L3 | A014-C-040 | Human | Colorectum | FAP | 6.61e-05 | -5.69e-01 | -0.1184 |
| 23136 | EPB41L3 | A002-C-201 | Human | Colorectum | FAP | 1.38e-14 | -5.05e-01 | 0.0324 |
| 23136 | EPB41L3 | A002-C-203 | Human | Colorectum | FAP | 9.87e-21 | -5.23e-01 | 0.2786 |
| 23136 | EPB41L3 | A001-C-119 | Human | Colorectum | FAP | 4.40e-08 | -5.02e-01 | -0.1557 |
| 23136 | EPB41L3 | A001-C-108 | Human | Colorectum | FAP | 3.17e-20 | -4.63e-01 | -0.0272 |
| 23136 | EPB41L3 | A002-C-021 | Human | Colorectum | FAP | 6.23e-08 | -4.12e-01 | 0.1171 |
| Page: 1 2 3 |
| Tissue | Expression Dynamics | Abbreviation |
| Colorectum (GSE201348) |  | FAP: Familial adenomatous polyposis |
| CRC: Colorectal cancer | ||
| Colorectum (HTA11) | 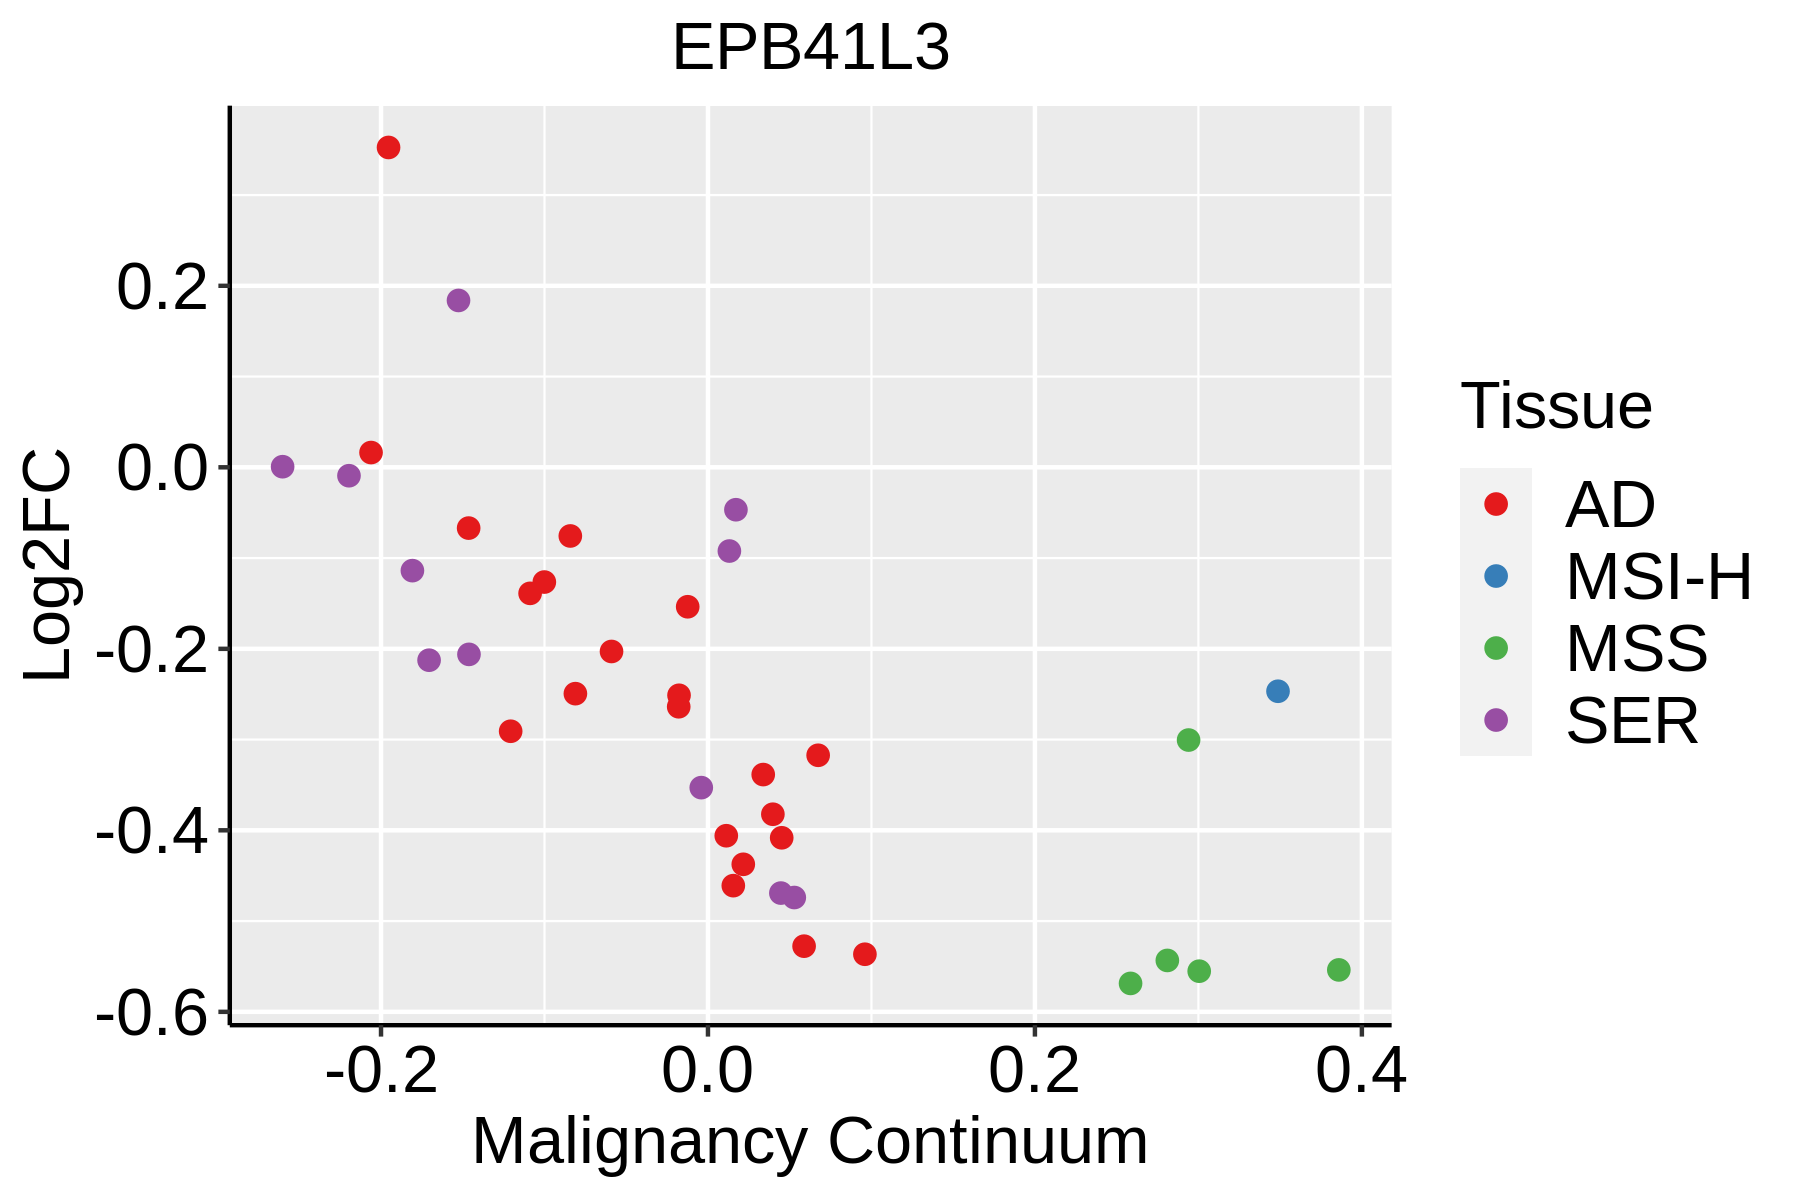 | AD: Adenomas |
| SER: Sessile serrated lesions | ||
| MSI-H: Microsatellite-high colorectal cancer | ||
| MSS: Microsatellite stable colorectal cancer | ||
| GC | 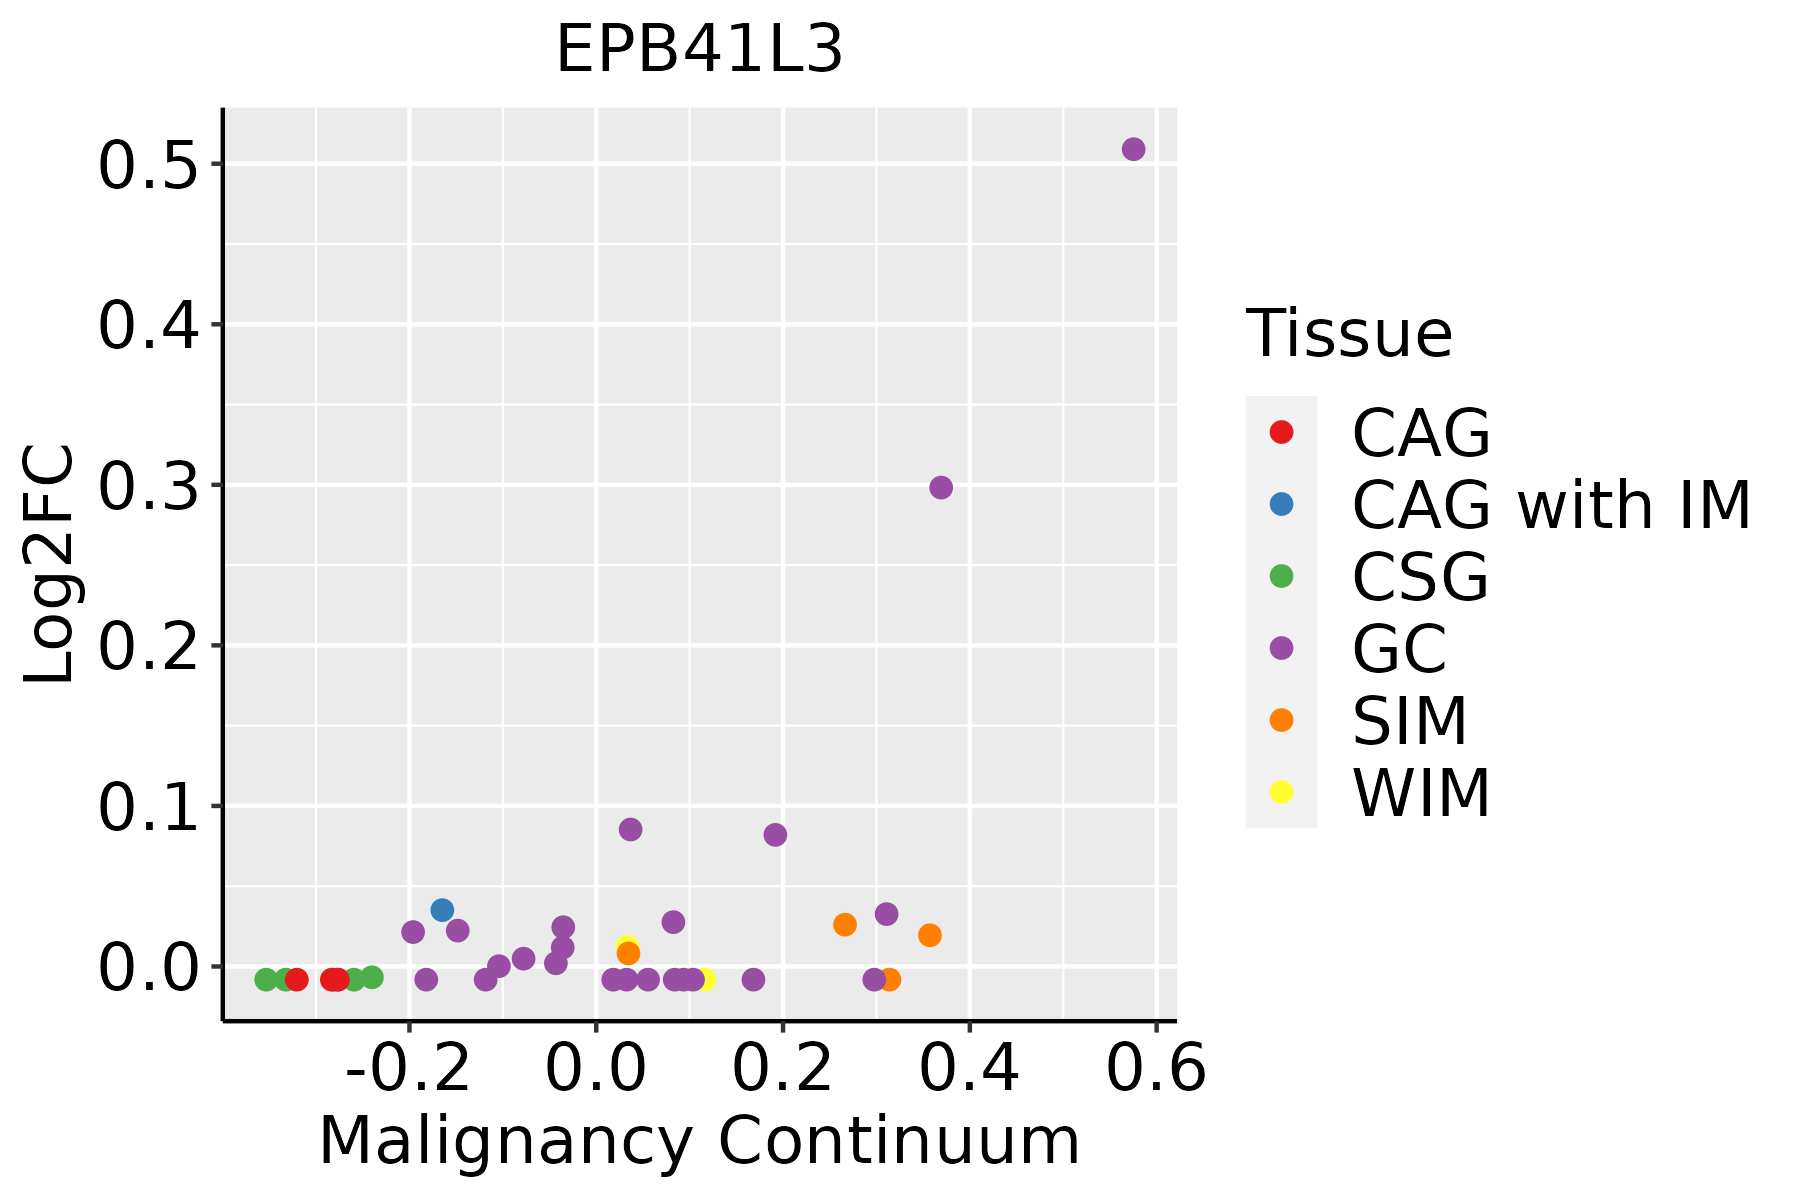 | CAG: Chronic atrophic gastritis |
| CAG with IM: Chronic atrophic gastritis with intestinal metaplasia | ||
| CSG: Chronic superficial gastritis | ||
| GC: Gastric cancer | ||
| SIM: Severe intestinal metaplasia | ||
| WIM: Wild intestinal metaplasia | ||
| Liver |  | HCC: Hepatocellular carcinoma |
| NAFLD: Non-alcoholic fatty liver disease | ||
| Thyroid | 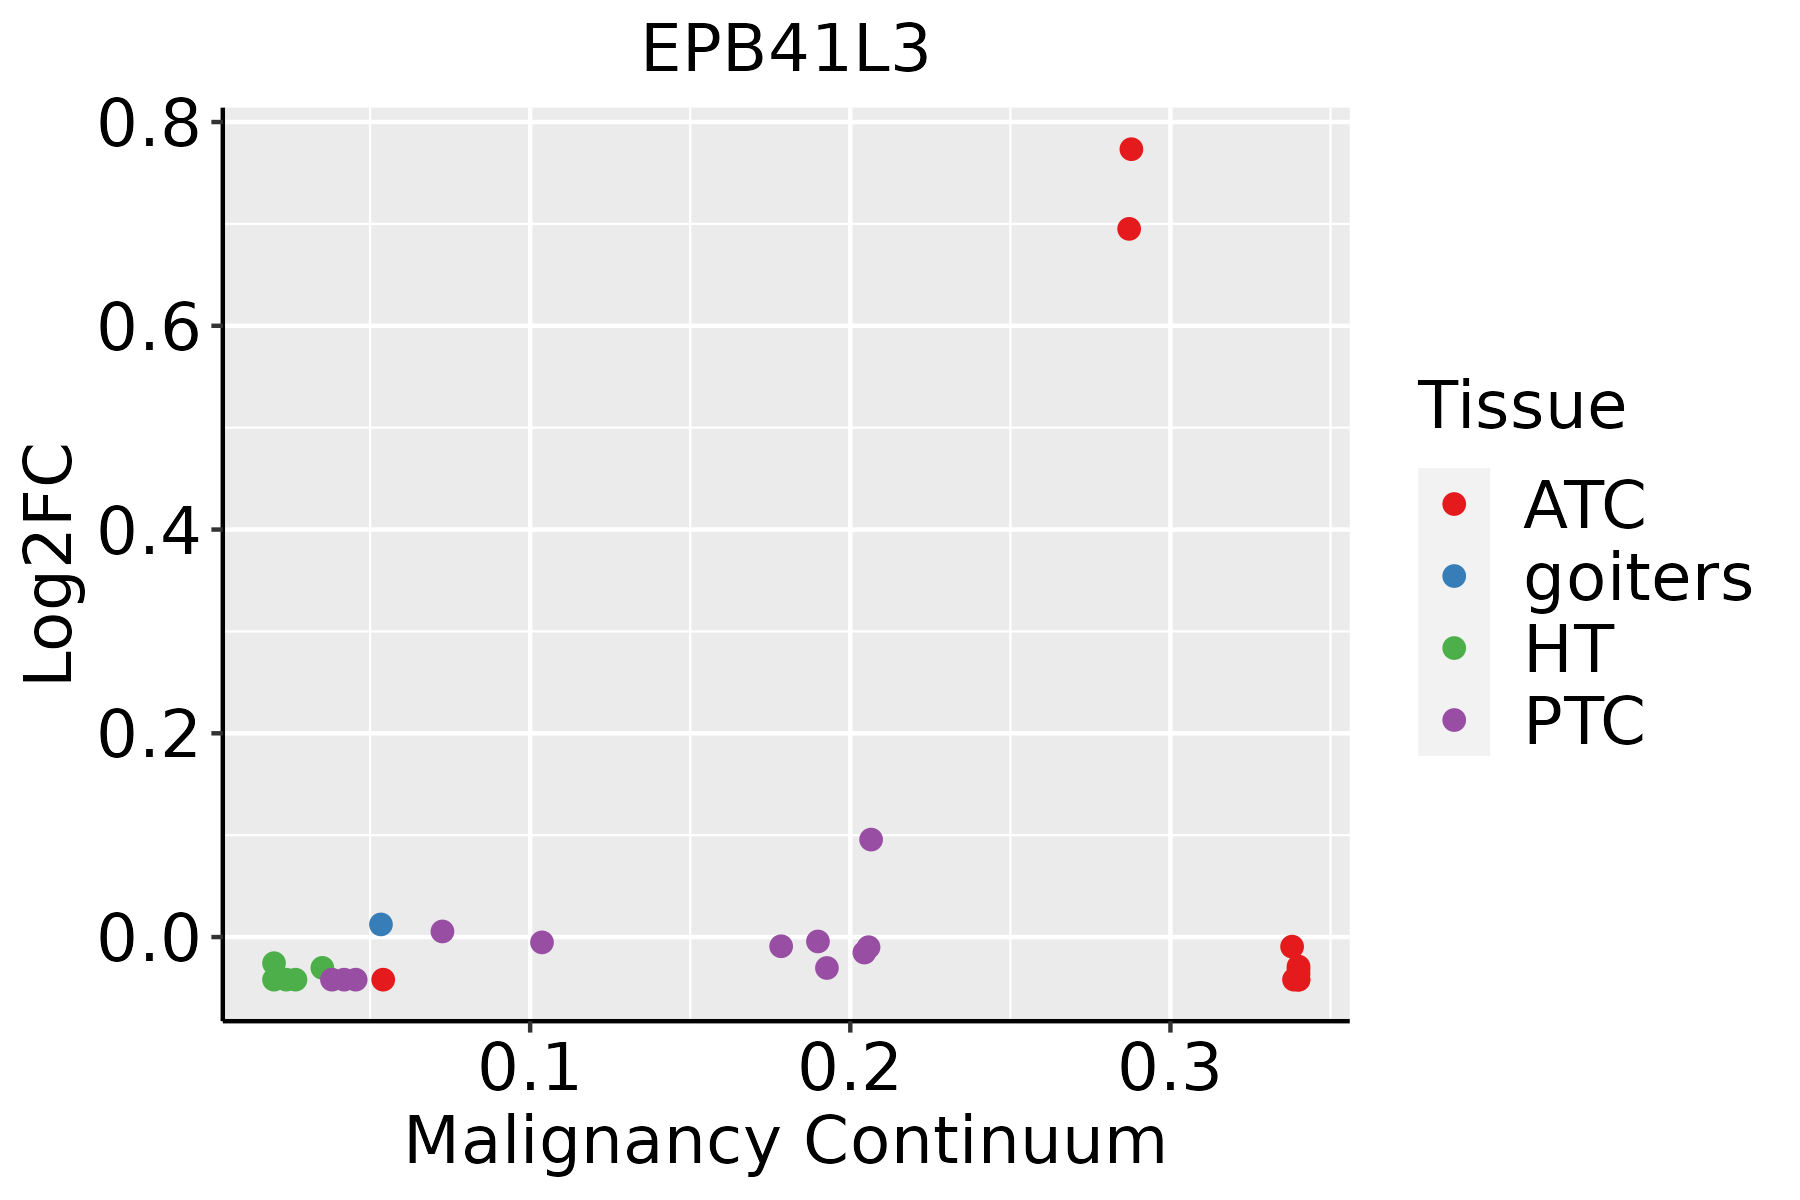 | ATC: Anaplastic thyroid cancer |
| HT: Hashimoto's thyroiditis | ||
| PTC: Papillary thyroid cancer |
| ∗log2FC in expression of this searched gene in stem-like cells from each diseased tissue sample relative to stem-like cells in normal samples in each tissue plotted against the malignancy continuum. Samples are colored based on if they are from different disease stage. |
Top |
Malignant transformation related pathway analysis |
| Find out the enriched GO biological processes and KEGG pathways involved in transition from healthy to precancer to cancer |
| Tissue | Disease Stage | Enriched GO biological Processes |
| Colorectum | AD |  |
| Colorectum | SER |  |
| Colorectum | MSS |  |
| Colorectum | MSI-H |  |
| Colorectum | FAP |  |
| ∗Top 15 enriched GO BP terms are showed in the bar plot of each disease state in each tissue. Each row represents a significant GO biological process which is colored according to the -log10(p.adjust). |
| Page: 1 2 3 4 5 6 7 8 9 |
| GO ID | Tissue | Disease Stage | Description | Gene Ratio | Bg Ratio | pvalue | p.adjust | Count |
| GO:0072659 | Colorectum | AD | protein localization to plasma membrane | 122/3918 | 284/18723 | 2.86e-17 | 1.49e-14 | 122 |
| GO:1990778 | Colorectum | AD | protein localization to cell periphery | 129/3918 | 333/18723 | 5.51e-14 | 1.15e-11 | 129 |
| GO:0045216 | Colorectum | AD | cell-cell junction organization | 80/3918 | 200/18723 | 5.57e-10 | 4.58e-08 | 80 |
| GO:0022604 | Colorectum | AD | regulation of cell morphogenesis | 109/3918 | 309/18723 | 3.08e-09 | 2.07e-07 | 109 |
| GO:0034329 | Colorectum | AD | cell junction assembly | 136/3918 | 420/18723 | 2.02e-08 | 1.15e-06 | 136 |
| GO:0007043 | Colorectum | AD | cell-cell junction assembly | 57/3918 | 146/18723 | 4.18e-07 | 1.61e-05 | 57 |
| GO:0016049 | Colorectum | AD | cell growth | 143/3918 | 482/18723 | 2.83e-06 | 8.09e-05 | 143 |
| GO:0008360 | Colorectum | AD | regulation of cell shape | 56/3918 | 154/18723 | 7.01e-06 | 1.73e-04 | 56 |
| GO:0001558 | Colorectum | AD | regulation of cell growth | 124/3918 | 414/18723 | 7.67e-06 | 1.86e-04 | 124 |
| GO:0031032 | Colorectum | AD | actomyosin structure organization | 65/3918 | 196/18723 | 4.17e-05 | 7.37e-04 | 65 |
| GO:0030866 | Colorectum | AD | cortical actin cytoskeleton organization | 19/3918 | 40/18723 | 1.58e-04 | 2.20e-03 | 19 |
| GO:0030865 | Colorectum | AD | cortical cytoskeleton organization | 25/3918 | 61/18723 | 2.96e-04 | 3.60e-03 | 25 |
| GO:0043217 | Colorectum | AD | myelin maintenance | 9/3918 | 18/18723 | 5.82e-03 | 3.67e-02 | 9 |
| GO:00726592 | Colorectum | MSS | protein localization to plasma membrane | 113/3467 | 284/18723 | 3.23e-17 | 1.55e-14 | 113 |
| GO:19907782 | Colorectum | MSS | protein localization to cell periphery | 120/3467 | 333/18723 | 2.02e-14 | 5.47e-12 | 120 |
| GO:00226042 | Colorectum | MSS | regulation of cell morphogenesis | 103/3467 | 309/18723 | 2.70e-10 | 2.56e-08 | 103 |
| GO:00452162 | Colorectum | MSS | cell-cell junction organization | 69/3467 | 200/18723 | 5.07e-08 | 2.70e-06 | 69 |
| GO:00343292 | Colorectum | MSS | cell junction assembly | 120/3467 | 420/18723 | 2.51e-07 | 1.07e-05 | 120 |
| GO:00070432 | Colorectum | MSS | cell-cell junction assembly | 50/3467 | 146/18723 | 4.24e-06 | 1.21e-04 | 50 |
| GO:00083602 | Colorectum | MSS | regulation of cell shape | 52/3467 | 154/18723 | 4.40e-06 | 1.24e-04 | 52 |
| Page: 1 2 3 4 5 |
| Pathway ID | Tissue | Disease Stage | Description | Gene Ratio | Bg Ratio | pvalue | p.adjust | qvalue | Count |
| Page: 1 |
Top |
Cell-cell communication analysis |
| Identification of potential cell-cell interactions between two cell types and their ligand-receptor pairs for different disease states |
| Ligand | Receptor | LRpair | Pathway | Tissue | Disease Stage |
| Page: 1 |
Top |
Single-cell gene regulatory network inference analysis |
| Find out the significant the regulons (TFs) and the target genes of each regulon across cell types for different disease states |
| TF | Cell Type | Tissue | Disease Stage | Target Gene | RSS | Regulon Activity |
| ∗The dot plots of a searched regulon are shown for all cell subpopulations in each disease state of each tissue based on the regulon specific score inferred using pySCENIC and by calculating the average expression. |
| Page: 1 |
Top |
Somatic mutation of malignant transformation related genes |
| Annotation of somatic variants for genes involved in malignant transformation |
| Hugo Symbol | Variant Class | Variant Classification | dbSNP RS | HGVSc | HGVSp | HGVSp Short | SWISSPROT | BIOTYPE | SIFT | PolyPhen | Tumor Sample Barcode | Tissue | Histology | Sex | Age | Stage | Therapy Types | Drugs | Outcome |
| EPB41L3 | SNV | Missense_Mutation | c.1030N>G | p.Arg344Gly | p.R344G | Q9Y2J2 | protein_coding | deleterious(0) | probably_damaging(0.93) | TCGA-A2-A0YJ-01 | Breast | breast invasive carcinoma | Female | <65 | III/IV | Chemotherapy | cytoxan | PD | |
| EPB41L3 | SNV | Missense_Mutation | c.730N>A | p.Glu244Lys | p.E244K | Q9Y2J2 | protein_coding | deleterious(0) | possibly_damaging(0.556) | TCGA-A7-A5ZW-01 | Breast | breast invasive carcinoma | Female | <65 | I/II | Chemotherapy | cyclophosphamide | CR | |
| EPB41L3 | SNV | Missense_Mutation | c.1294N>T | p.Arg432Cys | p.R432C | Q9Y2J2 | protein_coding | deleterious(0) | probably_damaging(1) | TCGA-A8-A09Z-01 | Breast | breast invasive carcinoma | Female | >=65 | I/II | Unknown | Unknown | SD | |
| EPB41L3 | SNV | Missense_Mutation | c.2363C>T | p.Ser788Phe | p.S788F | Q9Y2J2 | protein_coding | tolerated(0.06) | benign(0.429) | TCGA-AC-A23H-01 | Breast | breast invasive carcinoma | Female | >=65 | I/II | Unknown | Unknown | PD | |
| EPB41L3 | SNV | Missense_Mutation | c.256N>G | p.Lys86Glu | p.K86E | Q9Y2J2 | protein_coding | tolerated(0.13) | benign(0.023) | TCGA-AN-A0AK-01 | Breast | breast invasive carcinoma | Female | >=65 | I/II | Unknown | Unknown | SD | |
| EPB41L3 | SNV | Missense_Mutation | c.2258N>G | p.Asn753Ser | p.N753S | Q9Y2J2 | protein_coding | tolerated(0.17) | benign(0.021) | TCGA-AN-A0AR-01 | Breast | breast invasive carcinoma | Female | <65 | I/II | Unknown | Unknown | SD | |
| EPB41L3 | SNV | Missense_Mutation | c.2746C>G | p.Gln916Glu | p.Q916E | Q9Y2J2 | protein_coding | tolerated(0.26) | benign(0.007) | TCGA-AN-A0XU-01 | Breast | breast invasive carcinoma | Female | <65 | I/II | Unknown | Unknown | SD | |
| EPB41L3 | SNV | Missense_Mutation | novel | c.452N>C | p.Phe151Ser | p.F151S | Q9Y2J2 | protein_coding | deleterious(0) | probably_damaging(1) | TCGA-AO-A124-01 | Breast | breast invasive carcinoma | Female | <65 | I/II | Chemotherapy | doxorubicin | SD |
| EPB41L3 | SNV | Missense_Mutation | rs749000237 | c.2777N>A | p.Arg926Gln | p.R926Q | Q9Y2J2 | protein_coding | tolerated(1) | benign(0) | TCGA-BH-A0H5-01 | Breast | breast invasive carcinoma | Female | <65 | I/II | Chemotherapy | cytoxan | CR |
| EPB41L3 | SNV | Missense_Mutation | rs147930423 | c.3125N>T | p.Thr1042Met | p.T1042M | Q9Y2J2 | protein_coding | deleterious(0) | probably_damaging(0.998) | TCGA-BH-A1EX-01 | Breast | breast invasive carcinoma | Female | >=65 | I/II | Unknown | Unknown | PD |
| Page: 1 2 3 4 5 6 7 8 9 10 11 12 13 14 15 16 17 18 19 20 21 22 23 24 25 |
Top |
Related drugs of malignant transformation related genes |
| Identification of chemicals and drugs interact with genes involved in malignant transfromation |
| (DGIdb 4.0) |
| Entrez ID | Symbol | Category | Interaction Types | Drug Claim Name | Drug Name | PMIDs |
| Page: 1 |

Copyright 2023-Present -The University of Texas Health Science Center at Houston |