| Tissue | Expression Dynamics | Abbreviation |
| Colorectum (GSE201348) |  | FAP: Familial adenomatous polyposis |
| CRC: Colorectal cancer |
| Colorectum (HTA11) | 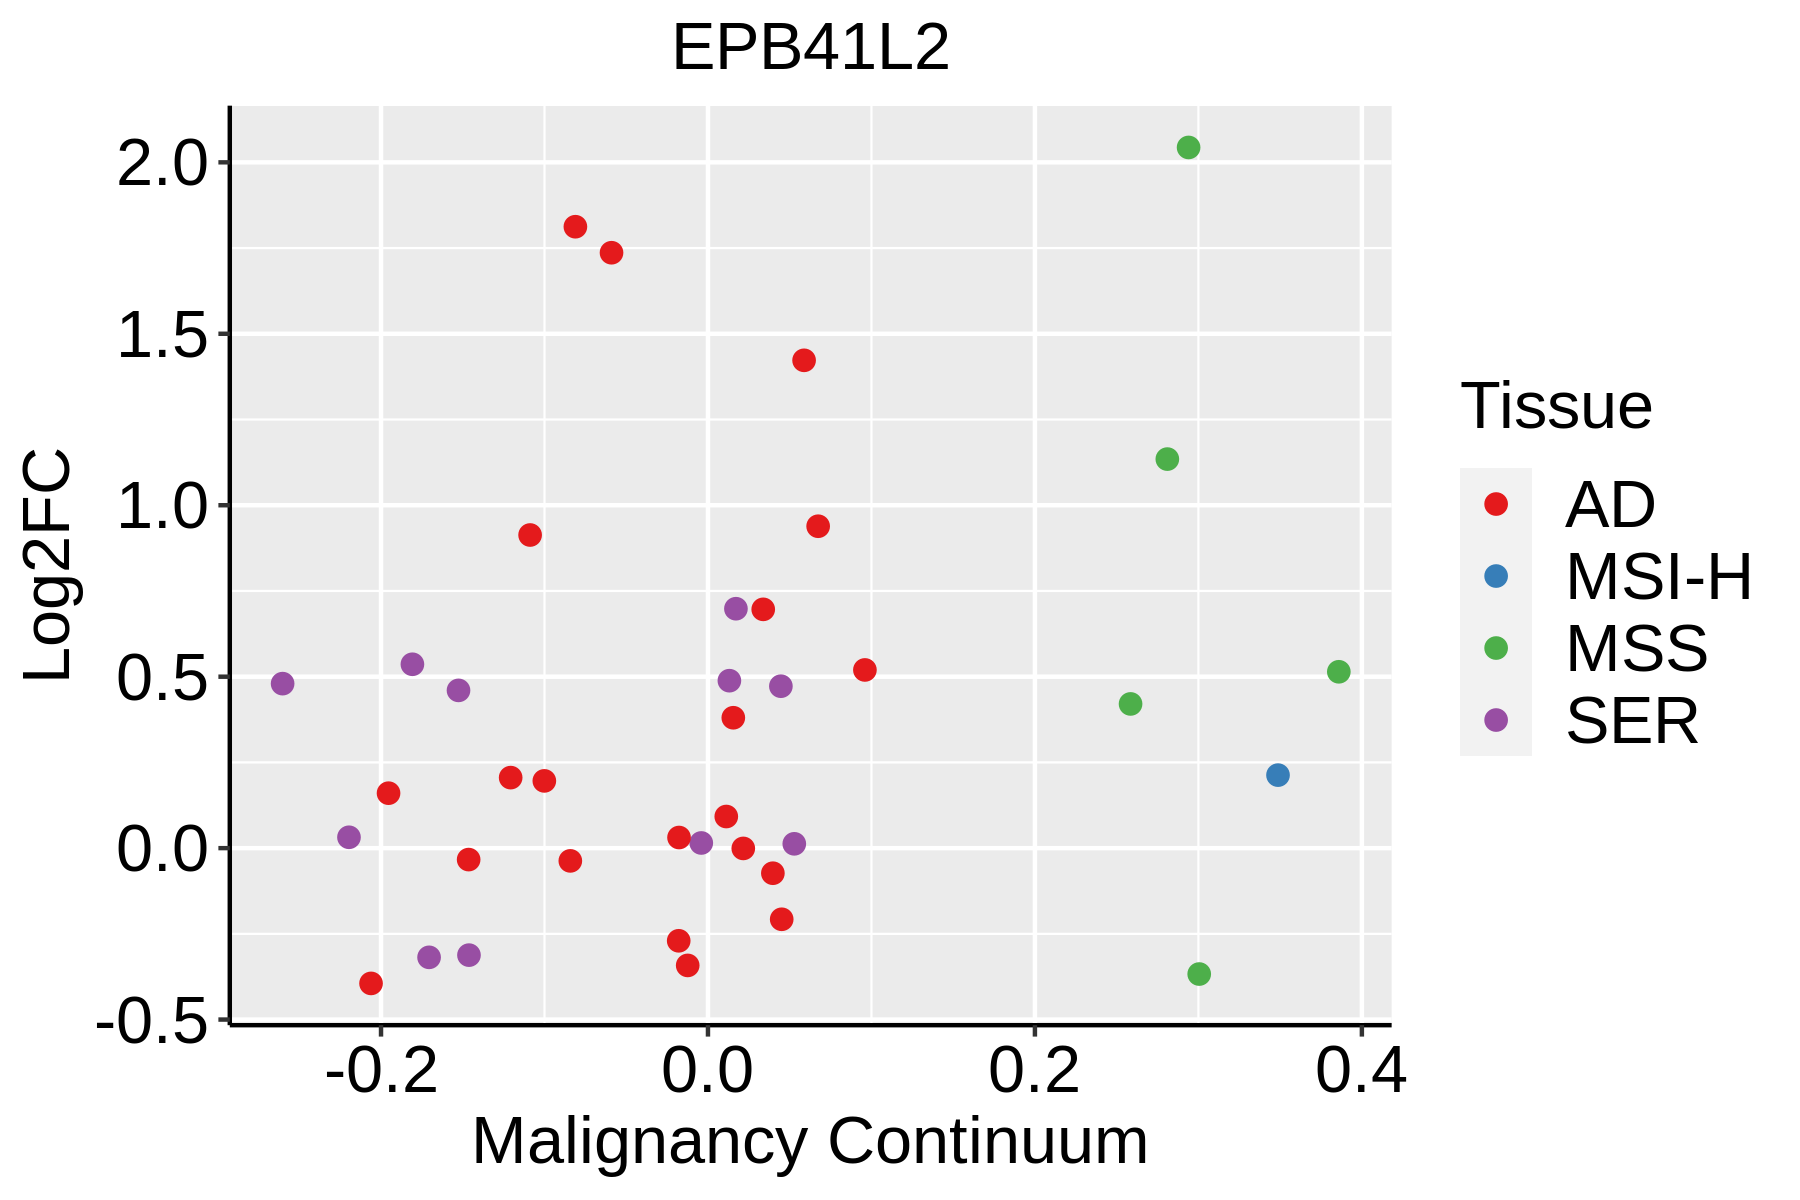 | AD: Adenomas |
| SER: Sessile serrated lesions |
| MSI-H: Microsatellite-high colorectal cancer |
| MSS: Microsatellite stable colorectal cancer |
| Endometrium | 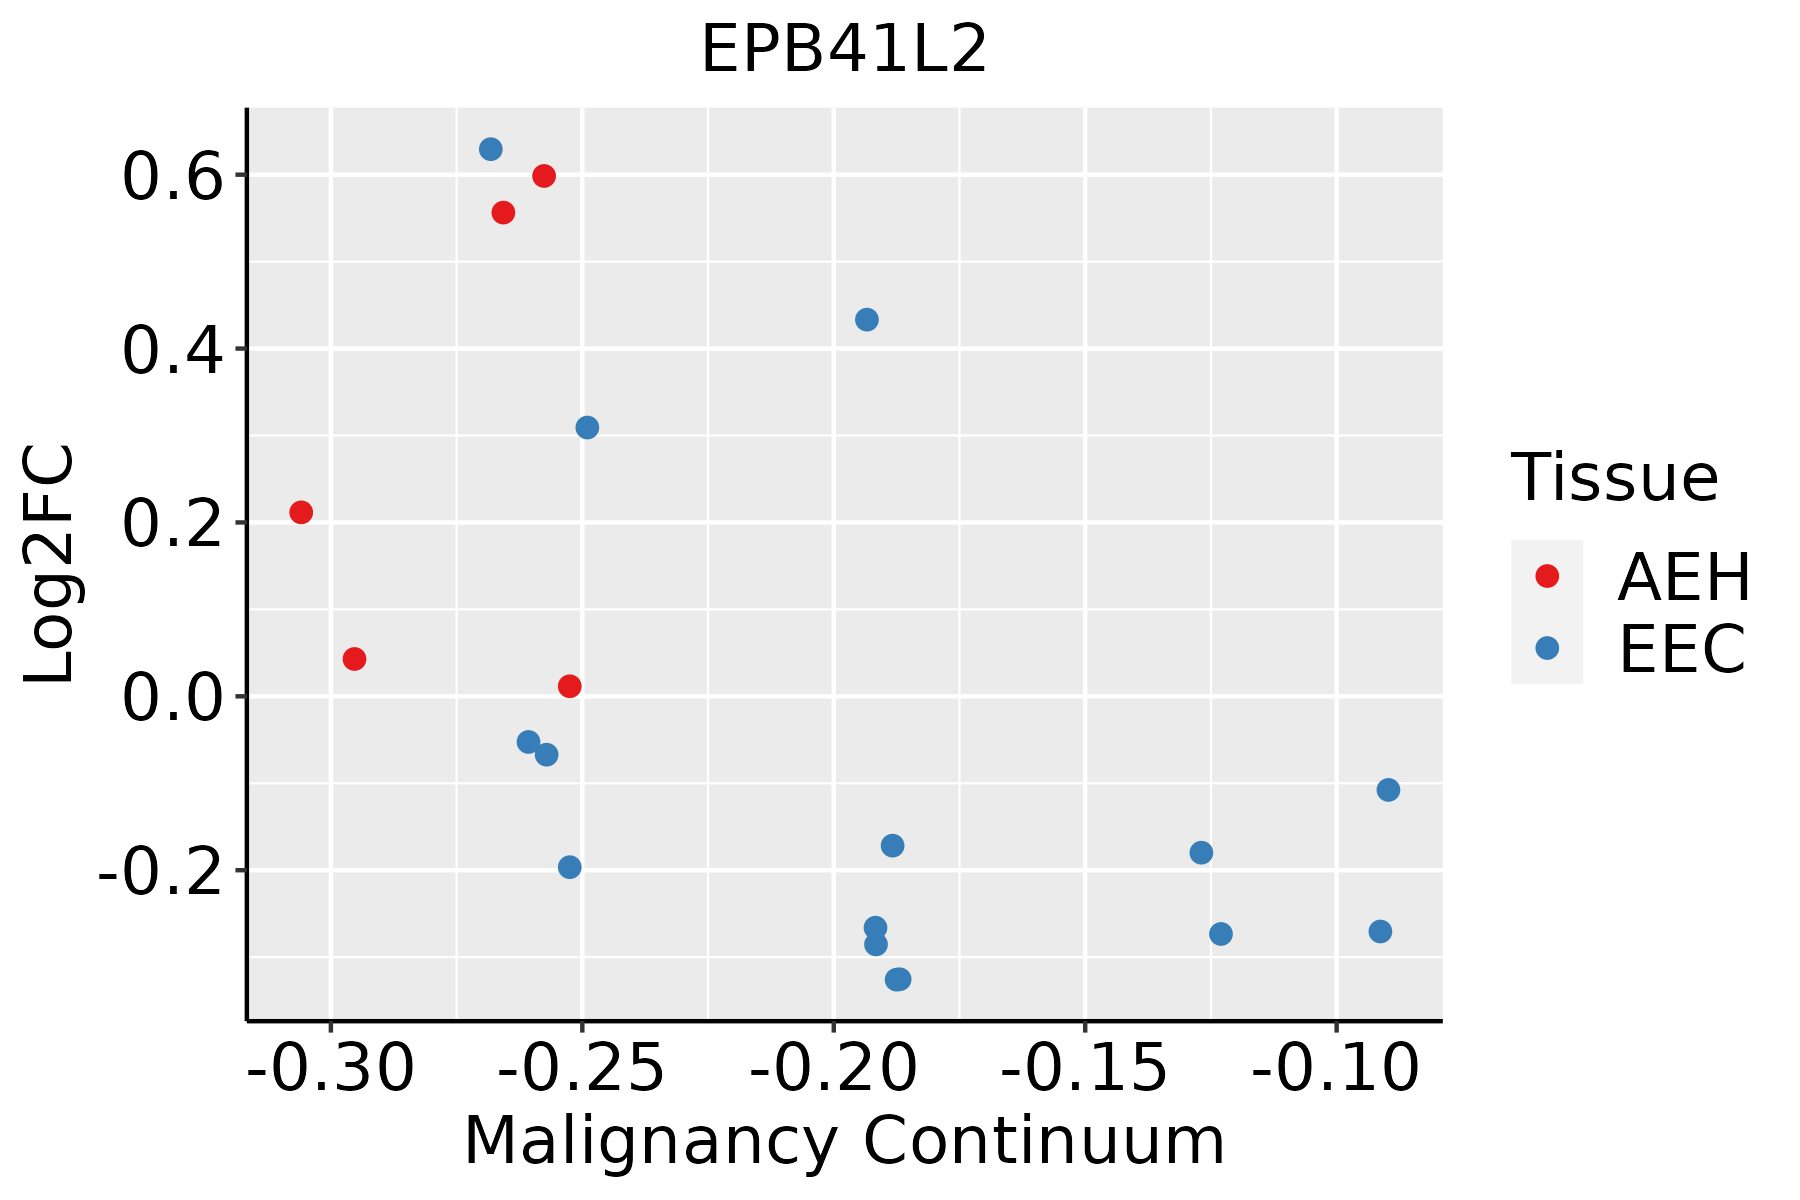 | AEH: Atypical endometrial hyperplasia |
| EEC: Endometrioid Cancer |
| Esophagus | 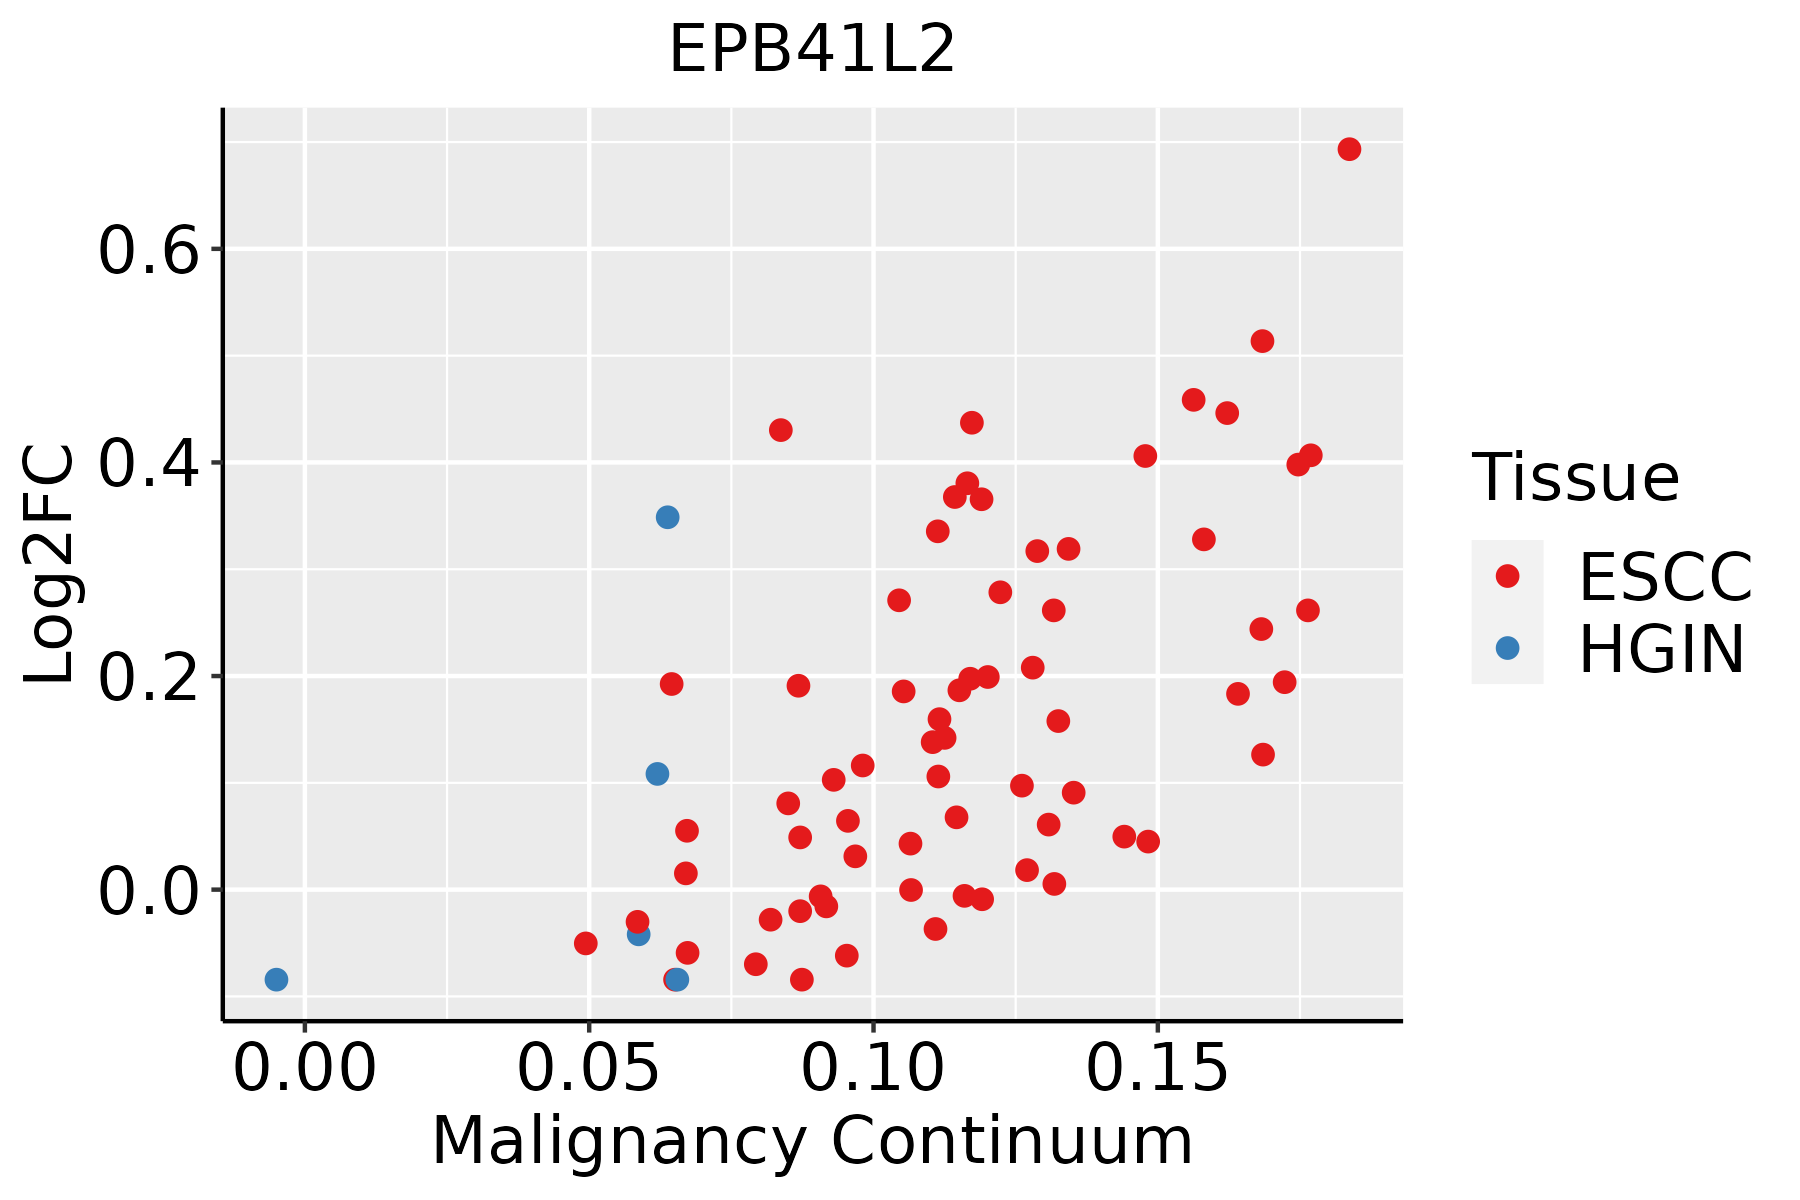 | ESCC: Esophageal squamous cell carcinoma |
| HGIN: High-grade intraepithelial neoplasias |
| LGIN: Low-grade intraepithelial neoplasias |
| Liver | 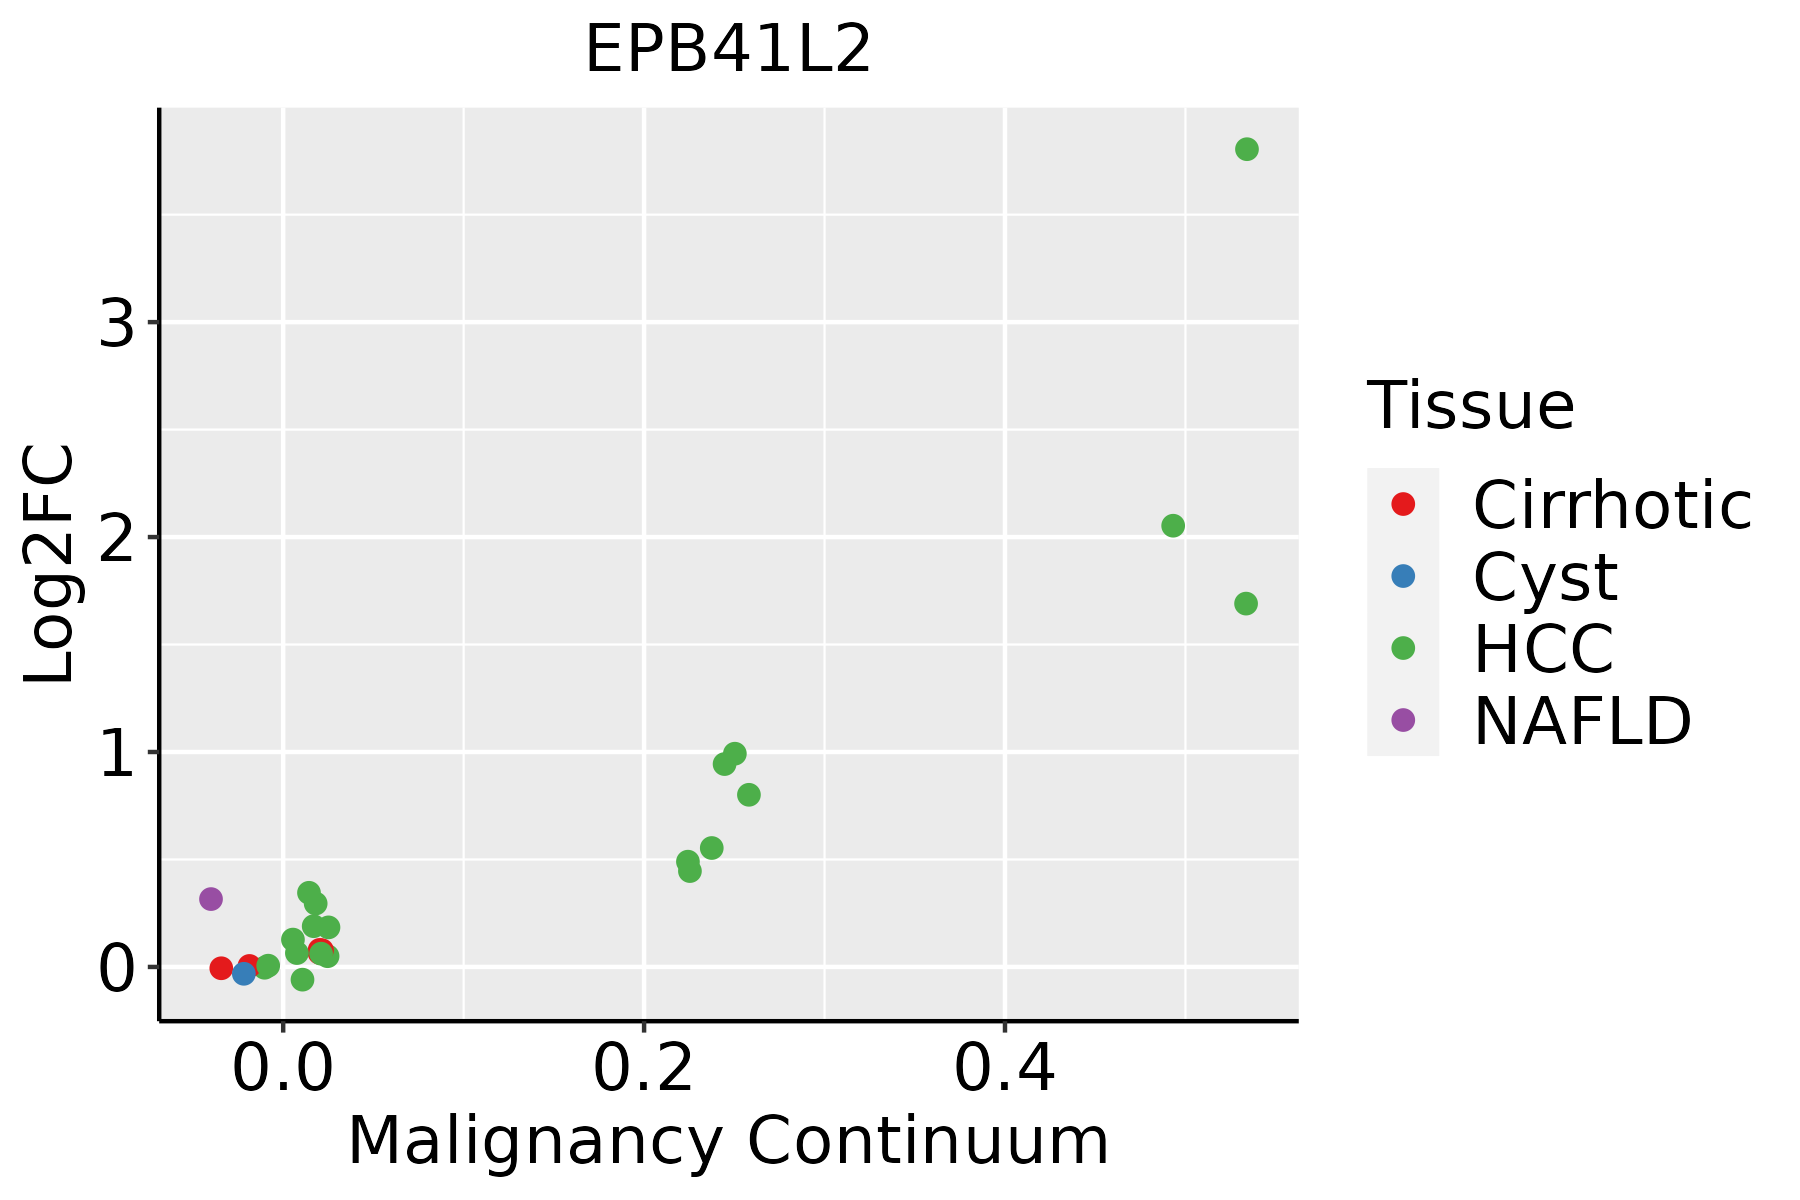 | HCC: Hepatocellular carcinoma |
| NAFLD: Non-alcoholic fatty liver disease |
| Oral Cavity | 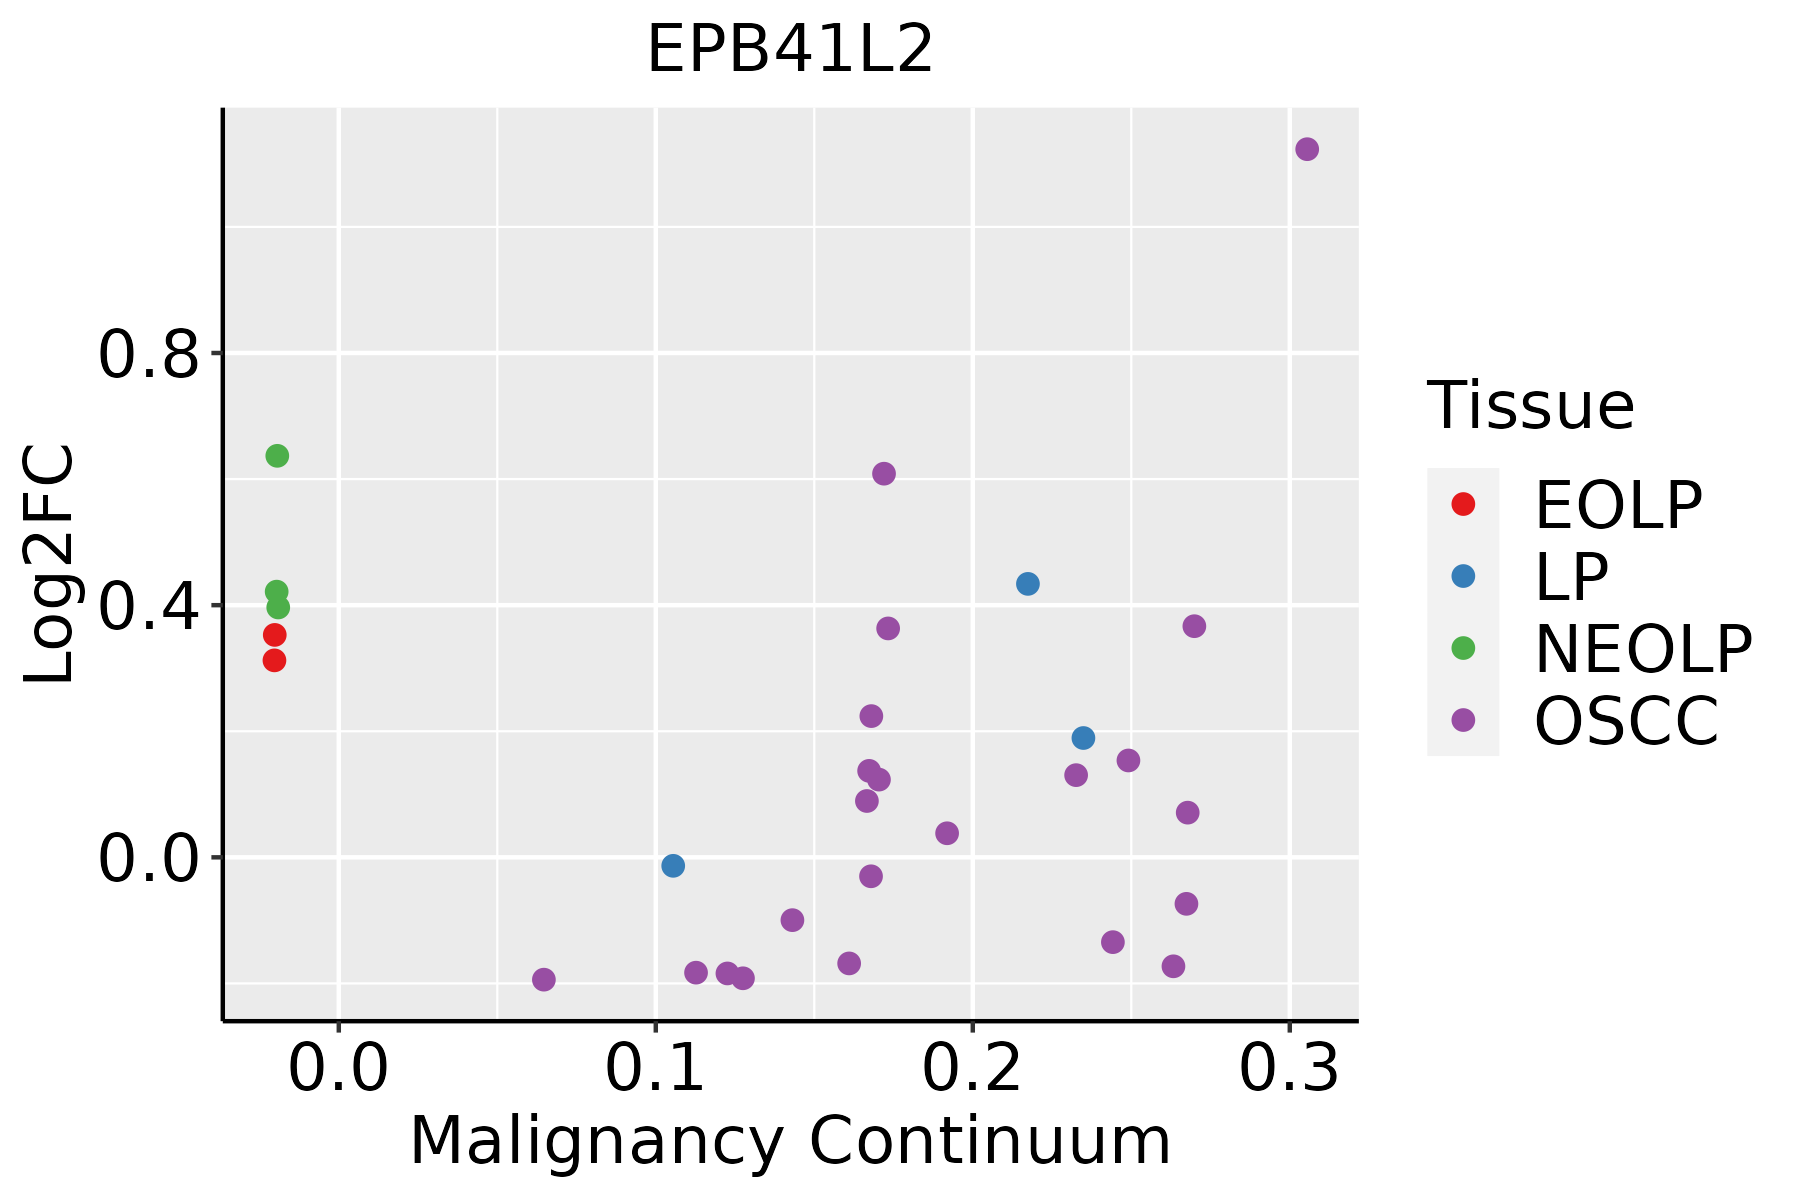 | EOLP: Erosive Oral lichen planus |
| LP: leukoplakia |
| NEOLP: Non-erosive oral lichen planus |
| OSCC: Oral squamous cell carcinoma |
| Thyroid |  | ATC: Anaplastic thyroid cancer |
| HT: Hashimoto's thyroiditis |
| PTC: Papillary thyroid cancer |
| GO ID | Tissue | Disease Stage | Description | Gene Ratio | Bg Ratio | pvalue | p.adjust | Count |
| GO:1990778 | Colorectum | AD | protein localization to cell periphery | 129/3918 | 333/18723 | 5.51e-14 | 1.15e-11 | 129 |
| GO:1903829 | Colorectum | AD | positive regulation of cellular protein localization | 110/3918 | 276/18723 | 4.58e-13 | 8.44e-11 | 110 |
| GO:1904375 | Colorectum | AD | regulation of protein localization to cell periphery | 54/3918 | 125/18723 | 1.52e-08 | 9.00e-07 | 54 |
| GO:1904377 | Colorectum | AD | positive regulation of protein localization to cell periphery | 30/3918 | 69/18723 | 1.98e-05 | 4.05e-04 | 30 |
| GO:0031032 | Colorectum | AD | actomyosin structure organization | 65/3918 | 196/18723 | 4.17e-05 | 7.37e-04 | 65 |
| GO:0030866 | Colorectum | AD | cortical actin cytoskeleton organization | 19/3918 | 40/18723 | 1.58e-04 | 2.20e-03 | 19 |
| GO:0030865 | Colorectum | AD | cortical cytoskeleton organization | 25/3918 | 61/18723 | 2.96e-04 | 3.60e-03 | 25 |
| GO:19038291 | Colorectum | SER | positive regulation of cellular protein localization | 86/2897 | 276/18723 | 3.61e-11 | 6.11e-09 | 86 |
| GO:19907781 | Colorectum | SER | protein localization to cell periphery | 98/2897 | 333/18723 | 6.09e-11 | 9.57e-09 | 98 |
| GO:19043751 | Colorectum | SER | regulation of protein localization to cell periphery | 40/2897 | 125/18723 | 2.85e-06 | 1.16e-04 | 40 |
| GO:19043771 | Colorectum | SER | positive regulation of protein localization to cell periphery | 23/2897 | 69/18723 | 1.78e-04 | 3.30e-03 | 23 |
| GO:00308651 | Colorectum | SER | cortical cytoskeleton organization | 19/2897 | 61/18723 | 1.59e-03 | 1.69e-02 | 19 |
| GO:00308661 | Colorectum | SER | cortical actin cytoskeleton organization | 14/2897 | 40/18723 | 1.88e-03 | 1.90e-02 | 14 |
| GO:00310321 | Colorectum | SER | actomyosin structure organization | 45/2897 | 196/18723 | 3.60e-03 | 3.03e-02 | 45 |
| GO:19907782 | Colorectum | MSS | protein localization to cell periphery | 120/3467 | 333/18723 | 2.02e-14 | 5.47e-12 | 120 |
| GO:19038292 | Colorectum | MSS | positive regulation of cellular protein localization | 103/3467 | 276/18723 | 1.12e-13 | 2.67e-11 | 103 |
| GO:19043752 | Colorectum | MSS | regulation of protein localization to cell periphery | 51/3467 | 125/18723 | 5.46e-09 | 3.55e-07 | 51 |
| GO:19043772 | Colorectum | MSS | positive regulation of protein localization to cell periphery | 28/3467 | 69/18723 | 1.65e-05 | 3.64e-04 | 28 |
| GO:00308652 | Colorectum | MSS | cortical cytoskeleton organization | 24/3467 | 61/18723 | 1.16e-04 | 1.81e-03 | 24 |
| GO:00308662 | Colorectum | MSS | cortical actin cytoskeleton organization | 17/3467 | 40/18723 | 3.87e-04 | 4.86e-03 | 17 |
| Hugo Symbol | Variant Class | Variant Classification | dbSNP RS | HGVSc | HGVSp | HGVSp Short | SWISSPROT | BIOTYPE | SIFT | PolyPhen | Tumor Sample Barcode | Tissue | Histology | Sex | Age | Stage | Therapy Types | Drugs | Outcome |
| EPB41L2 | SNV | Missense_Mutation | | c.2881A>C | p.Thr961Pro | p.T961P | O43491 | protein_coding | deleterious(0) | probably_damaging(0.999) | TCGA-A8-A09M-01 | Breast | breast invasive carcinoma | Female | >=65 | III/IV | Chemotherapy | paclitaxel | CR |
| EPB41L2 | SNV | Missense_Mutation | rs140419333 | c.1987C>T | p.Arg663Cys | p.R663C | O43491 | protein_coding | deleterious(0) | probably_damaging(0.938) | TCGA-AC-A5XU-01 | Breast | breast invasive carcinoma | Female | >=65 | I/II | Hormone Therapy | letrozole | SD |
| EPB41L2 | SNV | Missense_Mutation | rs765521376 | c.1354N>T | p.Arg452Cys | p.R452C | O43491 | protein_coding | deleterious(0) | probably_damaging(0.999) | TCGA-AC-A62Y-01 | Breast | breast invasive carcinoma | Female | >=65 | I/II | Unknown | Unknown | SD |
| EPB41L2 | SNV | Missense_Mutation | | c.2851N>A | p.Glu951Lys | p.E951K | O43491 | protein_coding | deleterious(0) | possibly_damaging(0.848) | TCGA-C8-A26Y-01 | Breast | breast invasive carcinoma | Female | >=65 | I/II | Unknown | Unknown | SD |
| EPB41L2 | SNV | Missense_Mutation | rs778911472 | c.1061N>A | p.Gly354Asp | p.G354D | O43491 | protein_coding | tolerated(0.15) | benign(0.003) | TCGA-D8-A1J8-01 | Breast | breast invasive carcinoma | Female | >=65 | I/II | Hormone Therapy | nolvadex | SD |
| EPB41L2 | SNV | Missense_Mutation | | c.1114N>A | p.Glu372Lys | p.E372K | O43491 | protein_coding | deleterious(0) | probably_damaging(0.999) | TCGA-E2-A153-01 | Breast | breast invasive carcinoma | Female | <65 | I/II | Chemotherapy | doxorubicin | SD |
| EPB41L2 | SNV | Missense_Mutation | | c.2907N>G | p.Asp969Glu | p.D969E | O43491 | protein_coding | deleterious(0) | probably_damaging(0.999) | TCGA-E9-A22B-01 | Breast | breast invasive carcinoma | Female | >=65 | I/II | Hormone Therapy | tamoxiphen | SD |
| EPB41L2 | SNV | Missense_Mutation | | c.2723C>G | p.Ser908Cys | p.S908C | O43491 | protein_coding | deleterious(0) | possibly_damaging(0.894) | TCGA-GM-A2D9-01 | Breast | breast invasive carcinoma | Female | >=65 | I/II | Hormone Therapy | arimidex | SD |
| EPB41L2 | insertion | Frame_Shift_Ins | novel | c.2634_2635insTTATTAATCGATGAATTATATCAGATAAACTTTGCAAG | p.Thr879LeufsTer58 | p.T879Lfs*58 | O43491 | protein_coding | | | TCGA-AR-A0U0-01 | Breast | breast invasive carcinoma | Female | >=65 | I/II | Unknown | Unknown | SD |
| EPB41L2 | deletion | Frame_Shift_Del | novel | c.847delN | p.Leu283Ter | p.L283* | O43491 | protein_coding | | | TCGA-EW-A2FV-01 | Breast | breast invasive carcinoma | Female | <65 | III/IV | Chemotherapy | docetaxel | SD |


