| Tissue | Expression Dynamics | Abbreviation |
| Cervix | 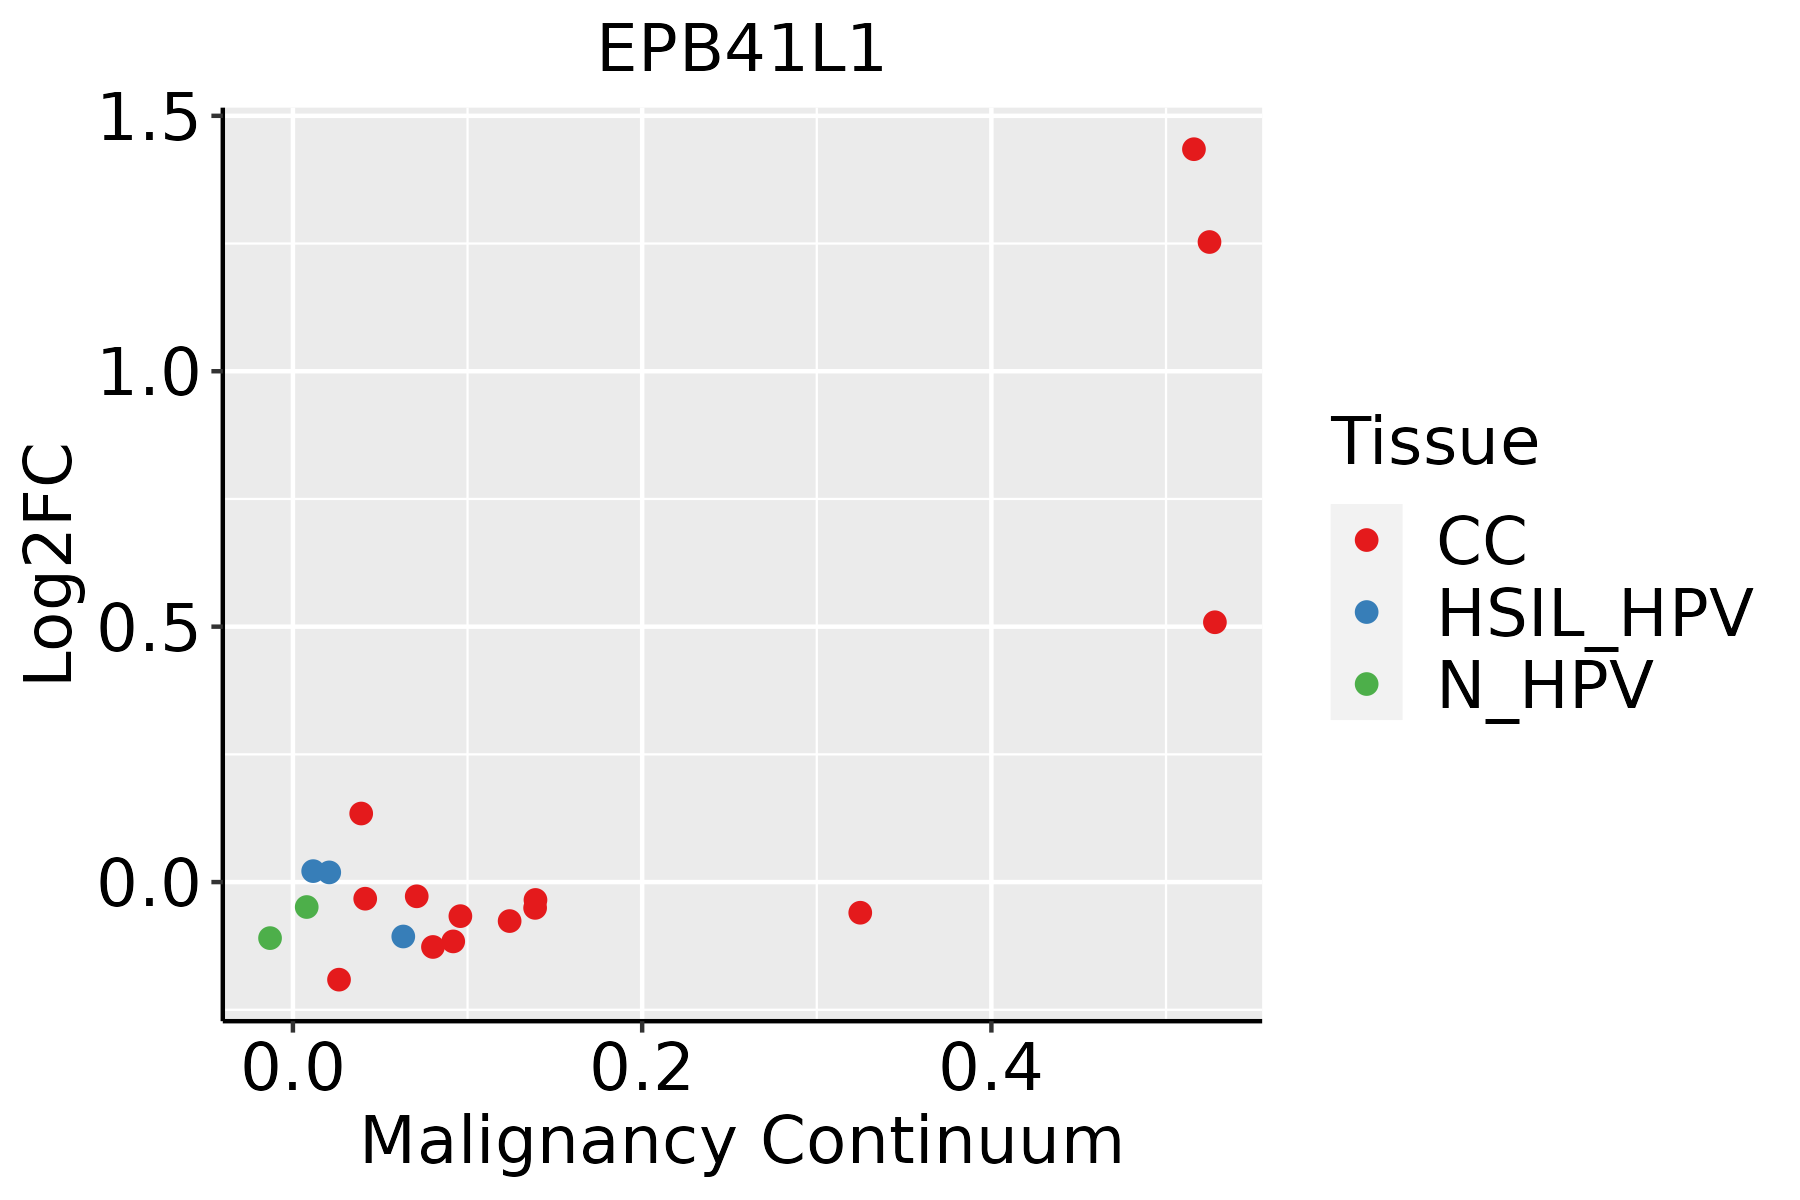 | CC: Cervix cancer |
| HSIL_HPV: HPV-infected high-grade squamous intraepithelial lesions |
| N_HPV: HPV-infected normal cervix |
| Colorectum (GSE201348) |  | FAP: Familial adenomatous polyposis |
| CRC: Colorectal cancer |
| Colorectum (HTA11) |  | AD: Adenomas |
| SER: Sessile serrated lesions |
| MSI-H: Microsatellite-high colorectal cancer |
| MSS: Microsatellite stable colorectal cancer |
| Esophagus |  | ESCC: Esophageal squamous cell carcinoma |
| HGIN: High-grade intraepithelial neoplasias |
| LGIN: Low-grade intraepithelial neoplasias |
| Liver | 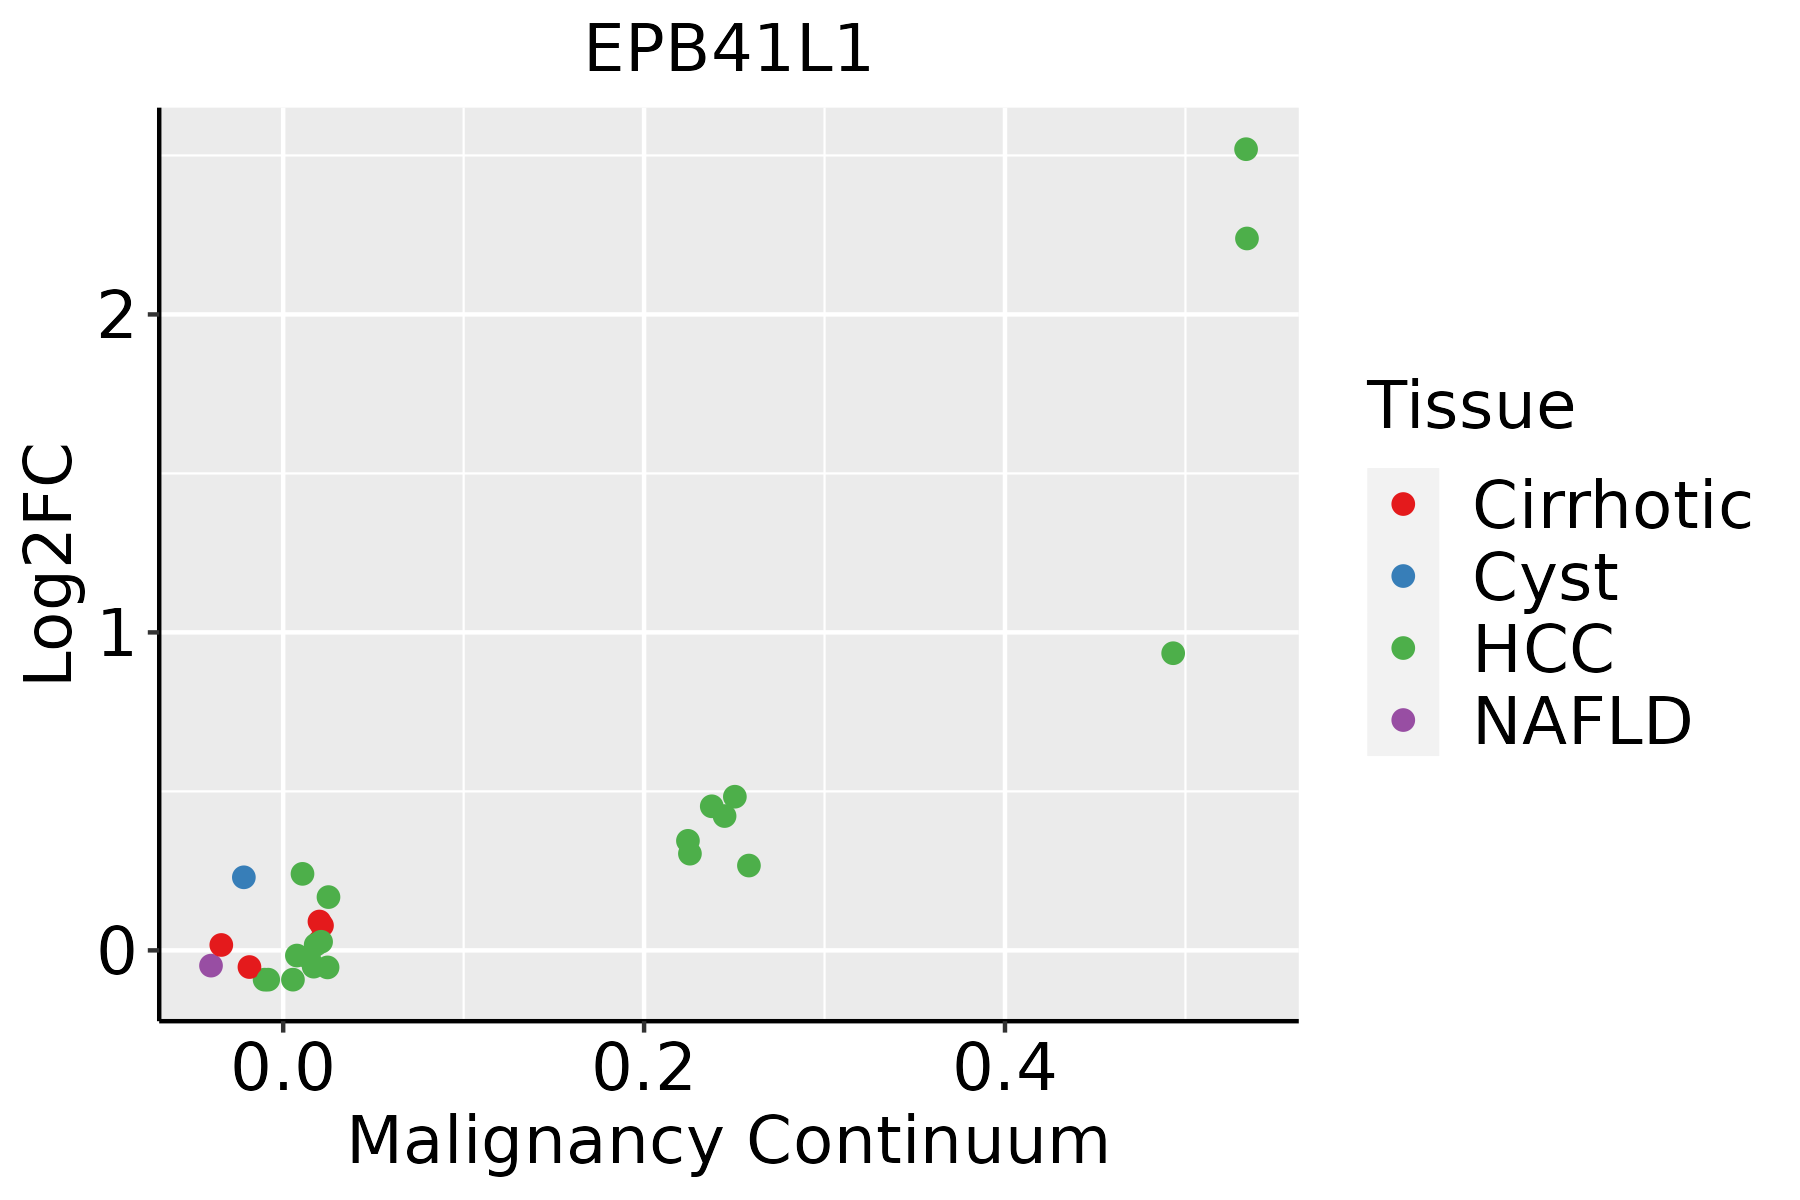 | HCC: Hepatocellular carcinoma |
| NAFLD: Non-alcoholic fatty liver disease |
| GO ID | Tissue | Disease Stage | Description | Gene Ratio | Bg Ratio | pvalue | p.adjust | Count |
| GO:00308657 | Cervix | CC | cortical cytoskeleton organization | 19/2311 | 61/18723 | 8.72e-05 | 1.16e-03 | 19 |
| GO:00310329 | Cervix | CC | actomyosin structure organization | 43/2311 | 196/18723 | 1.11e-04 | 1.40e-03 | 43 |
| GO:00308667 | Cervix | CC | cortical actin cytoskeleton organization | 12/2311 | 40/18723 | 2.44e-03 | 1.71e-02 | 12 |
| GO:0031032 | Colorectum | AD | actomyosin structure organization | 65/3918 | 196/18723 | 4.17e-05 | 7.37e-04 | 65 |
| GO:0030866 | Colorectum | AD | cortical actin cytoskeleton organization | 19/3918 | 40/18723 | 1.58e-04 | 2.20e-03 | 19 |
| GO:0030865 | Colorectum | AD | cortical cytoskeleton organization | 25/3918 | 61/18723 | 2.96e-04 | 3.60e-03 | 25 |
| GO:00308651 | Colorectum | SER | cortical cytoskeleton organization | 19/2897 | 61/18723 | 1.59e-03 | 1.69e-02 | 19 |
| GO:00308661 | Colorectum | SER | cortical actin cytoskeleton organization | 14/2897 | 40/18723 | 1.88e-03 | 1.90e-02 | 14 |
| GO:00310321 | Colorectum | SER | actomyosin structure organization | 45/2897 | 196/18723 | 3.60e-03 | 3.03e-02 | 45 |
| GO:00308652 | Colorectum | MSS | cortical cytoskeleton organization | 24/3467 | 61/18723 | 1.16e-04 | 1.81e-03 | 24 |
| GO:00308662 | Colorectum | MSS | cortical actin cytoskeleton organization | 17/3467 | 40/18723 | 3.87e-04 | 4.86e-03 | 17 |
| GO:00310322 | Colorectum | MSS | actomyosin structure organization | 53/3467 | 196/18723 | 2.04e-03 | 1.75e-02 | 53 |
| GO:00310323 | Colorectum | FAP | actomyosin structure organization | 51/2622 | 196/18723 | 5.89e-06 | 1.88e-04 | 51 |
| GO:00308663 | Colorectum | FAP | cortical actin cytoskeleton organization | 14/2622 | 40/18723 | 6.94e-04 | 7.50e-03 | 14 |
| GO:00308653 | Colorectum | FAP | cortical cytoskeleton organization | 18/2622 | 61/18723 | 1.30e-03 | 1.20e-02 | 18 |
| GO:00310324 | Colorectum | CRC | actomyosin structure organization | 45/2078 | 196/18723 | 1.49e-06 | 8.14e-05 | 45 |
| GO:00308664 | Colorectum | CRC | cortical actin cytoskeleton organization | 14/2078 | 40/18723 | 5.81e-05 | 1.31e-03 | 14 |
| GO:00308654 | Colorectum | CRC | cortical cytoskeleton organization | 18/2078 | 61/18723 | 7.27e-05 | 1.53e-03 | 18 |
| GO:003086517 | Esophagus | ESCC | cortical cytoskeleton organization | 44/8552 | 61/18723 | 2.50e-05 | 2.13e-04 | 44 |
| GO:003086610 | Esophagus | ESCC | cortical actin cytoskeleton organization | 28/8552 | 40/18723 | 1.61e-03 | 7.50e-03 | 28 |
| Hugo Symbol | Variant Class | Variant Classification | dbSNP RS | HGVSc | HGVSp | HGVSp Short | SWISSPROT | BIOTYPE | SIFT | PolyPhen | Tumor Sample Barcode | Tissue | Histology | Sex | Age | Stage | Therapy Types | Drugs | Outcome |
| EPB41L1 | SNV | Missense_Mutation | novel | c.2459N>G | p.Ser820Cys | p.S820C | Q9H4G0 | protein_coding | deleterious(0) | probably_damaging(0.999) | TCGA-3C-AALK-01 | Breast | breast invasive carcinoma | Female | <65 | I/II | Chemotherapy | docetaxel | SD |
| EPB41L1 | SNV | Missense_Mutation | | c.334N>A | p.Glu112Lys | p.E112K | Q9H4G0 | protein_coding | deleterious(0.01) | possibly_damaging(0.882) | TCGA-A2-A0EQ-01 | Breast | breast invasive carcinoma | Female | <65 | I/II | Chemotherapy | adriamycin | SD |
| EPB41L1 | SNV | Missense_Mutation | novel | c.1119C>G | p.Phe373Leu | p.F373L | Q9H4G0 | protein_coding | deleterious(0) | probably_damaging(0.996) | TCGA-A2-A0EY-01 | Breast | breast invasive carcinoma | Female | <65 | I/II | Chemotherapy | adriamycin | SD |
| EPB41L1 | SNV | Missense_Mutation | rs145893462 | c.112G>A | p.Gly38Ser | p.G38S | Q9H4G0 | protein_coding | tolerated_low_confidence(0.89) | benign(0.003) | TCGA-BH-A0DD-01 | Breast | breast invasive carcinoma | Male | <65 | I/II | Chemotherapy | docetaxel | CR |
| EPB41L1 | SNV | Missense_Mutation | rs766032605 | c.1312N>T | p.Arg438Cys | p.R438C | Q9H4G0 | protein_coding | deleterious(0.02) | possibly_damaging(0.899) | TCGA-BH-A0HF-01 | Breast | breast invasive carcinoma | Female | >=65 | I/II | Hormone Therapy | arimidex | SD |
| EPB41L1 | SNV | Missense_Mutation | | c.263N>G | p.Gln88Arg | p.Q88R | Q9H4G0 | protein_coding | deleterious(0.05) | probably_damaging(0.985) | TCGA-BH-A18G-01 | Breast | breast invasive carcinoma | Female | >=65 | I/II | Unknown | Unknown | SD |
| EPB41L1 | insertion | Frame_Shift_Ins | novel | c.1117_1118insACCC | p.Phe373TyrfsTer9 | p.F373Yfs*9 | Q9H4G0 | protein_coding | | | TCGA-A2-A0EY-01 | Breast | breast invasive carcinoma | Female | <65 | I/II | Chemotherapy | adriamycin | SD |
| EPB41L1 | insertion | Frame_Shift_Ins | novel | c.1435_1436insAAGTATCTCCCCCTCTCGCTTC | p.Ile479LysfsTer42 | p.I479Kfs*42 | Q9H4G0 | protein_coding | | | TCGA-A8-A097-01 | Breast | breast invasive carcinoma | Female | >=65 | I/II | Hormone Therapy | tamoxiphen | SD |
| EPB41L1 | insertion | Nonsense_Mutation | novel | c.462_463insCAGATGAGAATTTAGAGAGCCCTGGTCTGGCTGCTAGAG | p.Pro154_Ser155insGlnMetArgIleTerArgAlaLeuValTrpLeuLeuGlu | p.P154_S155insQMRI*RALVWLLE | Q9H4G0 | protein_coding | | | TCGA-BH-A0EE-01 | Breast | breast invasive carcinoma | Female | >=65 | I/II | Chemotherapy | docetaxel | SD |
| EPB41L1 | SNV | Missense_Mutation | rs761484860 | c.2167N>A | p.Ala723Thr | p.A723T | Q9H4G0 | protein_coding | tolerated(1) | benign(0) | TCGA-2W-A8YY-01 | Cervix | cervical & endocervical cancer | Female | <65 | I/II | Chemotherapy | cisplatin | CR |


