
|
|||||
|
 | |
| |
| |
| |
| |
| |
|
Gene: EP400 |
Gene summary for EP400 |
| Gene information | Species | Human | Gene symbol | EP400 | Gene ID | 57634 |
| Gene name | E1A binding protein p400 | |
| Gene Alias | CAGH32 | |
| Cytomap | 12q24.33 | |
| Gene Type | protein-coding | GO ID | GO:0006464 | UniProtAcc | Q96L91 |
Top |
Malignant transformation analysis |
| Identification of the aberrant gene expression in precancerous and cancerous lesions by comparing the gene expression of stem-like cells in diseased tissues with normal stem cells |
| Entrez ID | Symbol | Replicates | Species | Organ | Tissue | Adj P-value | Log2FC | Malignancy |
| 57634 | EP400 | LZE4T | Human | Esophagus | ESCC | 1.73e-10 | 2.20e-01 | 0.0811 |
| 57634 | EP400 | LZE7T | Human | Esophagus | ESCC | 6.05e-14 | 6.31e-01 | 0.0667 |
| 57634 | EP400 | LZE20T | Human | Esophagus | ESCC | 8.42e-09 | 1.56e-01 | 0.0662 |
| 57634 | EP400 | LZE24T | Human | Esophagus | ESCC | 4.95e-18 | 3.68e-01 | 0.0596 |
| 57634 | EP400 | LZE21T | Human | Esophagus | ESCC | 4.46e-09 | 3.24e-01 | 0.0655 |
| 57634 | EP400 | P1T-E | Human | Esophagus | ESCC | 2.28e-14 | 4.22e-01 | 0.0875 |
| 57634 | EP400 | P2T-E | Human | Esophagus | ESCC | 1.38e-47 | 8.30e-01 | 0.1177 |
| 57634 | EP400 | P4T-E | Human | Esophagus | ESCC | 7.30e-19 | 2.81e-01 | 0.1323 |
| 57634 | EP400 | P5T-E | Human | Esophagus | ESCC | 7.78e-14 | 2.20e-01 | 0.1327 |
| 57634 | EP400 | P8T-E | Human | Esophagus | ESCC | 1.18e-21 | 3.74e-01 | 0.0889 |
| 57634 | EP400 | P9T-E | Human | Esophagus | ESCC | 1.30e-15 | 1.80e-01 | 0.1131 |
| 57634 | EP400 | P10T-E | Human | Esophagus | ESCC | 1.66e-20 | 3.09e-01 | 0.116 |
| 57634 | EP400 | P11T-E | Human | Esophagus | ESCC | 1.75e-16 | 6.11e-01 | 0.1426 |
| 57634 | EP400 | P12T-E | Human | Esophagus | ESCC | 1.47e-14 | 2.28e-01 | 0.1122 |
| 57634 | EP400 | P15T-E | Human | Esophagus | ESCC | 2.57e-20 | 3.88e-01 | 0.1149 |
| 57634 | EP400 | P16T-E | Human | Esophagus | ESCC | 1.91e-23 | 3.72e-01 | 0.1153 |
| 57634 | EP400 | P17T-E | Human | Esophagus | ESCC | 1.52e-10 | 2.28e-01 | 0.1278 |
| 57634 | EP400 | P20T-E | Human | Esophagus | ESCC | 1.80e-23 | 4.72e-01 | 0.1124 |
| 57634 | EP400 | P21T-E | Human | Esophagus | ESCC | 1.99e-21 | 3.80e-01 | 0.1617 |
| 57634 | EP400 | P22T-E | Human | Esophagus | ESCC | 8.98e-12 | 2.46e-01 | 0.1236 |
| Page: 1 2 3 4 5 |
| Tissue | Expression Dynamics | Abbreviation |
| Esophagus | 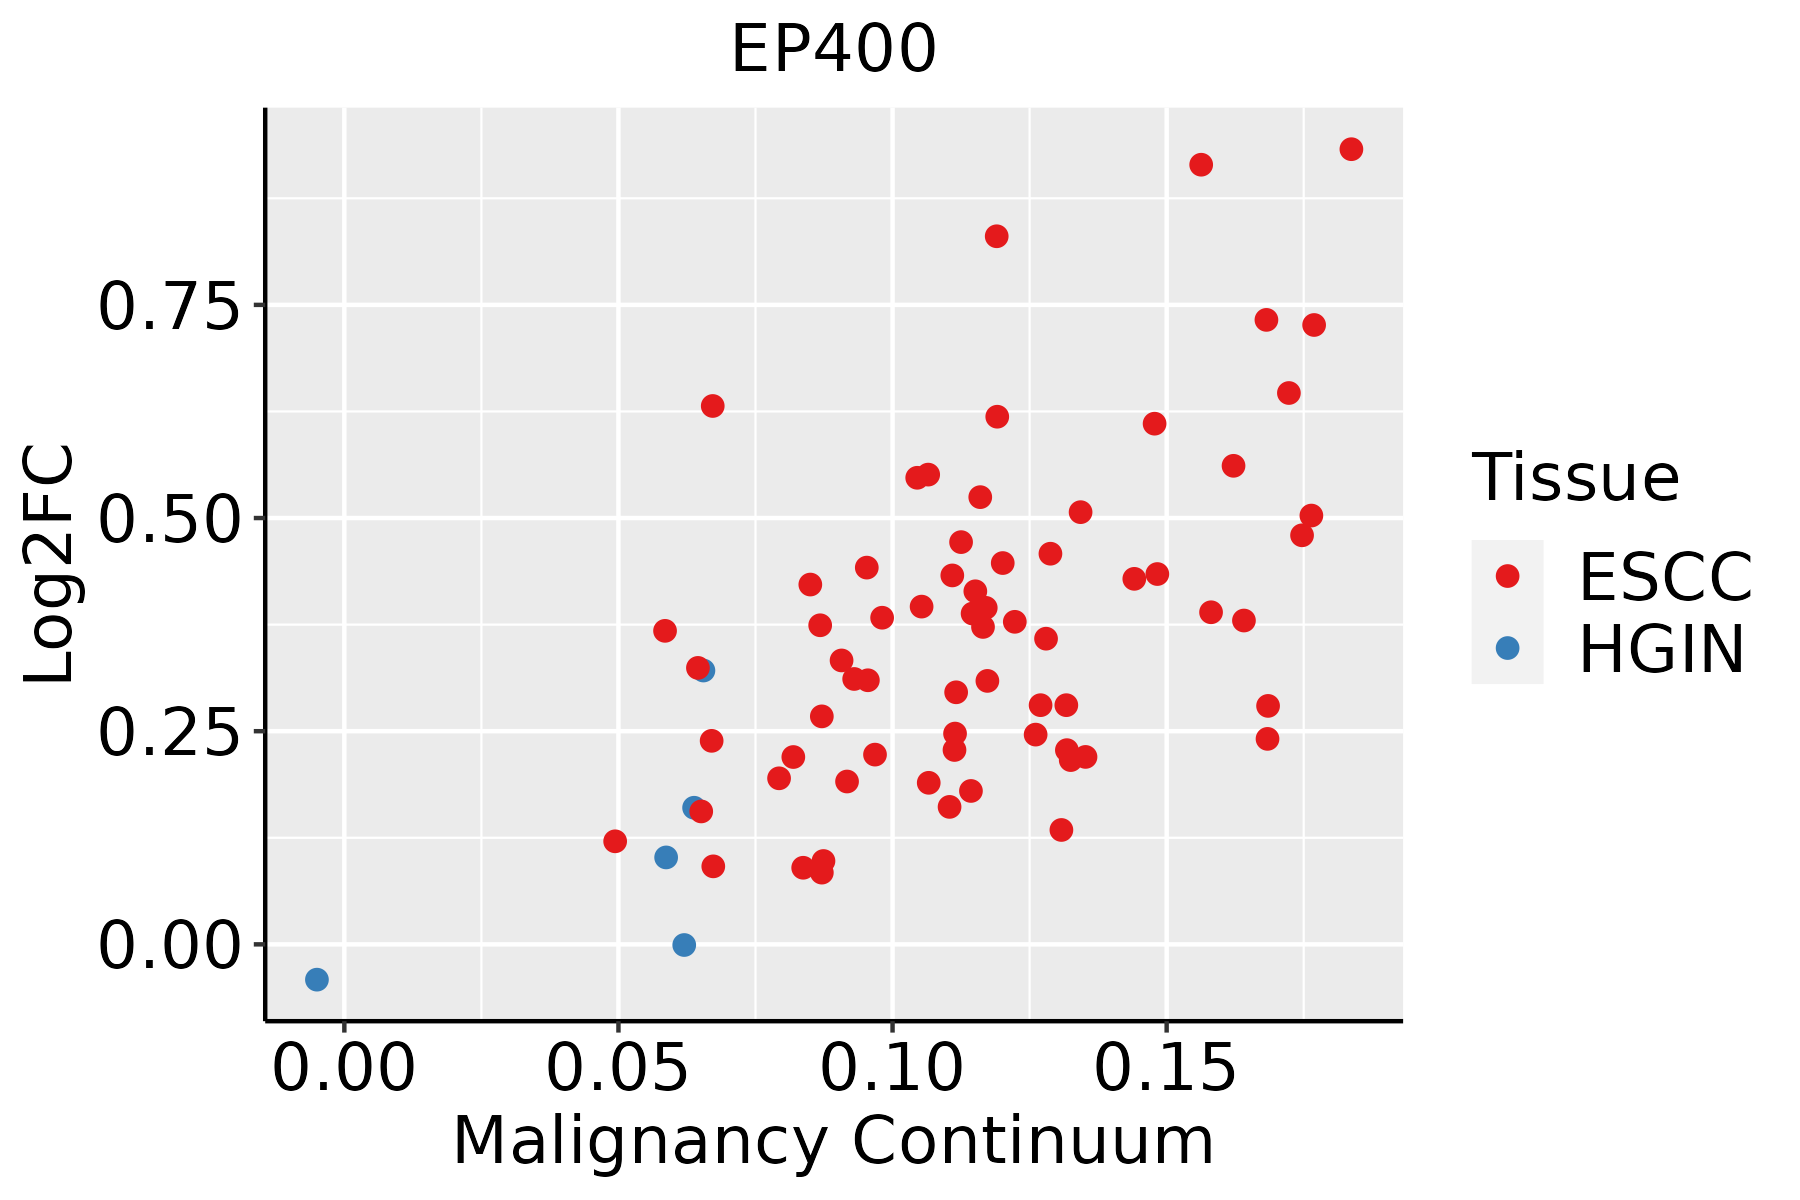 | ESCC: Esophageal squamous cell carcinoma |
| HGIN: High-grade intraepithelial neoplasias | ||
| LGIN: Low-grade intraepithelial neoplasias | ||
| Liver | 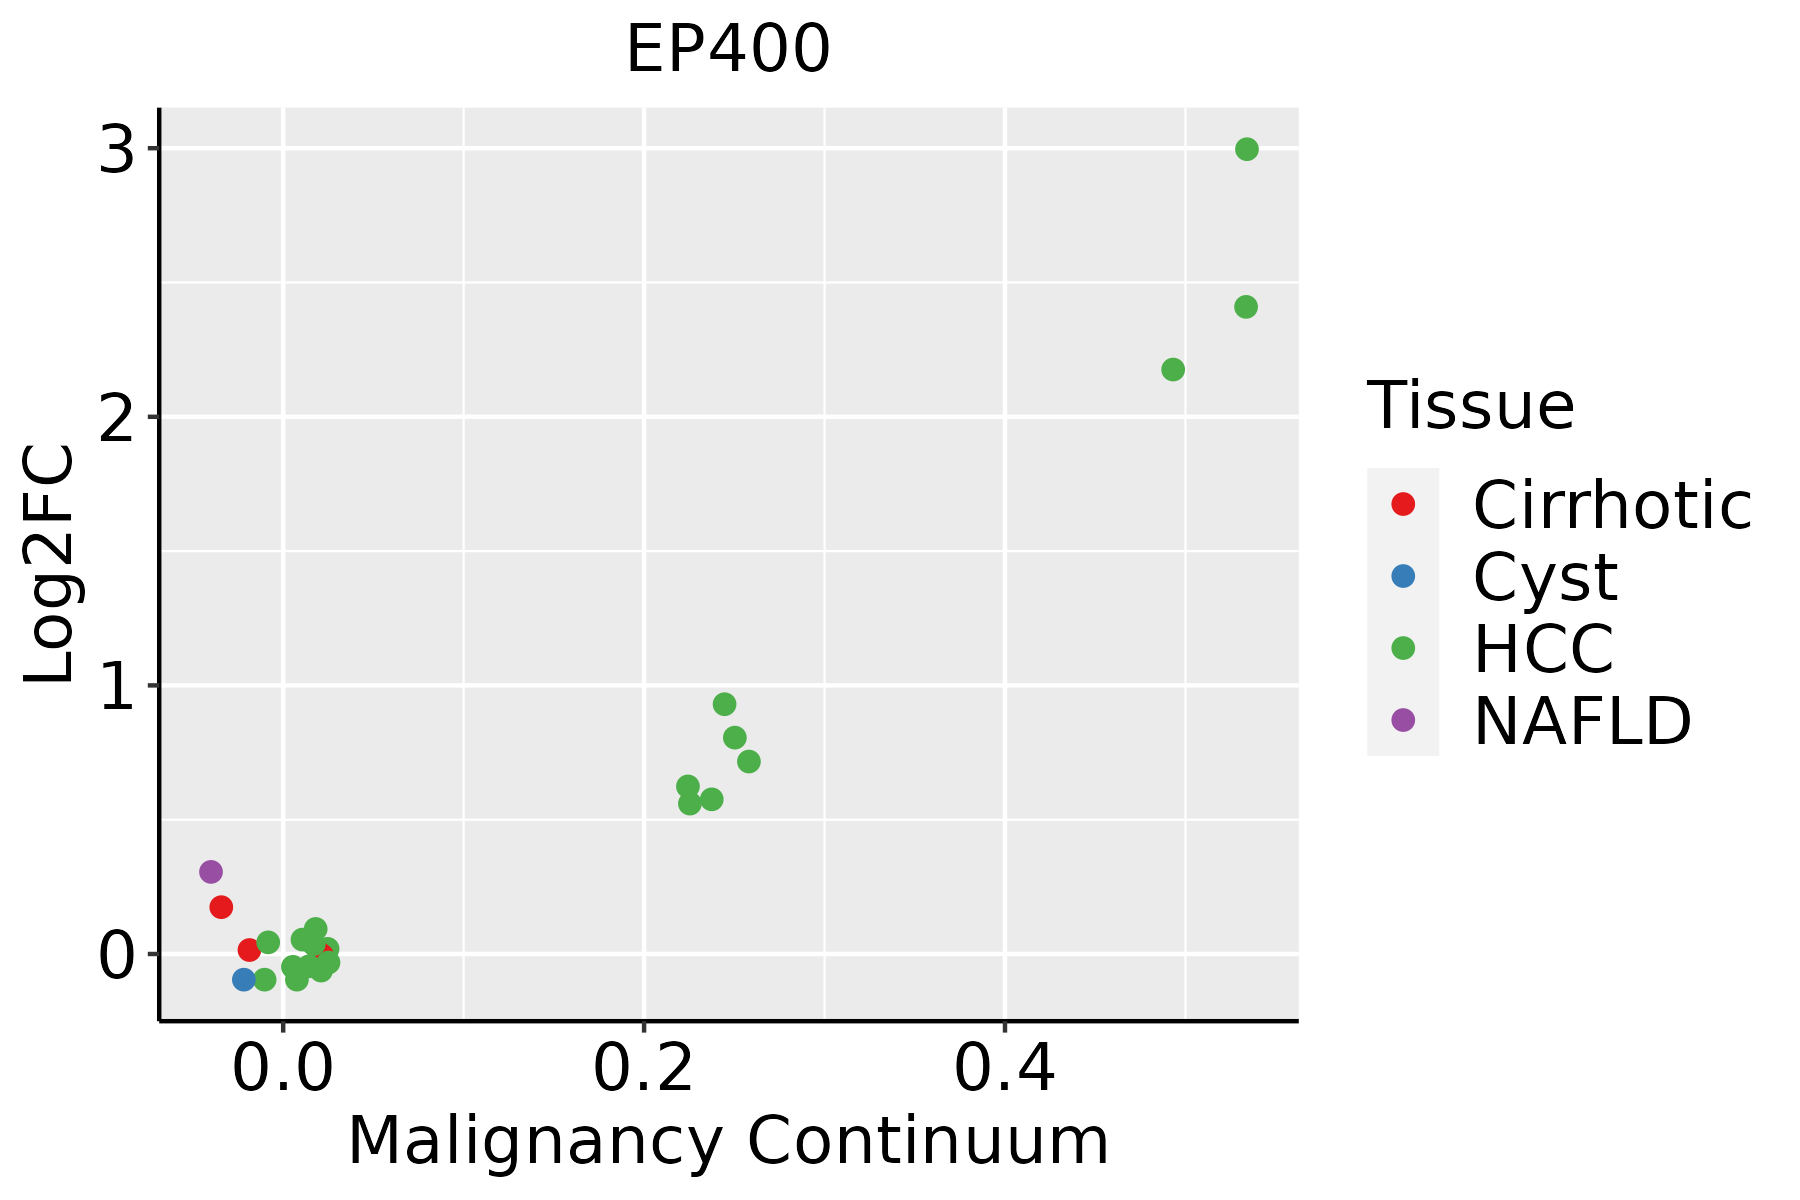 | HCC: Hepatocellular carcinoma |
| NAFLD: Non-alcoholic fatty liver disease | ||
| Oral Cavity | 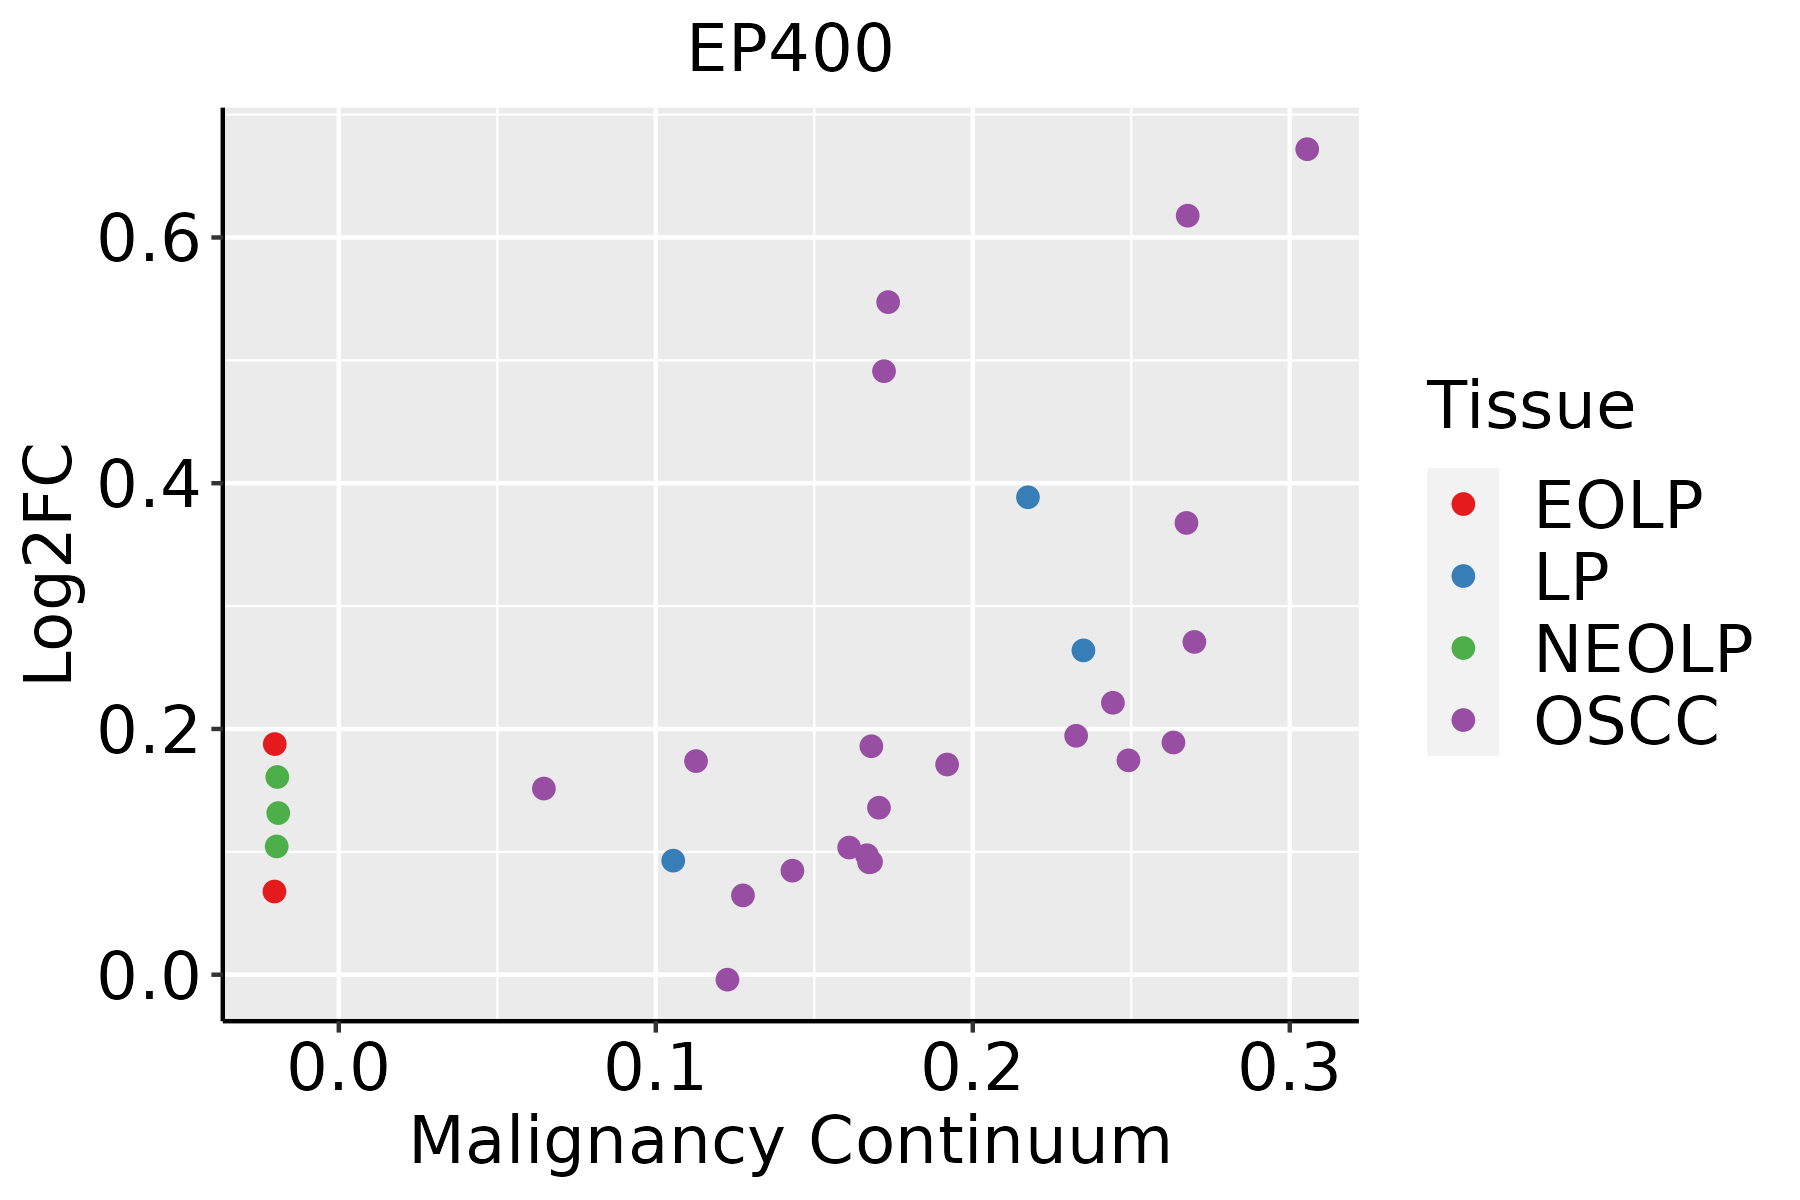 | EOLP: Erosive Oral lichen planus |
| LP: leukoplakia | ||
| NEOLP: Non-erosive oral lichen planus | ||
| OSCC: Oral squamous cell carcinoma | ||
| Thyroid |  | ATC: Anaplastic thyroid cancer |
| HT: Hashimoto's thyroiditis | ||
| PTC: Papillary thyroid cancer |
| ∗log2FC in expression of this searched gene in stem-like cells from each diseased tissue sample relative to stem-like cells in normal samples in each tissue plotted against the malignancy continuum. Samples are colored based on if they are from different disease stage. |
Top |
Malignant transformation related pathway analysis |
| Find out the enriched GO biological processes and KEGG pathways involved in transition from healthy to precancer to cancer |
| Tissue | Disease Stage | Enriched GO biological Processes |
| Colorectum | AD |  |
| Colorectum | SER |  |
| Colorectum | MSS |  |
| Colorectum | MSI-H |  |
| Colorectum | FAP |  |
| ∗Top 15 enriched GO BP terms are showed in the bar plot of each disease state in each tissue. Each row represents a significant GO biological process which is colored according to the -log10(p.adjust). |
| Page: 1 2 3 4 5 6 7 8 9 |
| GO ID | Tissue | Disease Stage | Description | Gene Ratio | Bg Ratio | pvalue | p.adjust | Count |
| GO:001657015 | Esophagus | ESCC | histone modification | 323/8552 | 463/18723 | 2.61e-26 | 7.88e-24 | 323 |
| GO:001820514 | Esophagus | ESCC | peptidyl-lysine modification | 259/8552 | 376/18723 | 3.90e-20 | 5.26e-18 | 259 |
| GO:001839413 | Esophagus | ESCC | peptidyl-lysine acetylation | 123/8552 | 169/18723 | 6.58e-13 | 2.94e-11 | 123 |
| GO:004354313 | Esophagus | ESCC | protein acylation | 165/8552 | 243/18723 | 1.69e-12 | 7.14e-11 | 165 |
| GO:000647313 | Esophagus | ESCC | protein acetylation | 140/8552 | 201/18723 | 4.37e-12 | 1.69e-10 | 140 |
| GO:001839313 | Esophagus | ESCC | internal peptidyl-lysine acetylation | 114/8552 | 158/18723 | 1.16e-11 | 4.24e-10 | 114 |
| GO:000647513 | Esophagus | ESCC | internal protein amino acid acetylation | 115/8552 | 160/18723 | 1.43e-11 | 5.08e-10 | 115 |
| GO:00165735 | Esophagus | ESCC | histone acetylation | 110/8552 | 152/18723 | 1.95e-11 | 6.81e-10 | 110 |
| GO:004396712 | Esophagus | ESCC | histone H4 acetylation | 53/8552 | 67/18723 | 2.11e-08 | 4.03e-07 | 53 |
| GO:00439682 | Esophagus | ESCC | histone H2A acetylation | 15/8552 | 17/18723 | 3.48e-04 | 2.03e-03 | 15 |
| GO:001657021 | Liver | HCC | histone modification | 283/7958 | 463/18723 | 2.68e-16 | 2.33e-14 | 283 |
| GO:00182052 | Liver | HCC | peptidyl-lysine modification | 230/7958 | 376/18723 | 1.51e-13 | 8.32e-12 | 230 |
| GO:00064732 | Liver | HCC | protein acetylation | 135/7958 | 201/18723 | 1.20e-12 | 5.92e-11 | 135 |
| GO:00435432 | Liver | HCC | protein acylation | 157/7958 | 243/18723 | 2.40e-12 | 1.12e-10 | 157 |
| GO:00183942 | Liver | HCC | peptidyl-lysine acetylation | 116/7958 | 169/18723 | 5.11e-12 | 2.23e-10 | 116 |
| GO:00064752 | Liver | HCC | internal protein amino acid acetylation | 107/7958 | 160/18723 | 3.77e-10 | 1.23e-08 | 107 |
| GO:00183932 | Liver | HCC | internal peptidyl-lysine acetylation | 105/7958 | 158/18723 | 9.48e-10 | 2.90e-08 | 105 |
| GO:00165732 | Liver | HCC | histone acetylation | 101/7958 | 152/18723 | 1.99e-09 | 5.63e-08 | 101 |
| GO:00439671 | Liver | HCC | histone H4 acetylation | 50/7958 | 67/18723 | 9.14e-08 | 1.82e-06 | 50 |
| GO:00439681 | Liver | HCC | histone H2A acetylation | 14/7958 | 17/18723 | 9.39e-04 | 5.47e-03 | 14 |
| Page: 1 2 3 |
| Pathway ID | Tissue | Disease Stage | Description | Gene Ratio | Bg Ratio | pvalue | p.adjust | qvalue | Count |
| Page: 1 |
Top |
Cell-cell communication analysis |
| Identification of potential cell-cell interactions between two cell types and their ligand-receptor pairs for different disease states |
| Ligand | Receptor | LRpair | Pathway | Tissue | Disease Stage |
| Page: 1 |
Top |
Single-cell gene regulatory network inference analysis |
| Find out the significant the regulons (TFs) and the target genes of each regulon across cell types for different disease states |
| TF | Cell Type | Tissue | Disease Stage | Target Gene | RSS | Regulon Activity |
| ∗The dot plots of a searched regulon are shown for all cell subpopulations in each disease state of each tissue based on the regulon specific score inferred using pySCENIC and by calculating the average expression. |
| Page: 1 |
Top |
Somatic mutation of malignant transformation related genes |
| Annotation of somatic variants for genes involved in malignant transformation |
| Hugo Symbol | Variant Class | Variant Classification | dbSNP RS | HGVSc | HGVSp | HGVSp Short | SWISSPROT | BIOTYPE | SIFT | PolyPhen | Tumor Sample Barcode | Tissue | Histology | Sex | Age | Stage | Therapy Types | Drugs | Outcome |
| EP400 | SNV | Missense_Mutation | c.5956G>C | p.Val1986Leu | p.V1986L | Q96L91 | protein_coding | deleterious(0.02) | possibly_damaging(0.826) | TCGA-A8-A09X-01 | Breast | breast invasive carcinoma | Female | <65 | III/IV | Unknown | Unknown | SD | |
| EP400 | SNV | Missense_Mutation | c.1772A>G | p.Gln591Arg | p.Q591R | Q96L91 | protein_coding | deleterious_low_confidence(0.05) | benign(0.3) | TCGA-AR-A24X-01 | Breast | breast invasive carcinoma | Female | <65 | I/II | Hormone Therapy | tamoxiphen | SD | |
| EP400 | SNV | Missense_Mutation | c.3646N>T | p.His1216Tyr | p.H1216Y | Q96L91 | protein_coding | deleterious(0) | possibly_damaging(0.791) | TCGA-B6-A0RO-01 | Breast | breast invasive carcinoma | Female | >=65 | III/IV | Unknown | Unknown | SD | |
| EP400 | SNV | Missense_Mutation | c.1907C>G | p.Ser636Cys | p.S636C | Q96L91 | protein_coding | deleterious_low_confidence(0.05) | benign(0.003) | TCGA-BH-A0B5-01 | Breast | breast invasive carcinoma | Female | <65 | III/IV | Chemotherapy | adriamycin | CR | |
| EP400 | SNV | Missense_Mutation | c.5629N>A | p.Glu1877Lys | p.E1877K | Q96L91 | protein_coding | tolerated(0.06) | possibly_damaging(0.84) | TCGA-BH-A0HF-01 | Breast | breast invasive carcinoma | Female | >=65 | I/II | Hormone Therapy | arimidex | SD | |
| EP400 | SNV | Missense_Mutation | c.5772C>A | p.Phe1924Leu | p.F1924L | Q96L91 | protein_coding | deleterious(0) | possibly_damaging(0.861) | TCGA-C8-A26Y-01 | Breast | breast invasive carcinoma | Female | >=65 | I/II | Unknown | Unknown | SD | |
| EP400 | SNV | Missense_Mutation | rs761256166 | c.1675G>A | p.Gly559Arg | p.G559R | Q96L91 | protein_coding | deleterious_low_confidence(0) | possibly_damaging(0.64) | TCGA-D8-A13Z-01 | Breast | breast invasive carcinoma | Female | <65 | I/II | Chemotherapy | doxorubicine | SD |
| EP400 | SNV | Missense_Mutation | c.3036N>A | p.Asn1012Lys | p.N1012K | Q96L91 | protein_coding | tolerated(0.13) | benign(0.003) | TCGA-D8-A1J8-01 | Breast | breast invasive carcinoma | Female | >=65 | I/II | Hormone Therapy | nolvadex | SD | |
| EP400 | SNV | Missense_Mutation | rs753667262 | c.7931C>T | p.Pro2644Leu | p.P2644L | Q96L91 | protein_coding | tolerated_low_confidence(0.11) | benign(0.041) | TCGA-D8-A1XQ-01 | Breast | breast invasive carcinoma | Female | >=65 | I/II | Unknown | Unknown | SD |
| EP400 | SNV | Missense_Mutation | rs200268785 | c.2494N>T | p.Arg832Trp | p.R832W | Q96L91 | protein_coding | deleterious(0) | probably_damaging(0.987) | TCGA-D8-A1Y1-01 | Breast | breast invasive carcinoma | Female | >=65 | III/IV | Hormone Therapy | tamoxiphen | PD |
| Page: 1 2 3 4 5 6 7 8 9 10 11 12 13 14 15 16 17 18 19 20 21 22 23 24 25 26 27 28 29 30 31 32 |
Top |
Related drugs of malignant transformation related genes |
| Identification of chemicals and drugs interact with genes involved in malignant transfromation |
| (DGIdb 4.0) |
| Entrez ID | Symbol | Category | Interaction Types | Drug Claim Name | Drug Name | PMIDs |
| Page: 1 |

Copyright 2023-Present -The University of Texas Health Science Center at Houston |