
|
|||||
|
 | |
| |
| |
| |
| |
| |
|
Gene: ENY2 |
Gene summary for ENY2 |
| Gene information | Species | Human | Gene symbol | ENY2 | Gene ID | 56943 |
| Gene name | ENY2 transcription and export complex 2 subunit | |
| Gene Alias | DC6 | |
| Cytomap | 8q23.1 | |
| Gene Type | protein-coding | GO ID | GO:0001678 | UniProtAcc | Q9NPA8 |
Top |
Malignant transformation analysis |
| Identification of the aberrant gene expression in precancerous and cancerous lesions by comparing the gene expression of stem-like cells in diseased tissues with normal stem cells |
| Entrez ID | Symbol | Replicates | Species | Organ | Tissue | Adj P-value | Log2FC | Malignancy |
| 56943 | ENY2 | GSM4909281 | Human | Breast | IDC | 6.05e-86 | 1.01e+00 | 0.21 |
| 56943 | ENY2 | GSM4909282 | Human | Breast | IDC | 2.02e-35 | 7.46e-01 | -0.0288 |
| 56943 | ENY2 | GSM4909285 | Human | Breast | IDC | 1.44e-15 | 4.58e-01 | 0.21 |
| 56943 | ENY2 | GSM4909286 | Human | Breast | IDC | 5.86e-04 | 2.45e-01 | 0.1081 |
| 56943 | ENY2 | GSM4909287 | Human | Breast | IDC | 2.12e-42 | 7.07e-01 | 0.2057 |
| 56943 | ENY2 | GSM4909288 | Human | Breast | IDC | 2.38e-06 | 3.31e-01 | 0.0988 |
| 56943 | ENY2 | GSM4909290 | Human | Breast | IDC | 2.86e-12 | 4.80e-01 | 0.2096 |
| 56943 | ENY2 | GSM4909291 | Human | Breast | IDC | 2.82e-05 | 3.67e-01 | 0.1753 |
| 56943 | ENY2 | GSM4909292 | Human | Breast | IDC | 4.99e-05 | 5.59e-01 | 0.1236 |
| 56943 | ENY2 | GSM4909293 | Human | Breast | IDC | 5.01e-03 | 2.58e-01 | 0.1581 |
| 56943 | ENY2 | GSM4909294 | Human | Breast | IDC | 5.33e-17 | 3.56e-01 | 0.2022 |
| 56943 | ENY2 | GSM4909295 | Human | Breast | IDC | 7.77e-03 | 3.47e-01 | 0.0898 |
| 56943 | ENY2 | GSM4909296 | Human | Breast | IDC | 1.21e-16 | 1.77e-01 | 0.1524 |
| 56943 | ENY2 | GSM4909297 | Human | Breast | IDC | 2.51e-22 | -2.58e-02 | 0.1517 |
| 56943 | ENY2 | GSM4909301 | Human | Breast | IDC | 8.09e-08 | 3.06e-01 | 0.1577 |
| 56943 | ENY2 | GSM4909304 | Human | Breast | IDC | 4.42e-07 | 3.69e-01 | 0.1636 |
| 56943 | ENY2 | GSM4909306 | Human | Breast | IDC | 5.15e-14 | 5.05e-01 | 0.1564 |
| 56943 | ENY2 | GSM4909307 | Human | Breast | IDC | 6.62e-04 | 2.57e-01 | 0.1569 |
| 56943 | ENY2 | GSM4909308 | Human | Breast | IDC | 1.15e-13 | 4.14e-01 | 0.158 |
| 56943 | ENY2 | GSM4909309 | Human | Breast | IDC | 3.12e-05 | 2.32e-01 | 0.0483 |
| Page: 1 2 3 4 5 6 7 8 9 10 11 12 |
| Tissue | Expression Dynamics | Abbreviation |
| Breast | 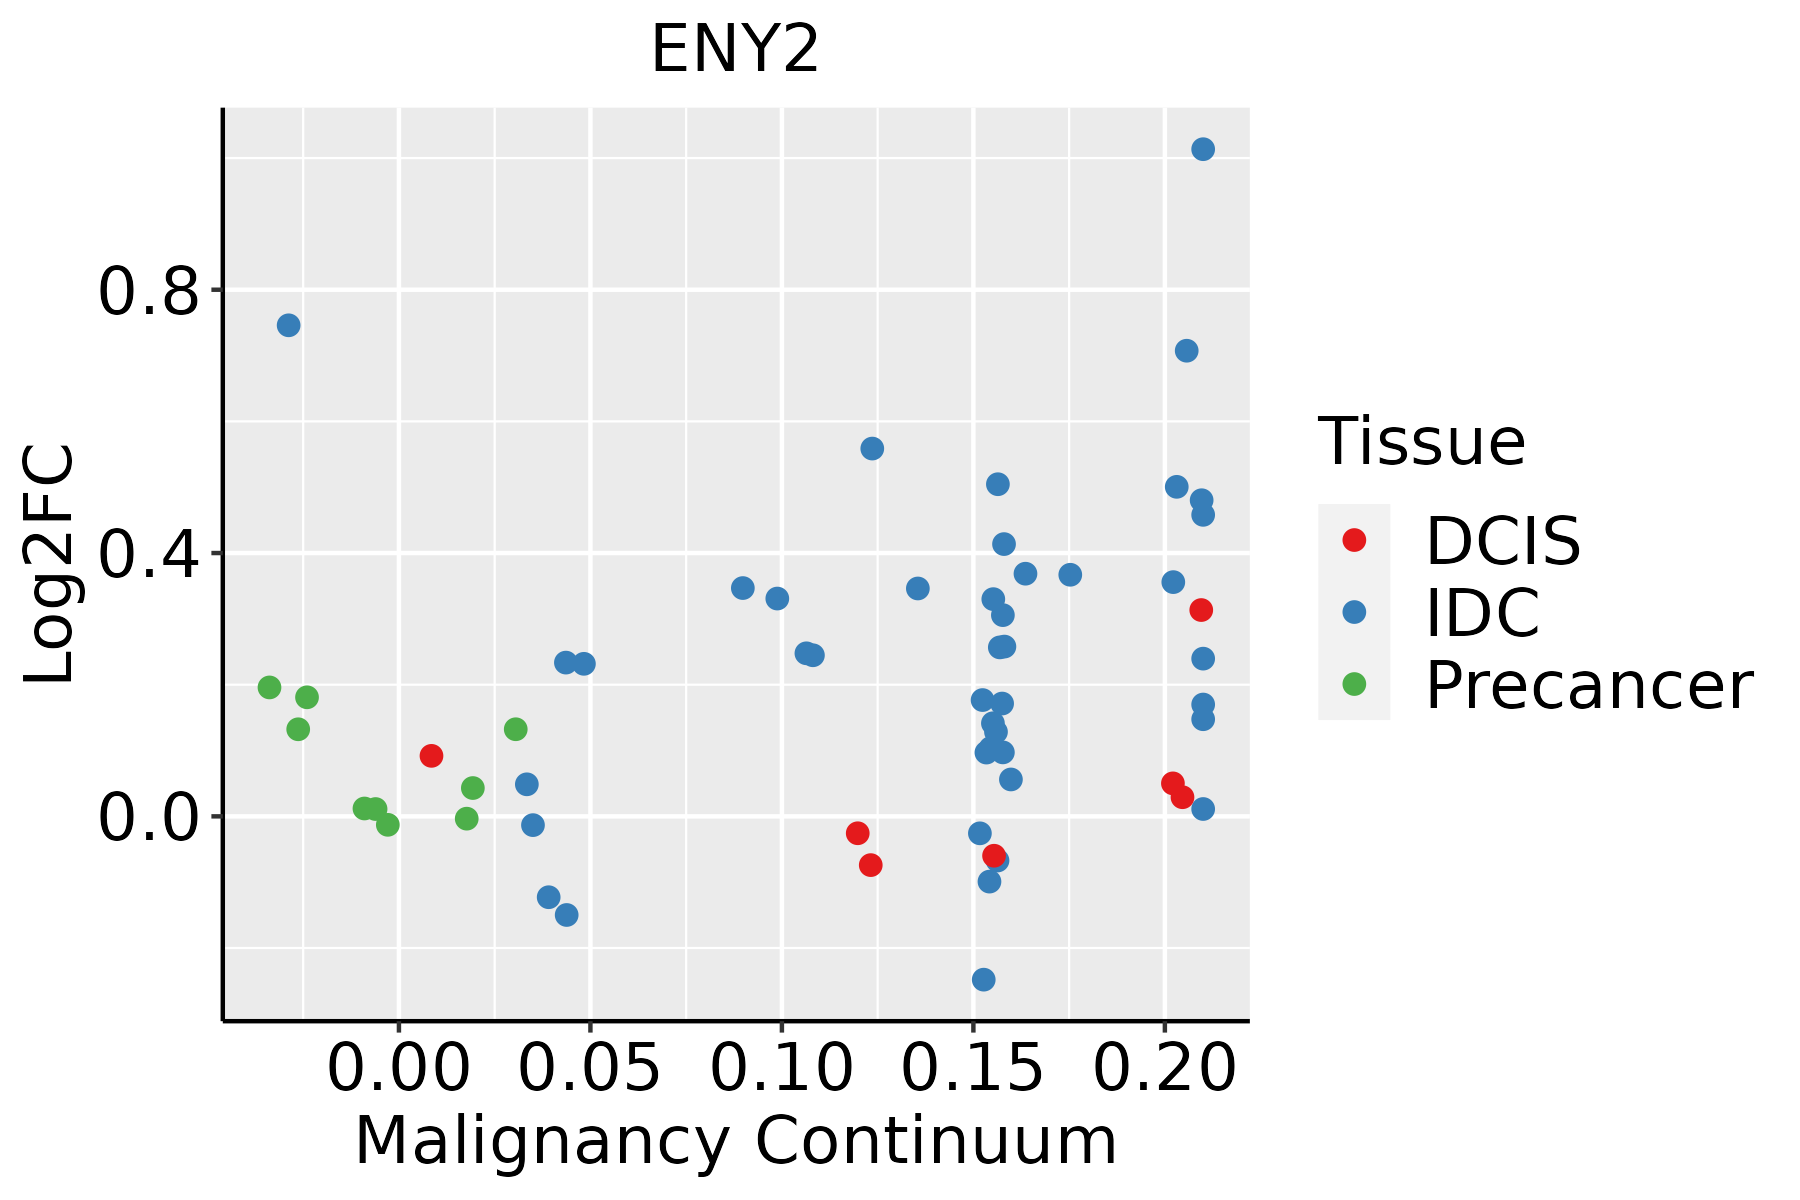 | IDC: Invasive ductal carcinoma |
| DCIS: Ductal carcinoma in situ | ||
| Precancer(BRCA1-mut): Precancerous lesion from BRCA1 mutation carriers | ||
| Cervix | 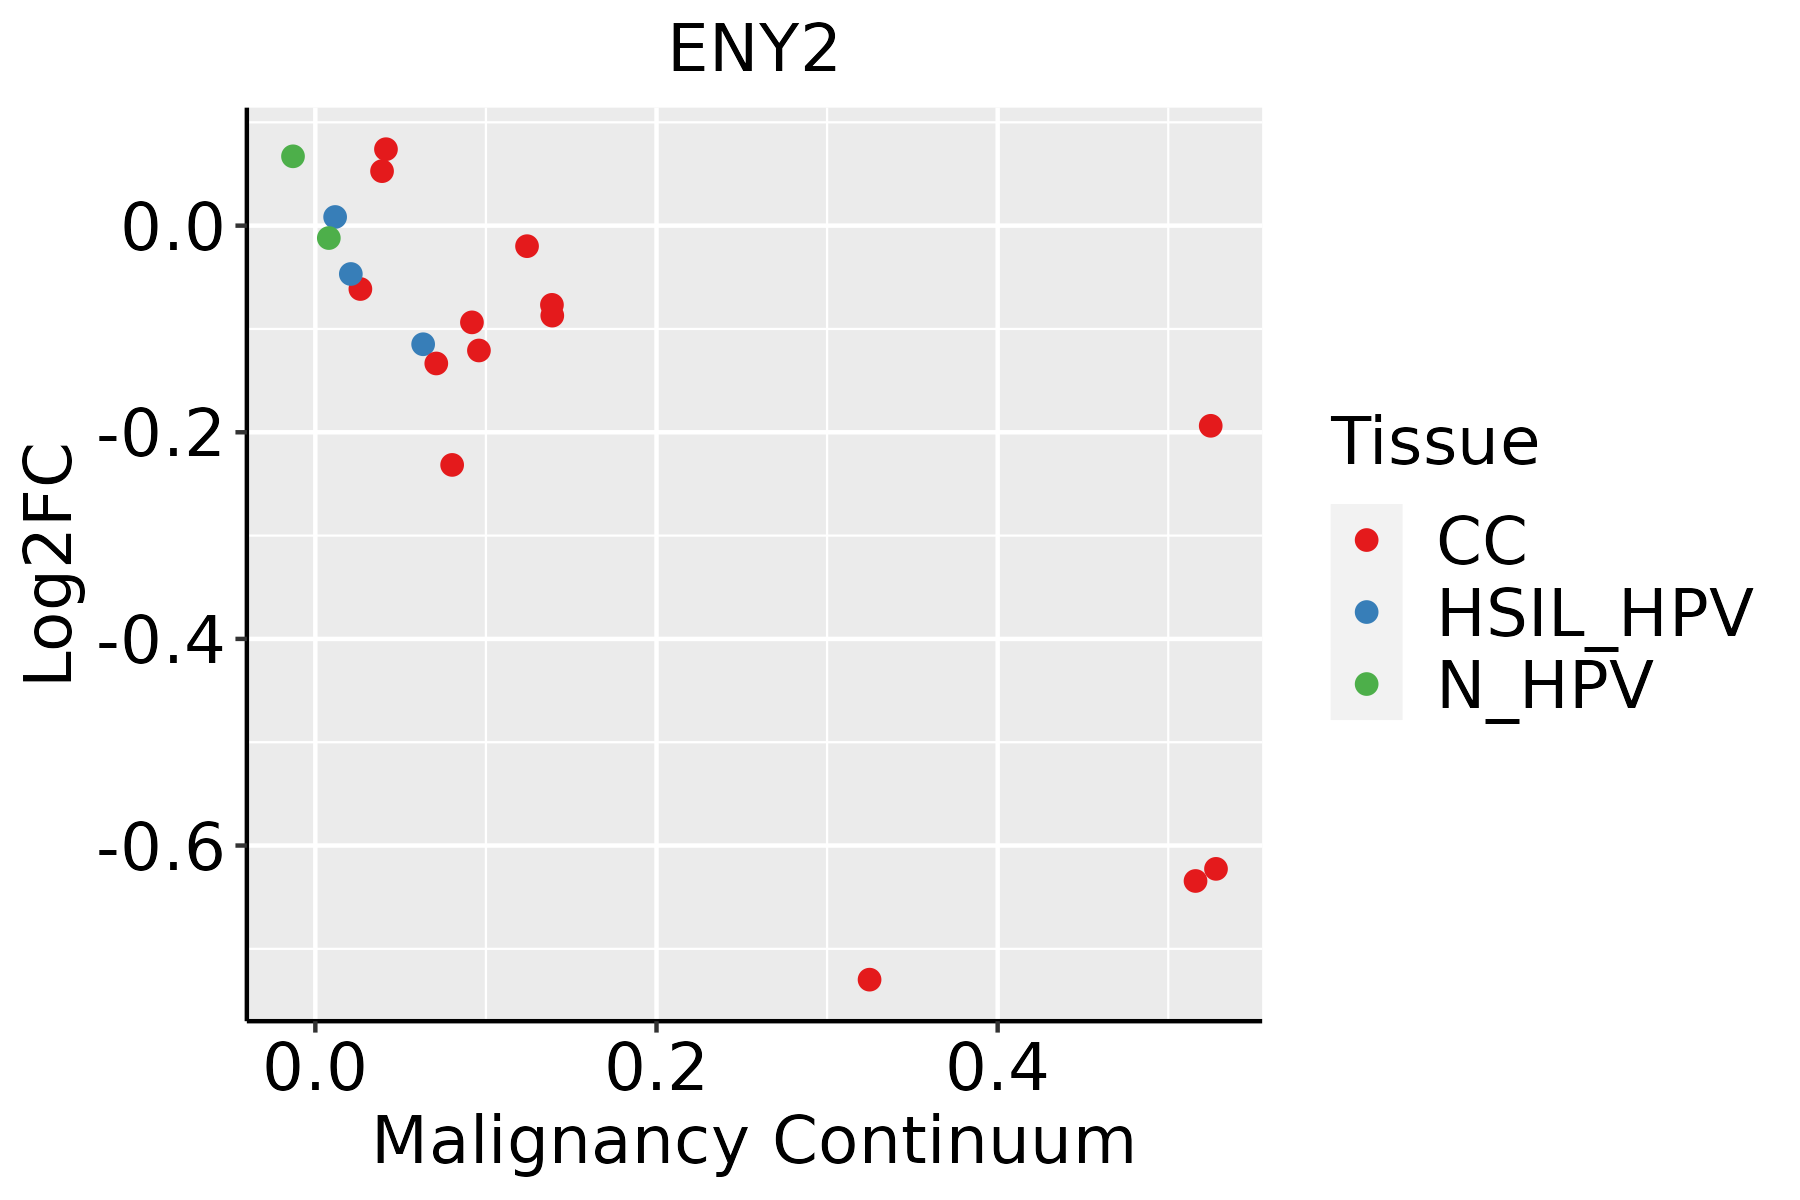 | CC: Cervix cancer |
| HSIL_HPV: HPV-infected high-grade squamous intraepithelial lesions | ||
| N_HPV: HPV-infected normal cervix | ||
| Colorectum (GSE201348) | 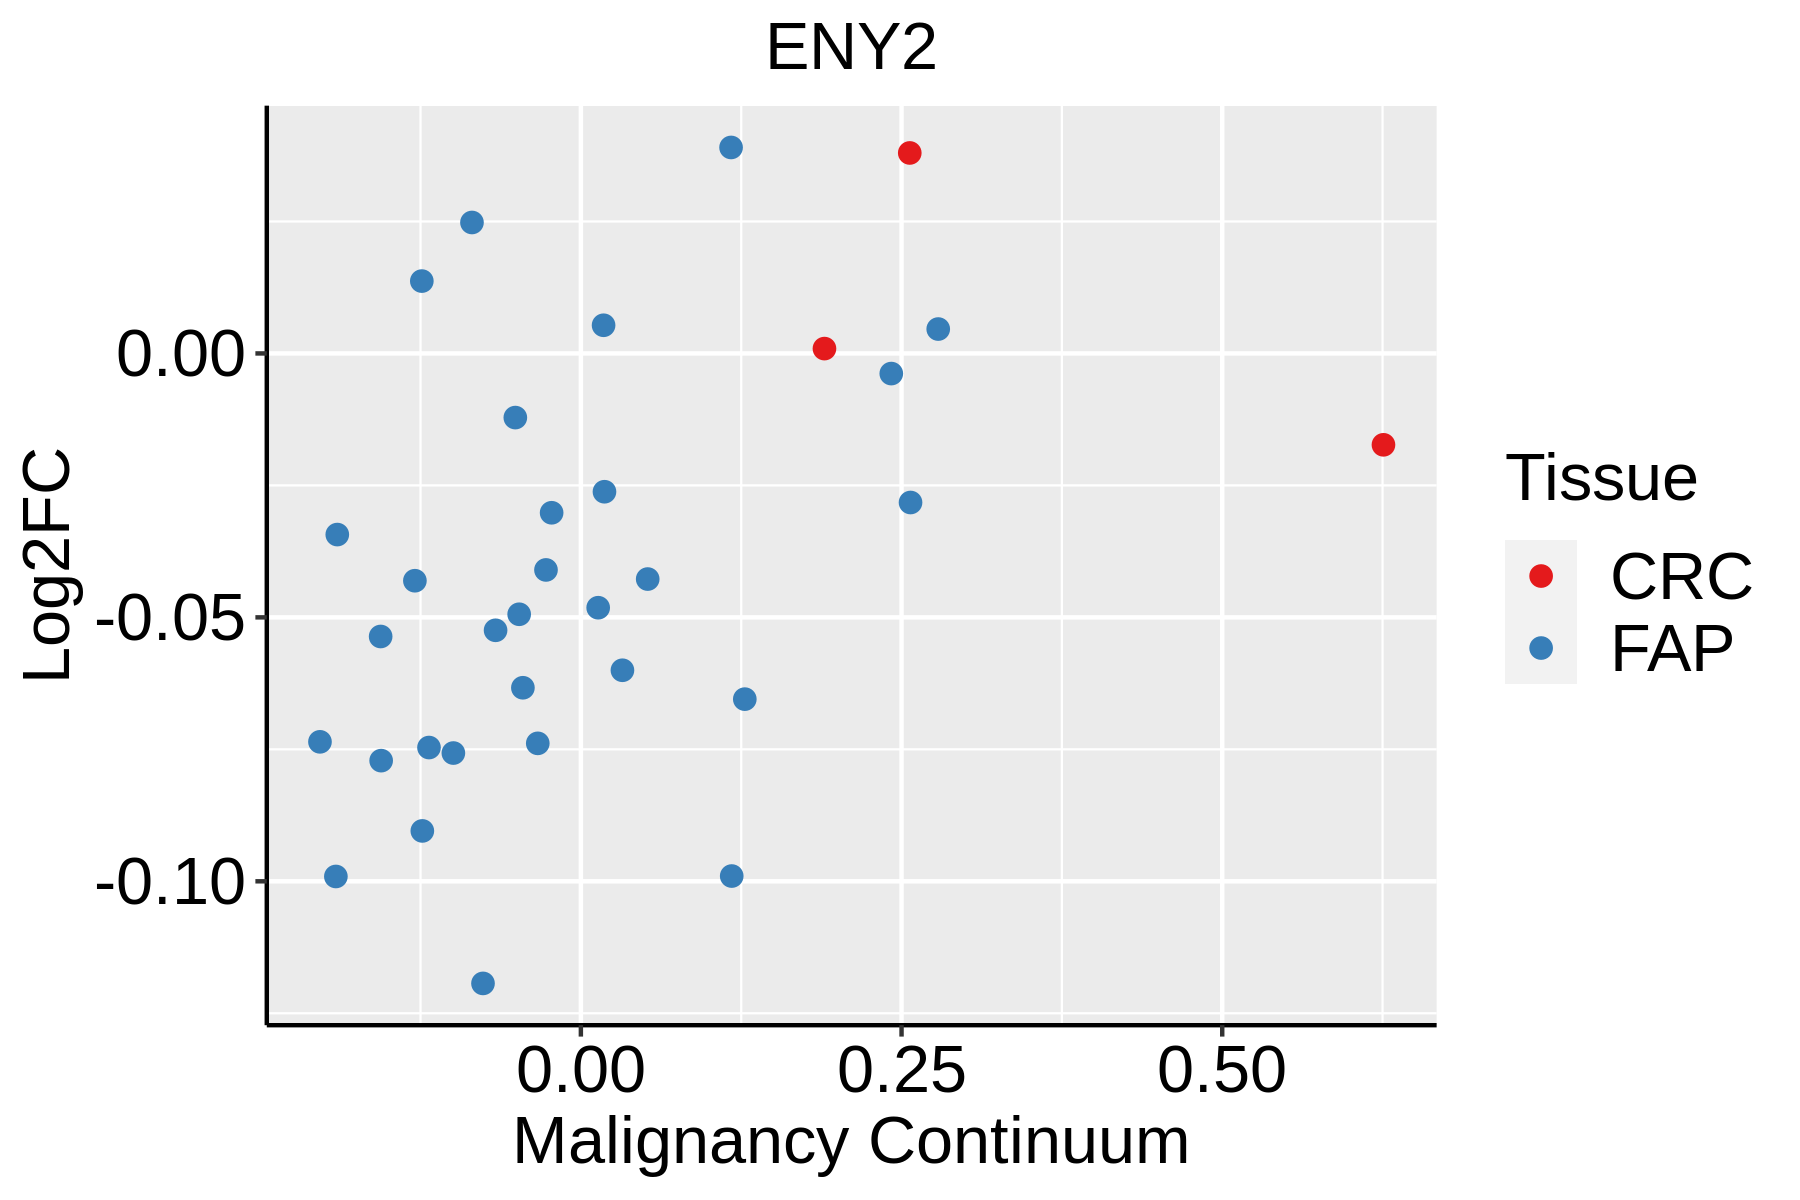 | FAP: Familial adenomatous polyposis |
| CRC: Colorectal cancer | ||
| Colorectum (HTA11) | 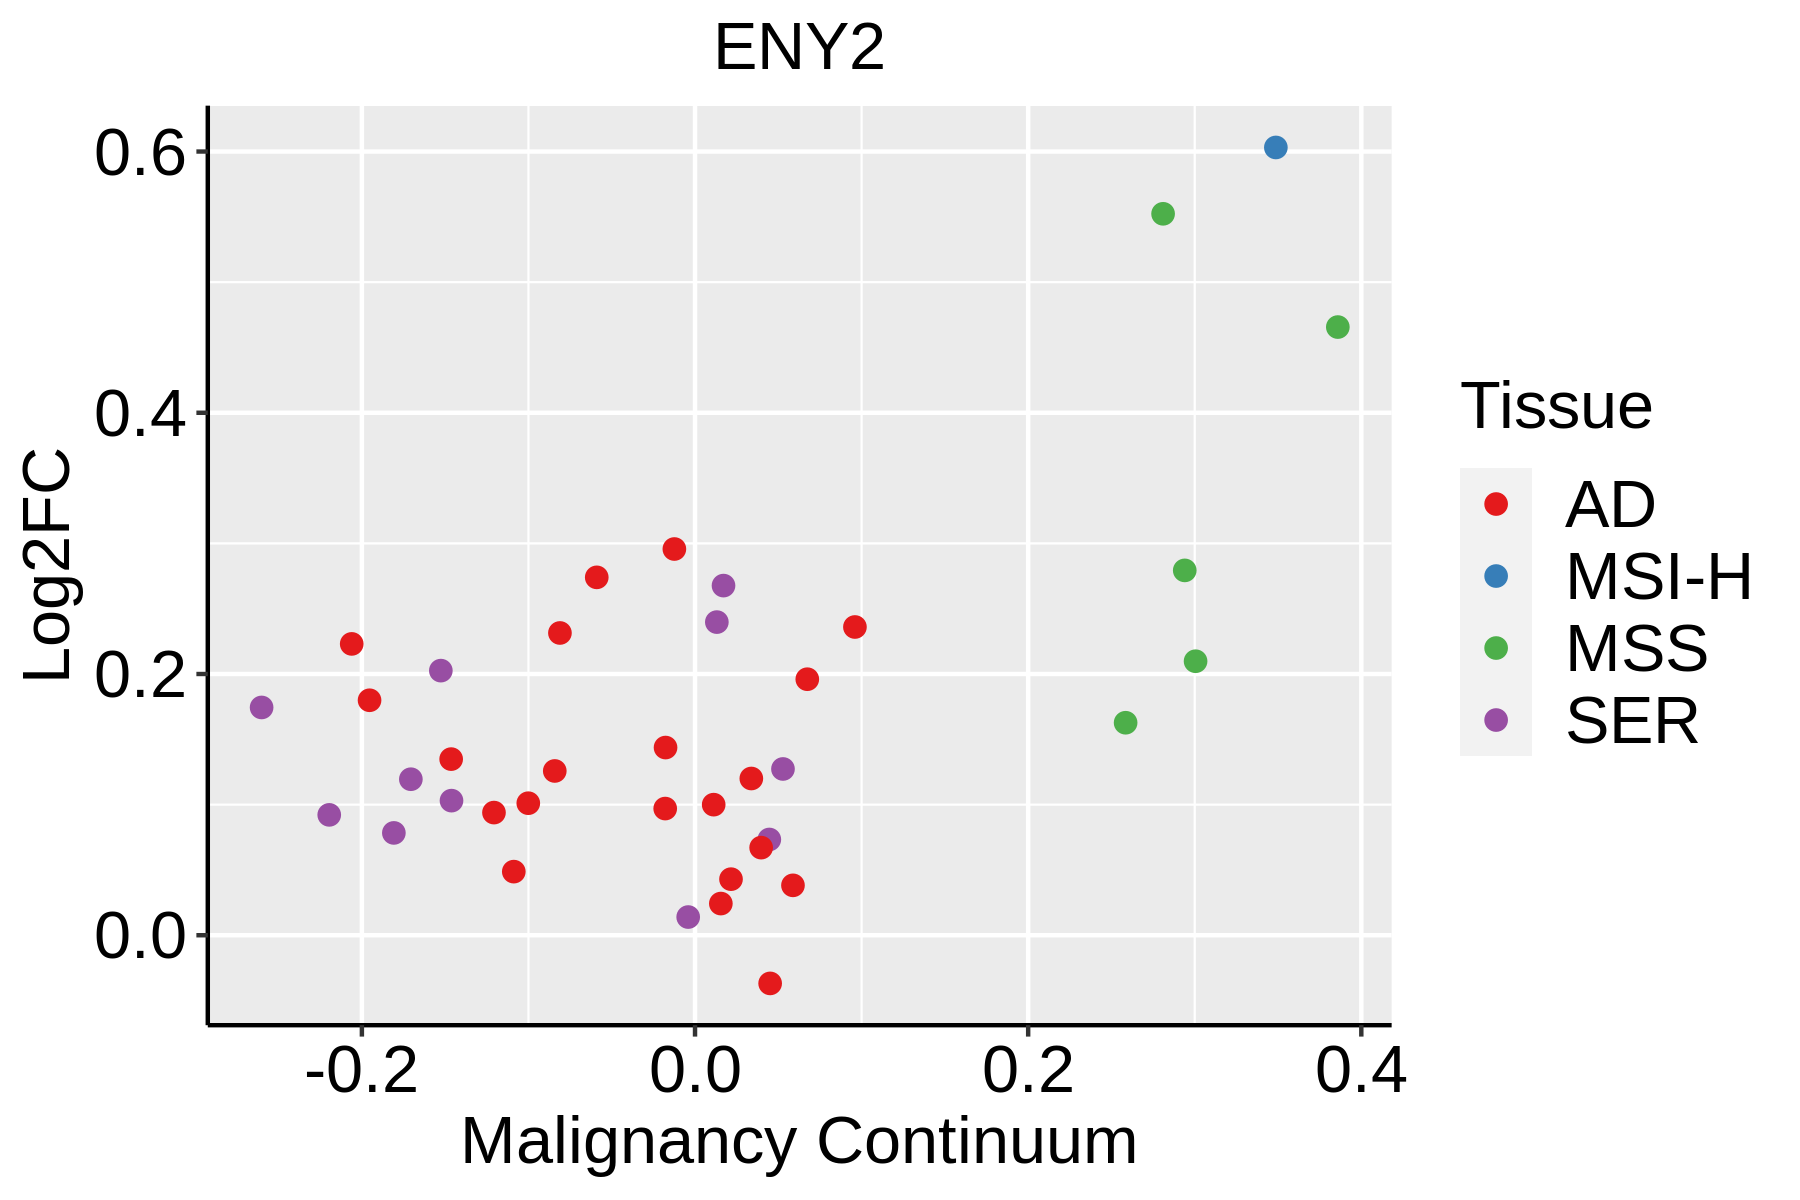 | AD: Adenomas |
| SER: Sessile serrated lesions | ||
| MSI-H: Microsatellite-high colorectal cancer | ||
| MSS: Microsatellite stable colorectal cancer | ||
| Endometrium | 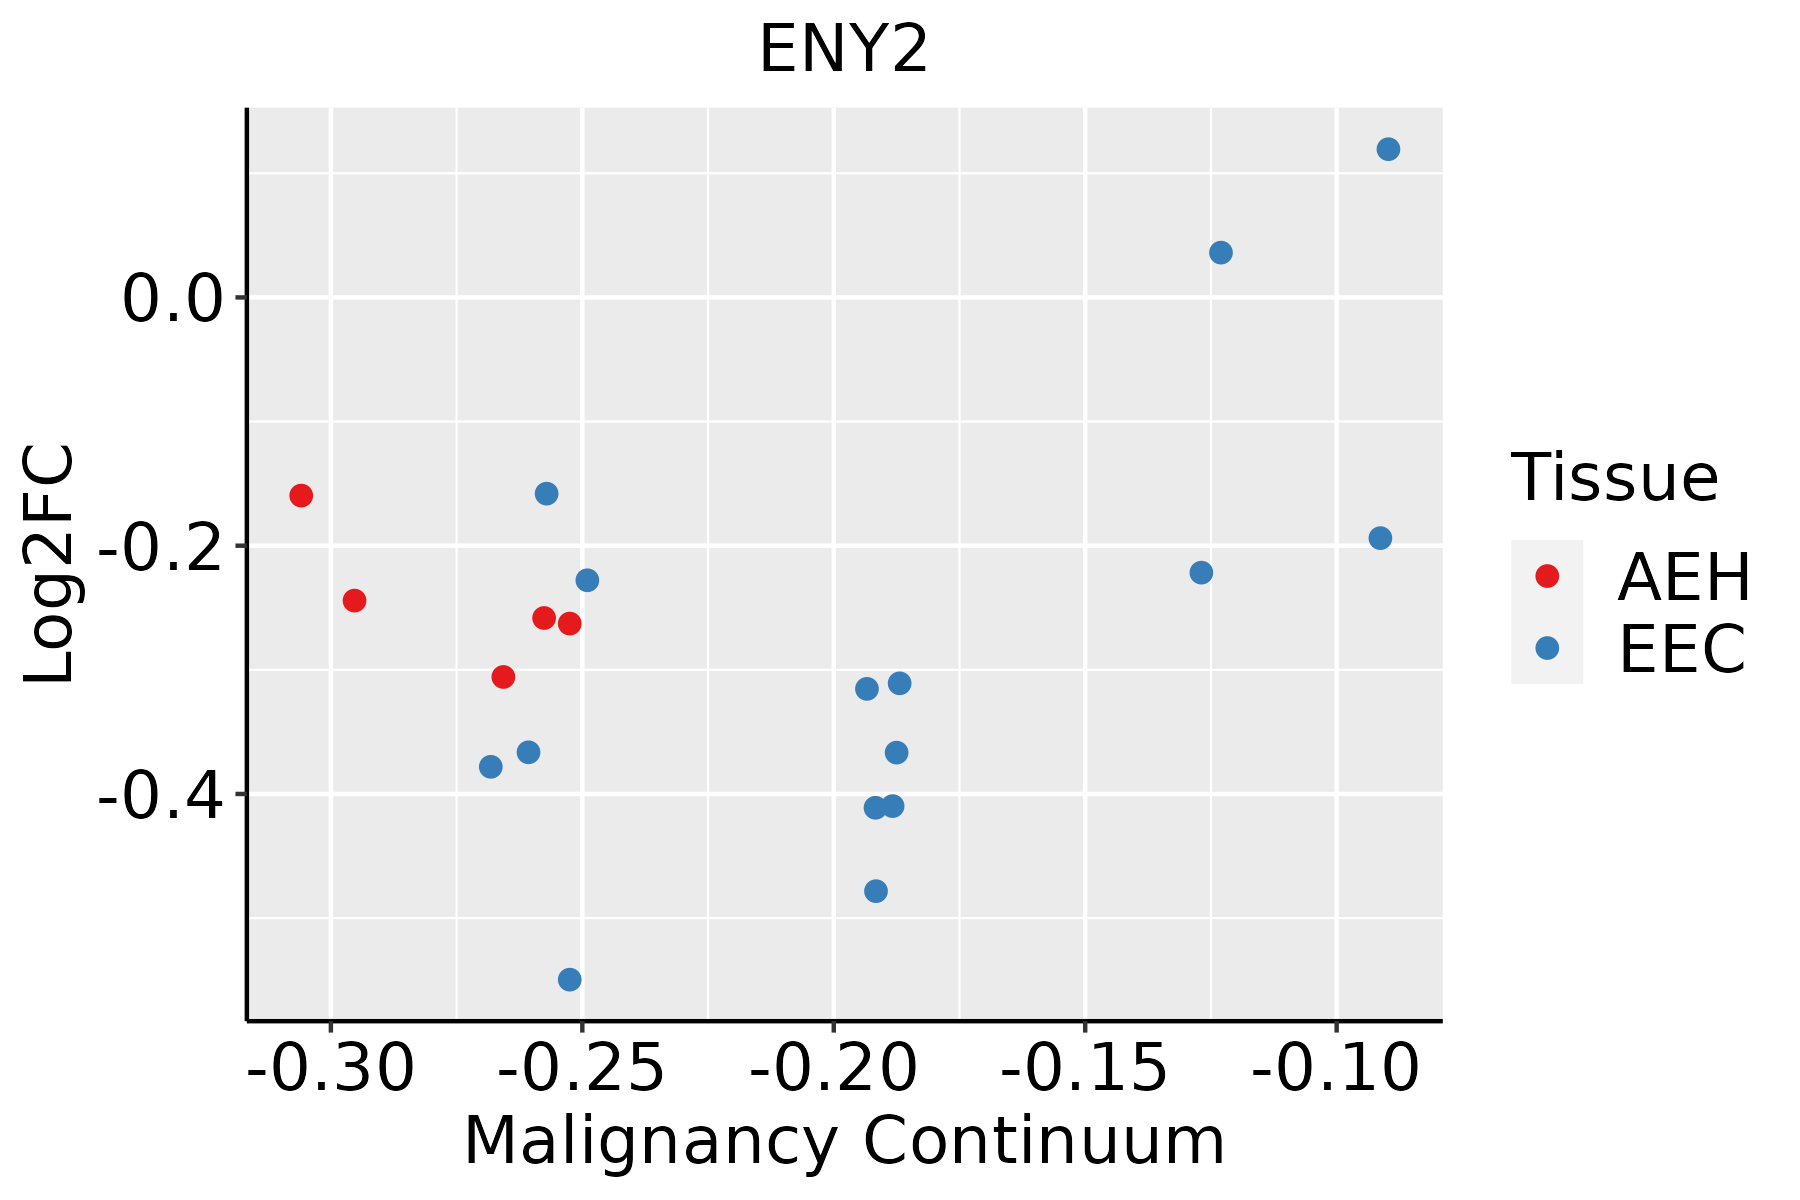 | AEH: Atypical endometrial hyperplasia |
| EEC: Endometrioid Cancer | ||
| Esophagus | 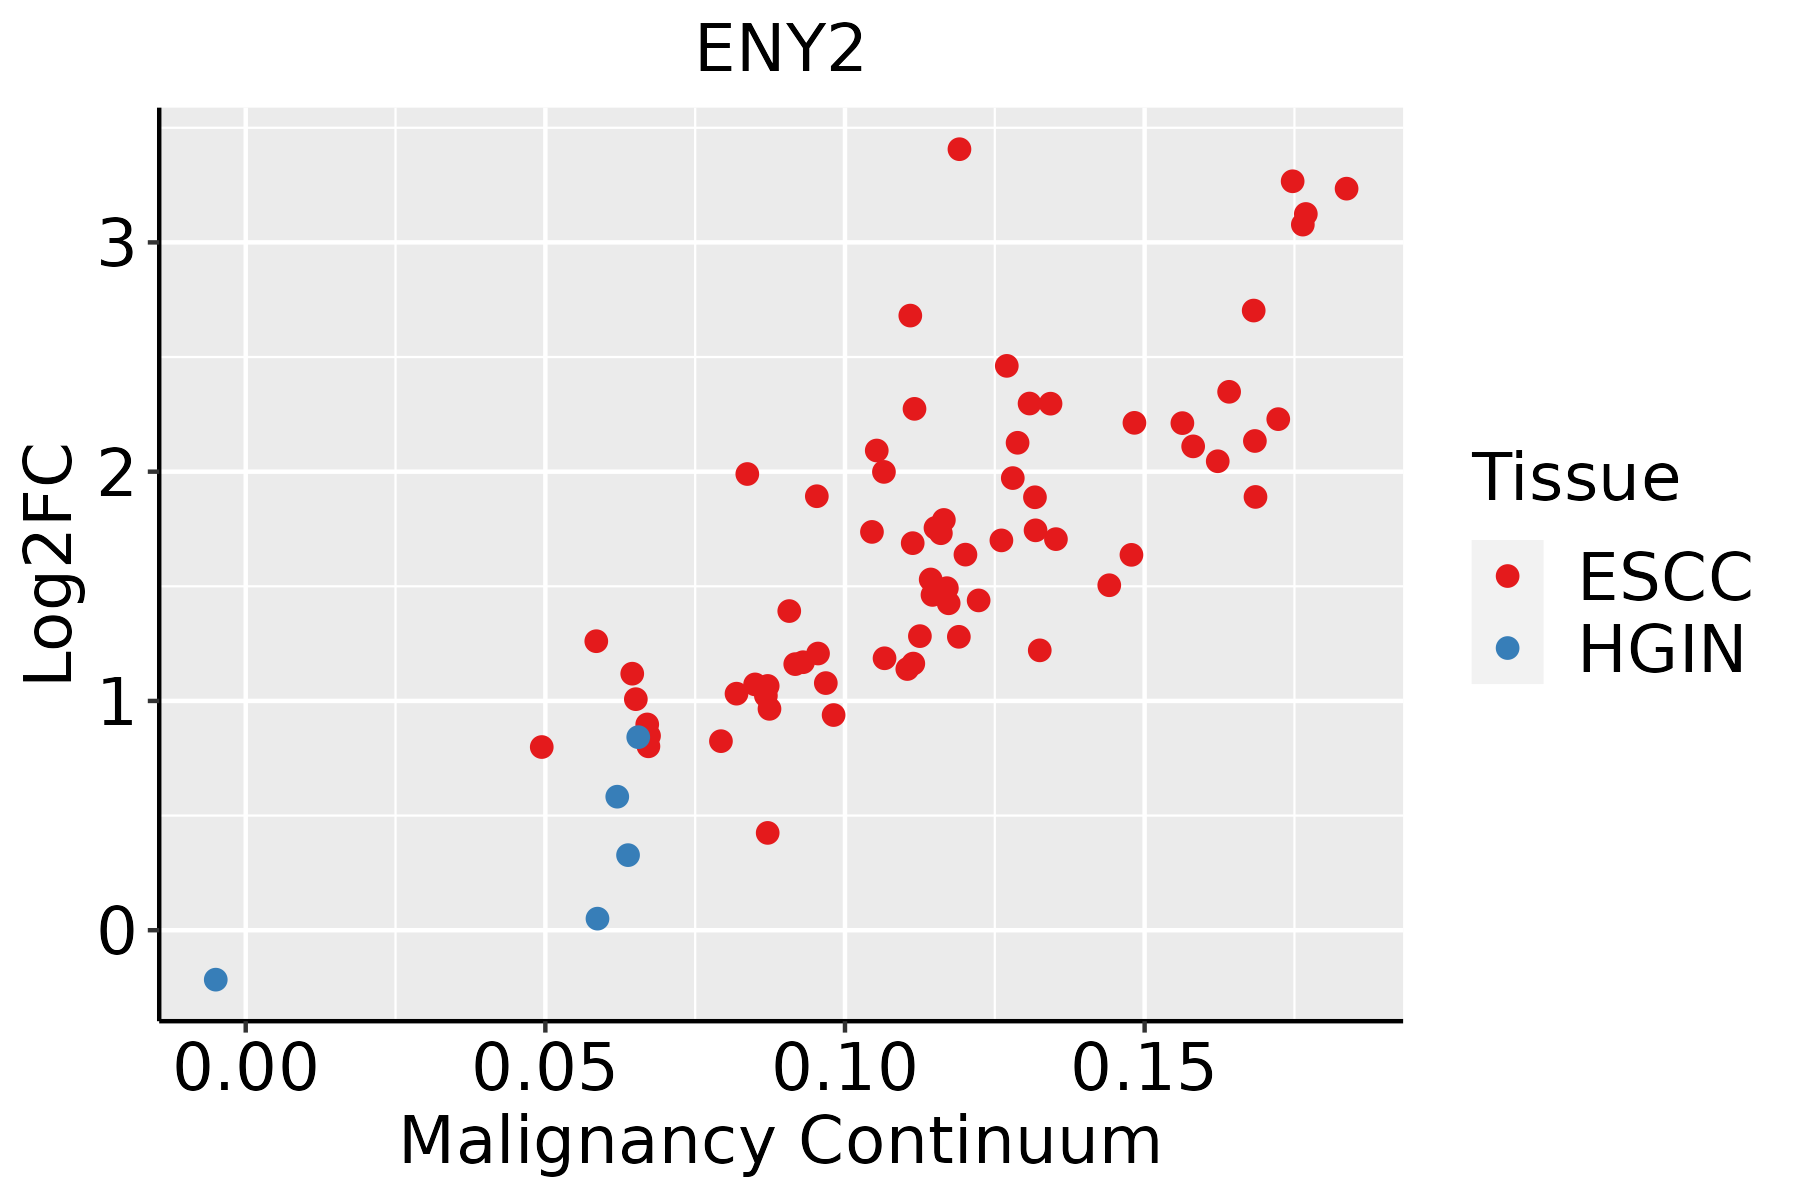 | ESCC: Esophageal squamous cell carcinoma |
| HGIN: High-grade intraepithelial neoplasias | ||
| LGIN: Low-grade intraepithelial neoplasias | ||
| Liver | 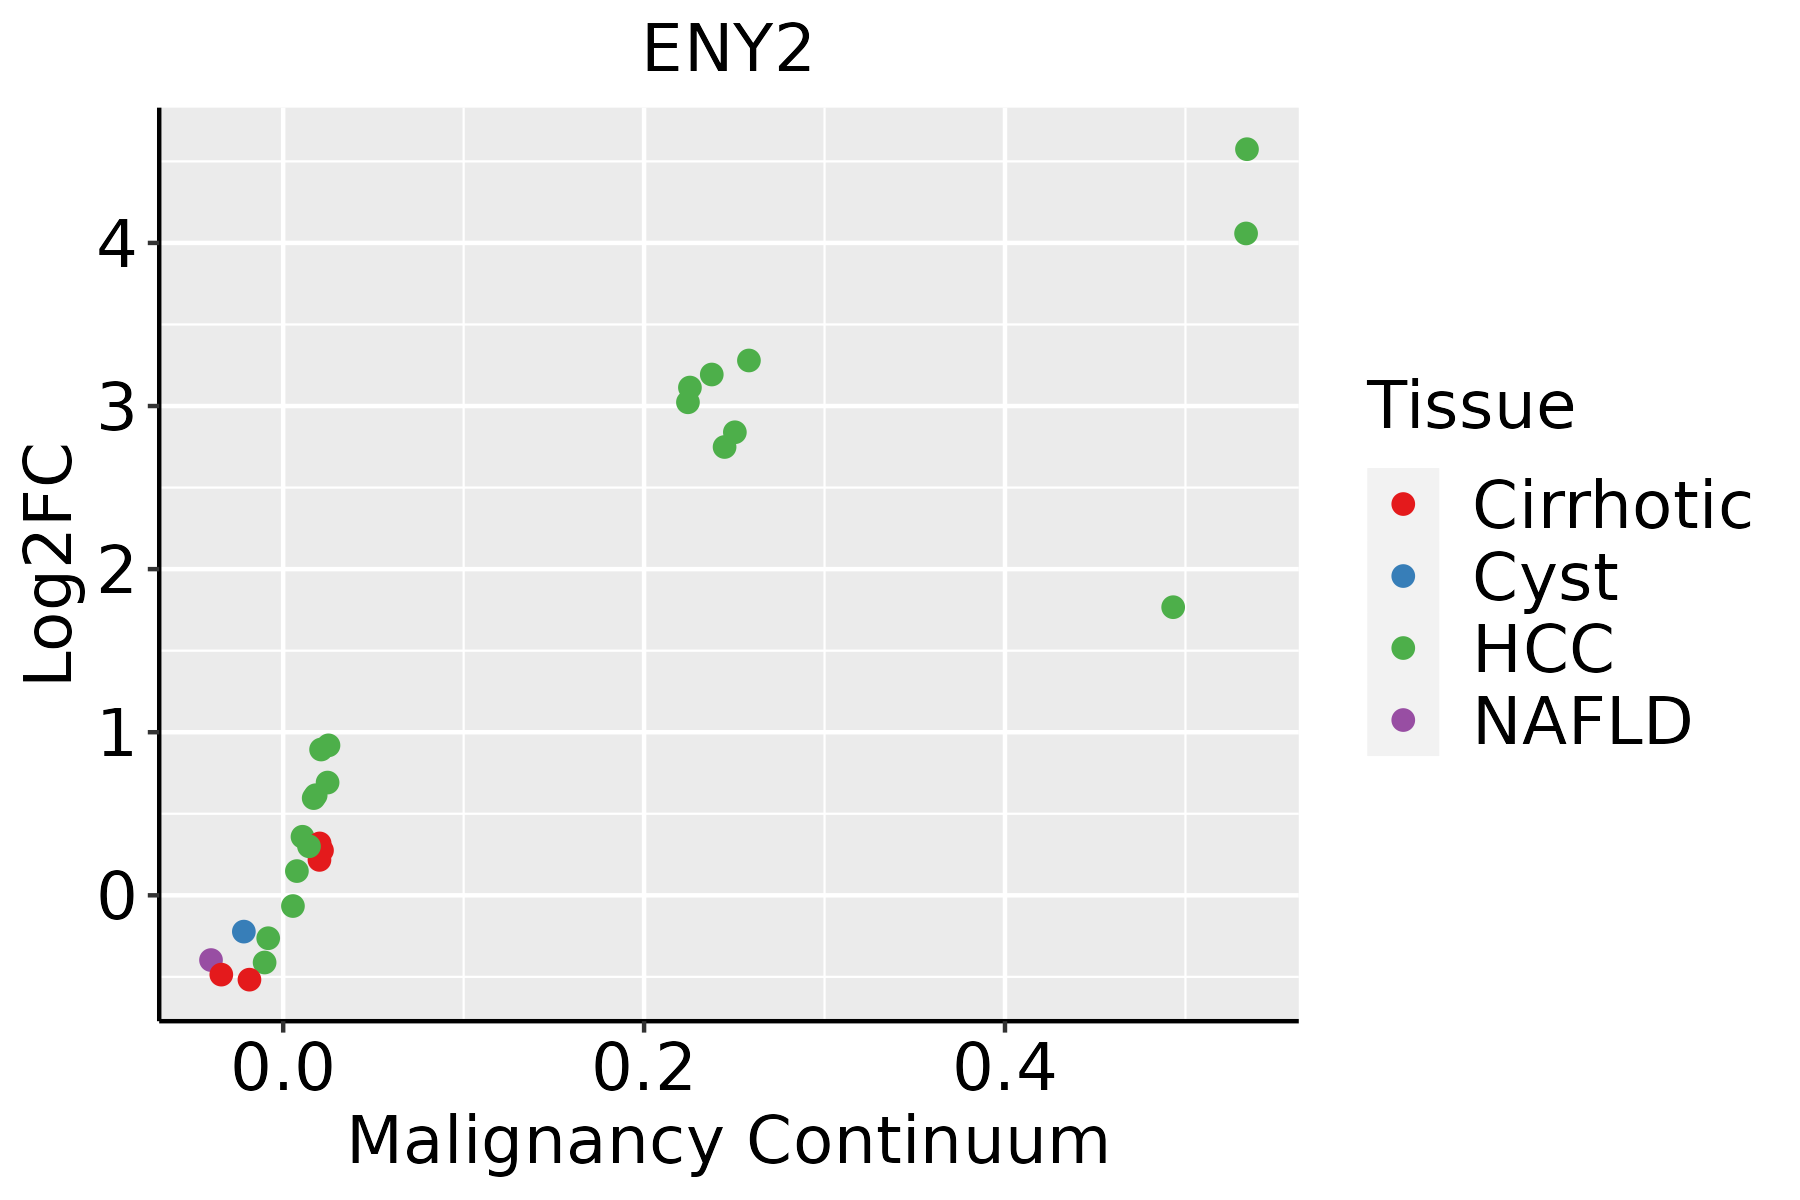 | HCC: Hepatocellular carcinoma |
| NAFLD: Non-alcoholic fatty liver disease | ||
| Oral Cavity |  | EOLP: Erosive Oral lichen planus |
| LP: leukoplakia | ||
| NEOLP: Non-erosive oral lichen planus | ||
| OSCC: Oral squamous cell carcinoma | ||
| Prostate | 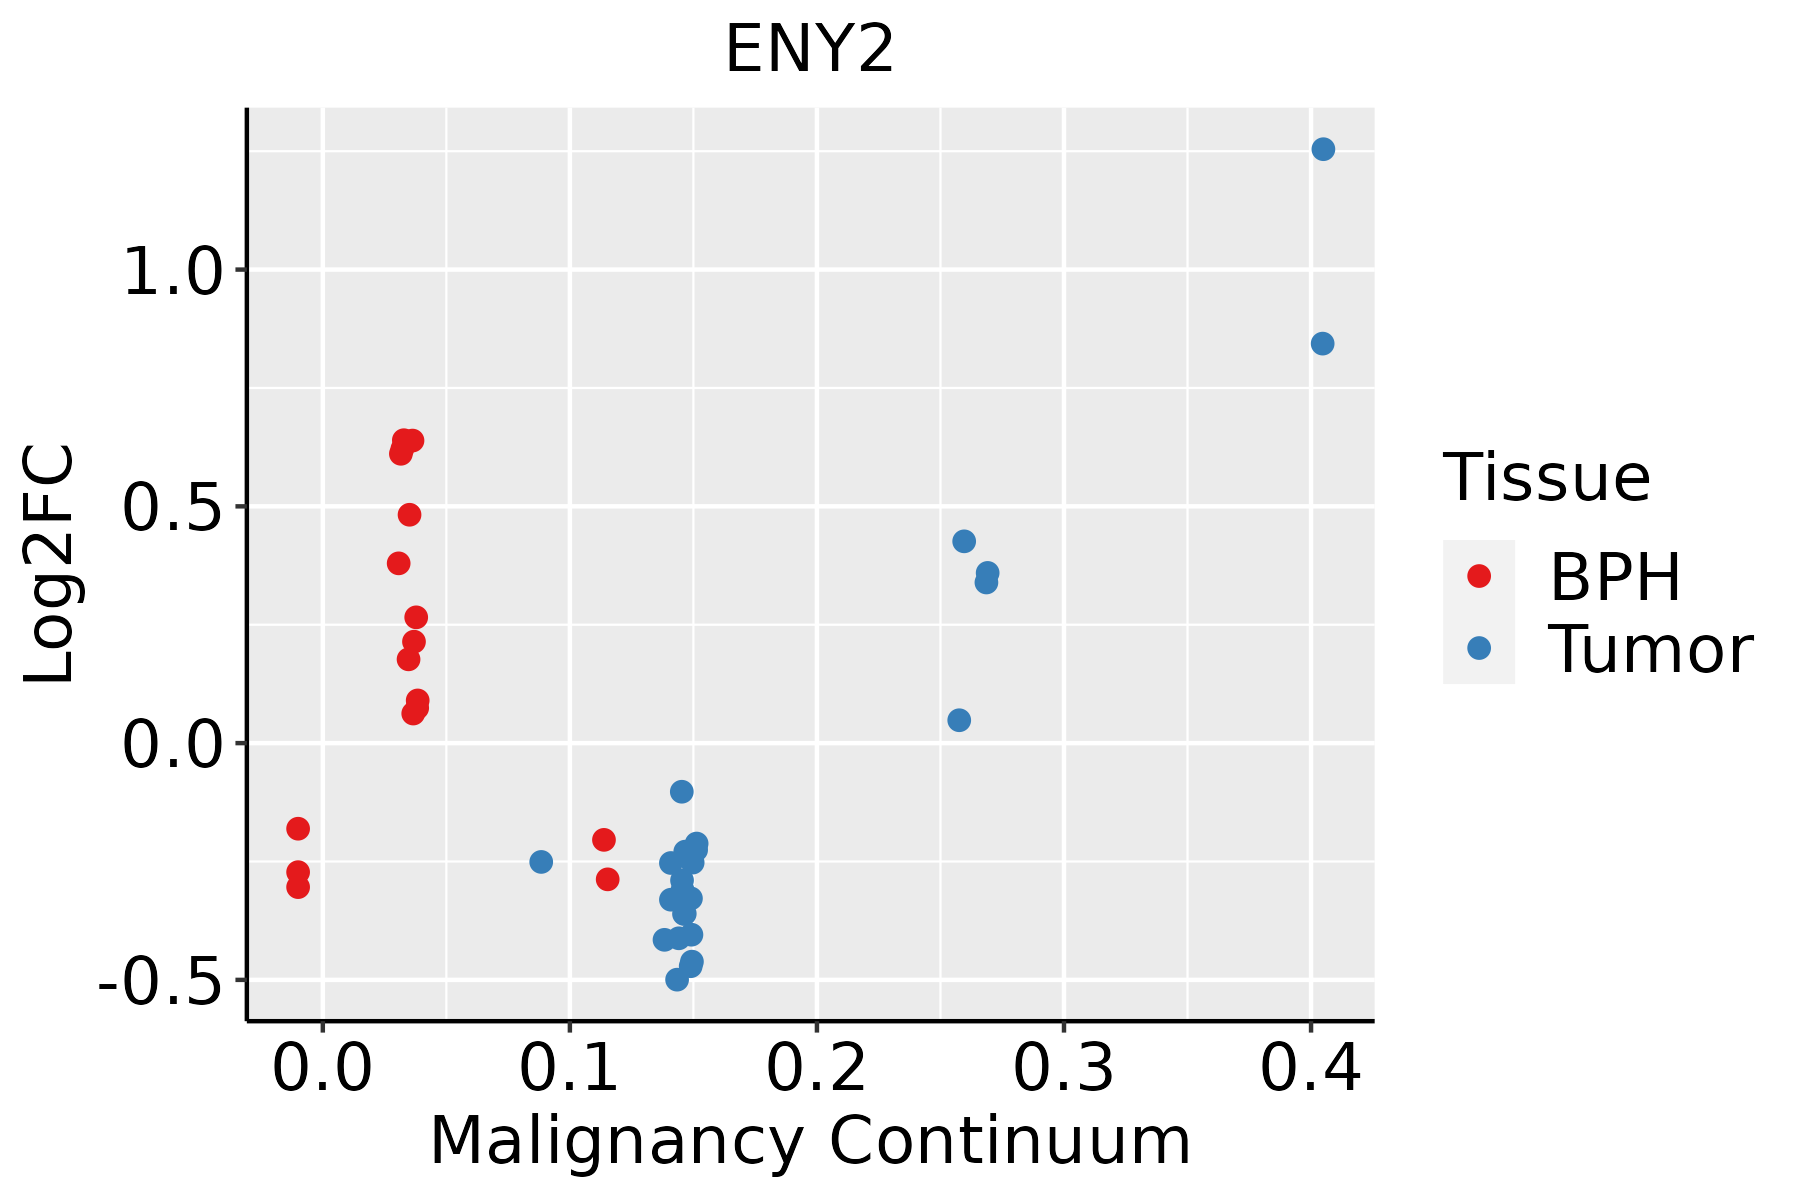 | BPH: Benign Prostatic Hyperplasia |
| Skin | 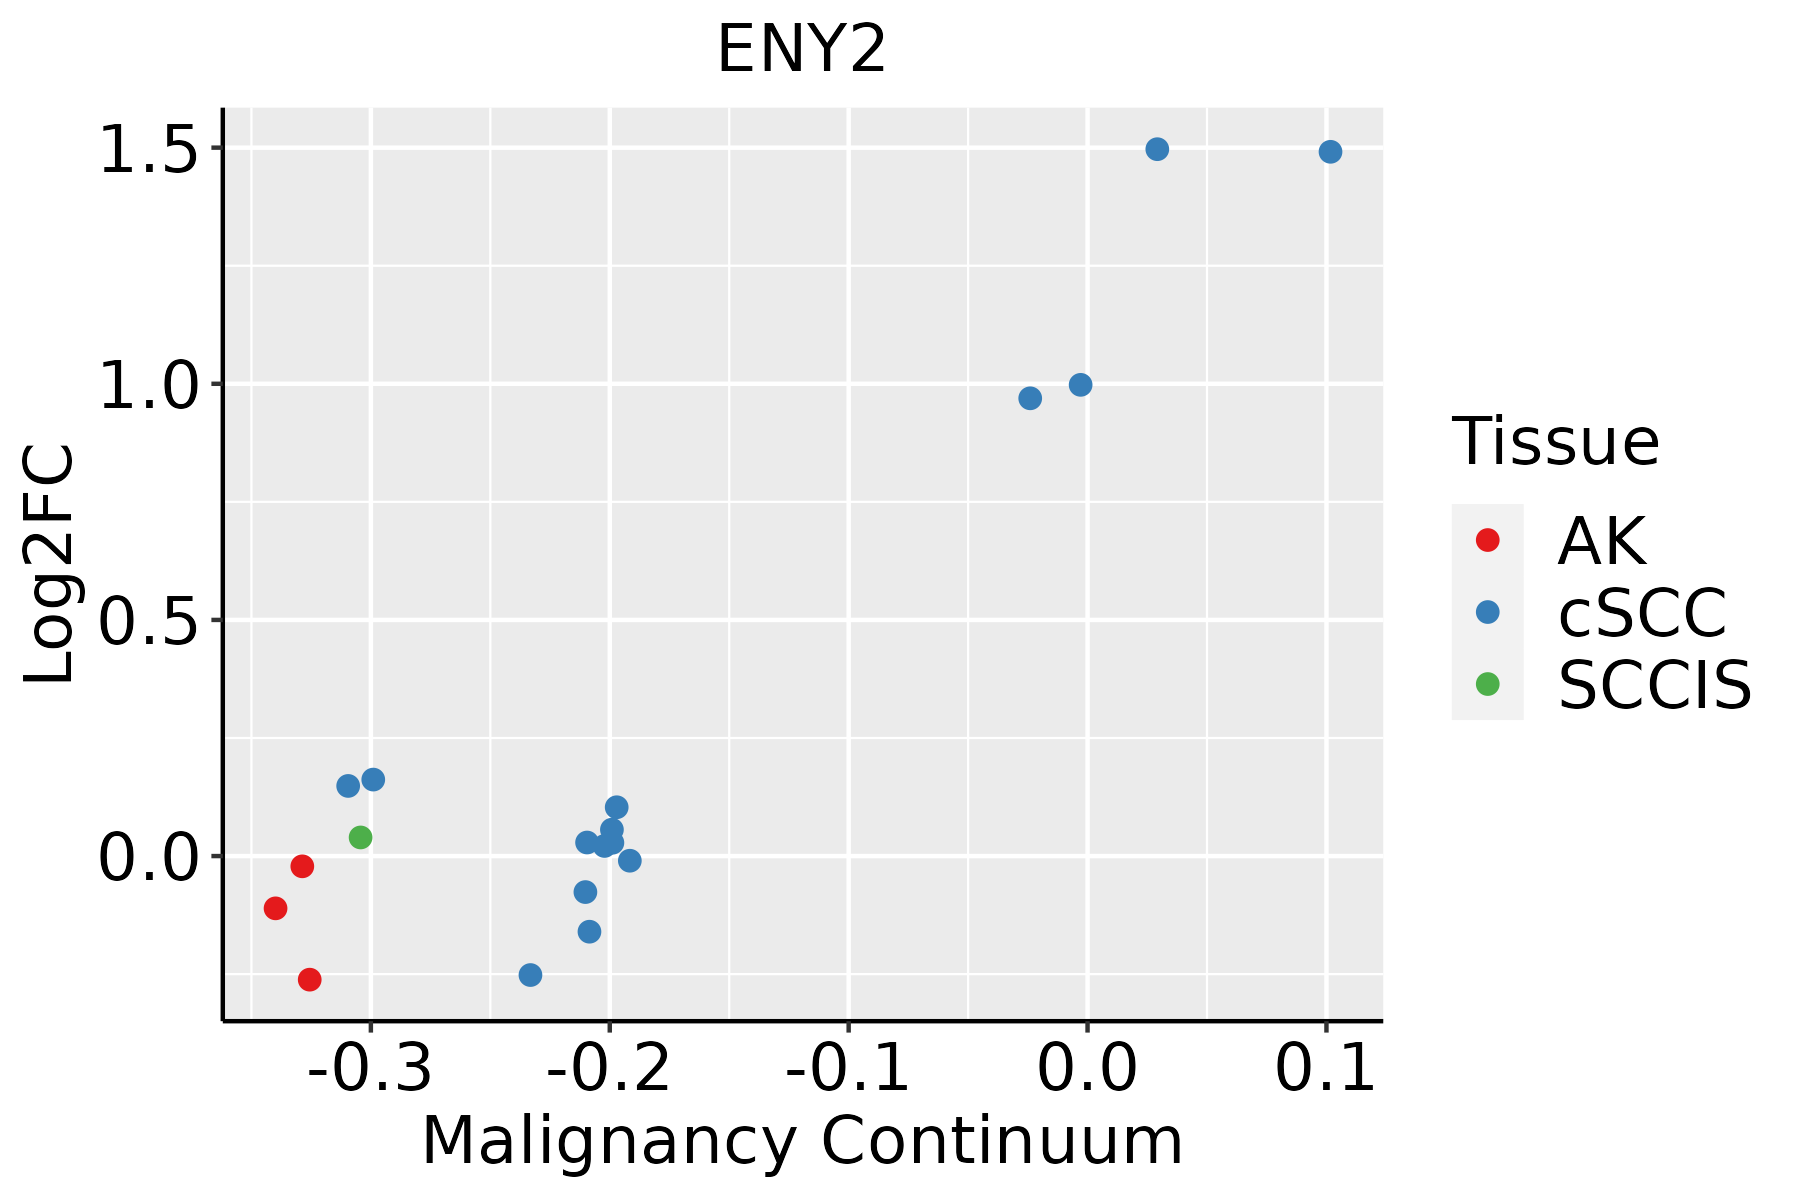 | AK: Actinic keratosis |
| cSCC: Cutaneous squamous cell carcinoma | ||
| SCCIS:squamous cell carcinoma in situ | ||
| Thyroid |  | ATC: Anaplastic thyroid cancer |
| HT: Hashimoto's thyroiditis | ||
| PTC: Papillary thyroid cancer |
| ∗log2FC in expression of this searched gene in stem-like cells from each diseased tissue sample relative to stem-like cells in normal samples in each tissue plotted against the malignancy continuum. Samples are colored based on if they are from different disease stage. |
Top |
Malignant transformation related pathway analysis |
| Find out the enriched GO biological processes and KEGG pathways involved in transition from healthy to precancer to cancer |
| Tissue | Disease Stage | Enriched GO biological Processes |
| Colorectum | AD |  |
| Colorectum | SER |  |
| Colorectum | MSS |  |
| Colorectum | MSI-H |  |
| Colorectum | FAP |  |
| ∗Top 15 enriched GO BP terms are showed in the bar plot of each disease state in each tissue. Each row represents a significant GO biological process which is colored according to the -log10(p.adjust). |
| Page: 1 2 3 4 5 6 7 8 9 |
| GO ID | Tissue | Disease Stage | Description | Gene Ratio | Bg Ratio | pvalue | p.adjust | Count |
| GO:003428414 | Breast | IDC | response to monosaccharide | 36/1434 | 225/18723 | 1.94e-05 | 4.83e-04 | 36 |
| GO:000974314 | Breast | IDC | response to carbohydrate | 38/1434 | 253/18723 | 4.87e-05 | 1.07e-03 | 38 |
| GO:000974613 | Breast | IDC | response to hexose | 33/1434 | 219/18723 | 1.39e-04 | 2.49e-03 | 33 |
| GO:000974913 | Breast | IDC | response to glucose | 31/1434 | 212/18723 | 3.75e-04 | 5.35e-03 | 31 |
| GO:005070812 | Breast | IDC | regulation of protein secretion | 36/1434 | 268/18723 | 6.93e-04 | 8.50e-03 | 36 |
| GO:004259313 | Breast | IDC | glucose homeostasis | 34/1434 | 258/18723 | 1.34e-03 | 1.39e-02 | 34 |
| GO:003350013 | Breast | IDC | carbohydrate homeostasis | 34/1434 | 259/18723 | 1.43e-03 | 1.46e-02 | 34 |
| GO:000640313 | Breast | IDC | RNA localization | 27/1434 | 201/18723 | 3.04e-03 | 2.60e-02 | 27 |
| GO:000167813 | Breast | IDC | cellular glucose homeostasis | 24/1434 | 172/18723 | 3.07e-03 | 2.60e-02 | 24 |
| GO:007133313 | Breast | IDC | cellular response to glucose stimulus | 21/1434 | 151/18723 | 5.59e-03 | 4.07e-02 | 21 |
| GO:007169212 | Breast | IDC | protein localization to extracellular region | 42/1434 | 368/18723 | 6.13e-03 | 4.38e-02 | 42 |
| GO:009008711 | Breast | IDC | regulation of peptide transport | 26/1434 | 202/18723 | 6.33e-03 | 4.47e-02 | 26 |
| GO:007133113 | Breast | IDC | cellular response to hexose stimulus | 21/1434 | 153/18723 | 6.50e-03 | 4.57e-02 | 21 |
| GO:001583312 | Breast | IDC | peptide transport | 32/1434 | 264/18723 | 6.61e-03 | 4.62e-02 | 32 |
| GO:007132213 | Breast | IDC | cellular response to carbohydrate stimulus | 22/1434 | 163/18723 | 6.62e-03 | 4.62e-02 | 22 |
| GO:000930613 | Breast | IDC | protein secretion | 41/1434 | 359/18723 | 6.64e-03 | 4.63e-02 | 41 |
| GO:003559213 | Breast | IDC | establishment of protein localization to extracellular region | 41/1434 | 360/18723 | 6.96e-03 | 4.81e-02 | 41 |
| GO:007132613 | Breast | IDC | cellular response to monosaccharide stimulus | 21/1434 | 154/18723 | 7.00e-03 | 4.83e-02 | 21 |
| GO:003428424 | Breast | DCIS | response to monosaccharide | 36/1390 | 225/18723 | 9.86e-06 | 2.60e-04 | 36 |
| GO:000974324 | Breast | DCIS | response to carbohydrate | 38/1390 | 253/18723 | 2.48e-05 | 5.72e-04 | 38 |
| Page: 1 2 3 4 5 6 7 8 9 10 11 12 13 14 15 16 17 18 19 20 21 22 23 24 25 26 27 28 29 |
| Pathway ID | Tissue | Disease Stage | Description | Gene Ratio | Bg Ratio | pvalue | p.adjust | qvalue | Count |
| Page: 1 |
Top |
Cell-cell communication analysis |
| Identification of potential cell-cell interactions between two cell types and their ligand-receptor pairs for different disease states |
| Ligand | Receptor | LRpair | Pathway | Tissue | Disease Stage |
| Page: 1 |
Top |
Single-cell gene regulatory network inference analysis |
| Find out the significant the regulons (TFs) and the target genes of each regulon across cell types for different disease states |
| TF | Cell Type | Tissue | Disease Stage | Target Gene | RSS | Regulon Activity |
| ∗The dot plots of a searched regulon are shown for all cell subpopulations in each disease state of each tissue based on the regulon specific score inferred using pySCENIC and by calculating the average expression. |
| Page: 1 |
Top |
Somatic mutation of malignant transformation related genes |
| Annotation of somatic variants for genes involved in malignant transformation |
| Hugo Symbol | Variant Class | Variant Classification | dbSNP RS | HGVSc | HGVSp | HGVSp Short | SWISSPROT | BIOTYPE | SIFT | PolyPhen | Tumor Sample Barcode | Tissue | Histology | Sex | Age | Stage | Therapy Types | Drugs | Outcome |
| ENY2 | SNV | Missense_Mutation | c.68N>T | p.Thr23Ile | p.T23I | Q9NPA8 | protein_coding | deleterious(0.02) | possibly_damaging(0.462) | TCGA-A6-6138-01 | Colorectum | colon adenocarcinoma | Male | <65 | I/II | Unknown | Unknown | SD | |
| ENY2 | SNV | Missense_Mutation | c.61A>G | p.Ile21Val | p.I21V | Q9NPA8 | protein_coding | tolerated(0.53) | benign(0.005) | TCGA-NH-A5IV-01 | Colorectum | colon adenocarcinoma | Female | >=65 | I/II | Unknown | Unknown | SD | |
| ENY2 | SNV | Missense_Mutation | novel | c.41C>T | p.Ala14Val | p.A14V | Q9NPA8 | protein_coding | tolerated(0.06) | benign(0.379) | TCGA-AJ-A8CW-01 | Endometrium | uterine corpus endometrioid carcinoma | Female | <65 | I/II | Unknown | Unknown | SD |
| ENY2 | SNV | Missense_Mutation | rs754316009 | c.44N>T | p.Ala15Val | p.A15V | Q9NPA8 | protein_coding | tolerated(0.58) | benign(0) | TCGA-AP-A051-01 | Endometrium | uterine corpus endometrioid carcinoma | Female | >=65 | I/II | Unknown | Unknown | SD |
| ENY2 | SNV | Missense_Mutation | novel | c.179N>G | p.Glu60Gly | p.E60G | Q9NPA8 | protein_coding | tolerated(0.08) | benign(0.098) | TCGA-AX-A2HC-01 | Endometrium | uterine corpus endometrioid carcinoma | Female | <65 | III/IV | Chemotherapy | paclitaxel | PD |
| ENY2 | SNV | Missense_Mutation | novel | c.298N>G | p.Ser100Gly | p.S100G | Q9NPA8 | protein_coding | tolerated(0.15) | benign(0) | TCGA-FI-A3PV-01 | Endometrium | uterine corpus endometrioid carcinoma | Female | >=65 | I/II | Unknown | Unknown | PD |
| ENY2 | SNV | Missense_Mutation | c.282N>A | p.Phe94Leu | p.F94L | Q9NPA8 | protein_coding | tolerated(0.07) | possibly_damaging(0.752) | TCGA-44-7670-01 | Lung | lung adenocarcinoma | Female | <65 | I/II | Chemotherapy | docetaxel | SD | |
| ENY2 | SNV | Missense_Mutation | rs754316009 | c.44N>T | p.Ala15Val | p.A15V | Q9NPA8 | protein_coding | tolerated(0.58) | benign(0) | TCGA-86-A4JF-01 | Lung | lung adenocarcinoma | Male | <65 | I/II | Chemotherapy | unknown | PD |
| ENY2 | SNV | Missense_Mutation | c.256G>C | p.Glu86Gln | p.E86Q | Q9NPA8 | protein_coding | deleterious(0) | benign(0.435) | TCGA-L9-A7SV-01 | Lung | lung adenocarcinoma | Male | >=65 | I/II | Chemotherapy | cisplatin | CR | |
| ENY2 | SNV | Missense_Mutation | novel | c.18N>A | p.Met6Ile | p.M6I | Q9NPA8 | protein_coding | tolerated(0.1) | benign(0.005) | TCGA-CV-6441-01 | Oral cavity | head & neck squamous cell carcinoma | Male | <65 | III/IV | Unknown | Unknown | PD |
| Page: 1 2 |
Top |
Related drugs of malignant transformation related genes |
| Identification of chemicals and drugs interact with genes involved in malignant transfromation |
| (DGIdb 4.0) |
| Entrez ID | Symbol | Category | Interaction Types | Drug Claim Name | Drug Name | PMIDs |
| Page: 1 |

Copyright 2023-Present -The University of Texas Health Science Center at Houston |