| Tissue | Expression Dynamics | Abbreviation |
| Esophagus | 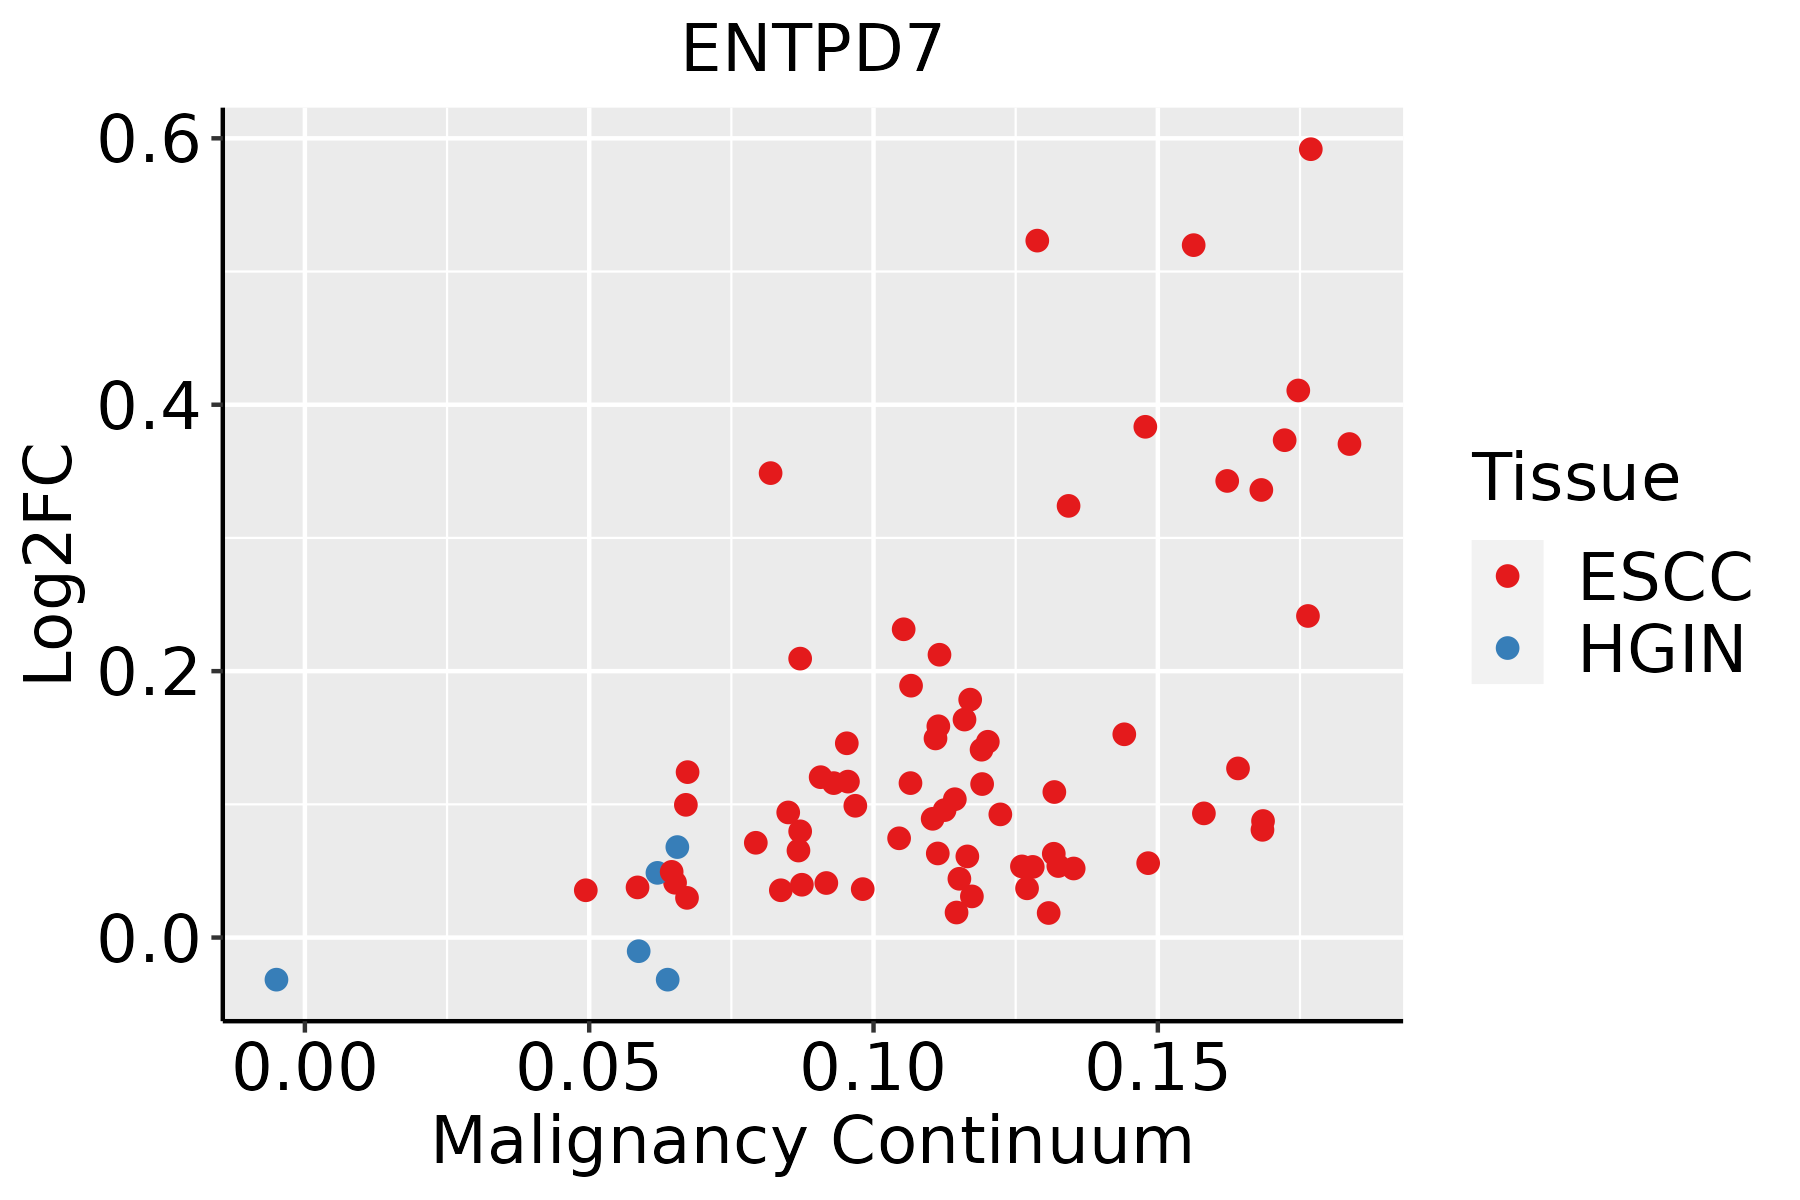 | ESCC: Esophageal squamous cell carcinoma |
| HGIN: High-grade intraepithelial neoplasias |
| LGIN: Low-grade intraepithelial neoplasias |
| GC |  | CAG: Chronic atrophic gastritis |
| CAG with IM: Chronic atrophic gastritis with intestinal metaplasia |
| CSG: Chronic superficial gastritis |
| GC: Gastric cancer |
| SIM: Severe intestinal metaplasia |
| WIM: Wild intestinal metaplasia |
| Prostate | 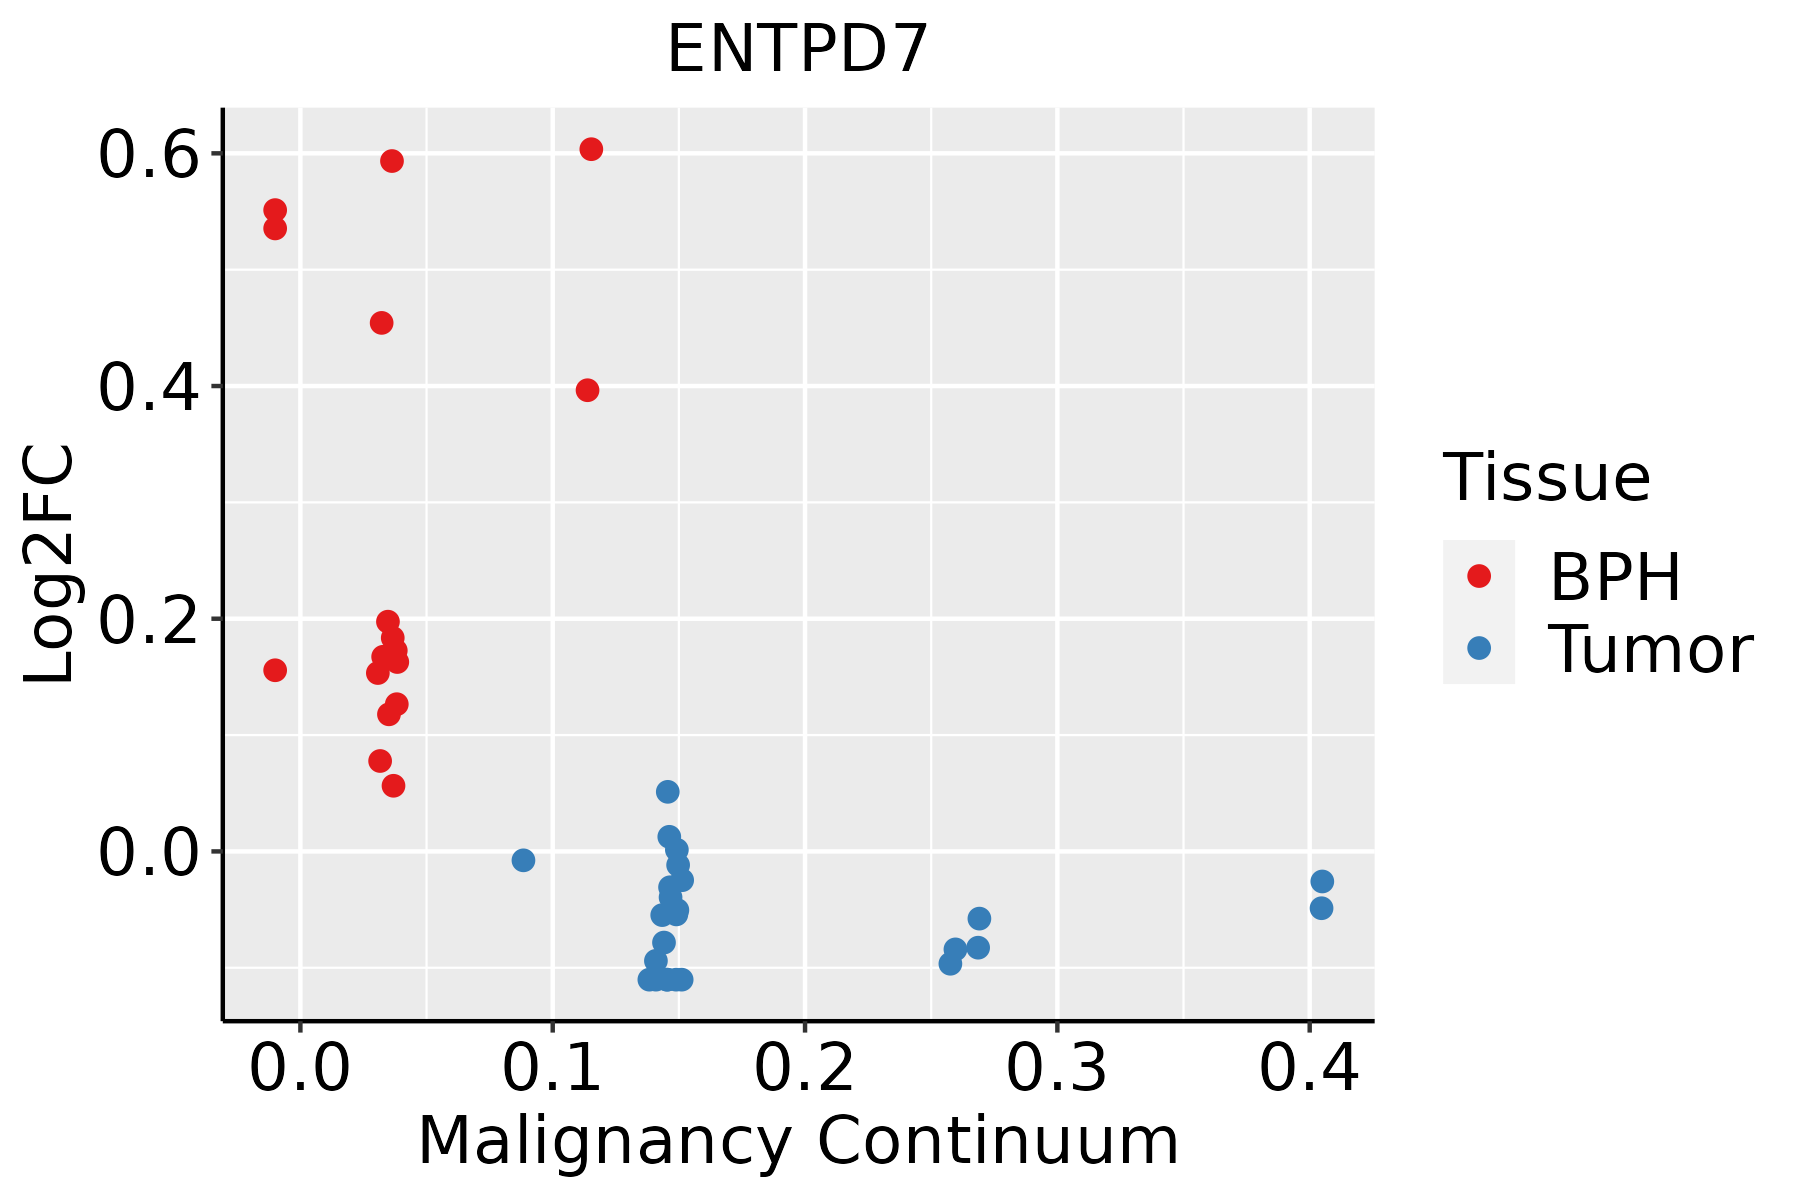 | BPH: Benign Prostatic Hyperplasia |
| GO ID | Tissue | Disease Stage | Description | Gene Ratio | Bg Ratio | pvalue | p.adjust | Count |
| GO:0034655110 | Esophagus | ESCC | nucleobase-containing compound catabolic process | 272/8552 | 407/18723 | 2.92e-18 | 2.90e-16 | 272 |
| GO:004670018 | Esophagus | ESCC | heterocycle catabolic process | 286/8552 | 445/18723 | 1.12e-15 | 7.47e-14 | 286 |
| GO:004427019 | Esophagus | ESCC | cellular nitrogen compound catabolic process | 288/8552 | 451/18723 | 3.03e-15 | 1.79e-13 | 288 |
| GO:001943918 | Esophagus | ESCC | aromatic compound catabolic process | 295/8552 | 467/18723 | 1.09e-14 | 5.98e-13 | 295 |
| GO:190136118 | Esophagus | ESCC | organic cyclic compound catabolic process | 307/8552 | 495/18723 | 9.99e-14 | 4.80e-12 | 307 |
| GO:0006753110 | Esophagus | ESCC | nucleoside phosphate metabolic process | 288/8552 | 497/18723 | 1.80e-08 | 3.50e-07 | 288 |
| GO:0019693111 | Esophagus | ESCC | ribose phosphate metabolic process | 234/8552 | 396/18723 | 4.24e-08 | 7.76e-07 | 234 |
| GO:0009117111 | Esophagus | ESCC | nucleotide metabolic process | 282/8552 | 489/18723 | 4.70e-08 | 8.50e-07 | 282 |
| GO:0009141111 | Esophagus | ESCC | nucleoside triphosphate metabolic process | 78/8552 | 112/18723 | 2.36e-07 | 3.59e-06 | 78 |
| GO:0009259111 | Esophagus | ESCC | ribonucleotide metabolic process | 224/8552 | 385/18723 | 4.41e-07 | 6.00e-06 | 224 |
| GO:0072521111 | Esophagus | ESCC | purine-containing compound metabolic process | 238/8552 | 416/18723 | 1.20e-06 | 1.49e-05 | 238 |
| GO:0009150111 | Esophagus | ESCC | purine ribonucleotide metabolic process | 213/8552 | 368/18723 | 1.40e-06 | 1.69e-05 | 213 |
| GO:0006163111 | Esophagus | ESCC | purine nucleotide metabolic process | 226/8552 | 396/18723 | 2.81e-06 | 3.21e-05 | 226 |
| GO:0009144110 | Esophagus | ESCC | purine nucleoside triphosphate metabolic process | 61/8552 | 88/18723 | 6.06e-06 | 6.23e-05 | 61 |
| GO:000919918 | Esophagus | ESCC | ribonucleoside triphosphate metabolic process | 61/8552 | 89/18723 | 1.07e-05 | 1.01e-04 | 61 |
| GO:000920519 | Esophagus | ESCC | purine ribonucleoside triphosphate metabolic process | 55/8552 | 82/18723 | 7.34e-05 | 5.51e-04 | 55 |
| GO:000913219 | Esophagus | ESCC | nucleoside diphosphate metabolic process | 77/8552 | 124/18723 | 1.65e-04 | 1.09e-03 | 77 |
| GO:000918520 | Esophagus | ESCC | ribonucleoside diphosphate metabolic process | 66/8552 | 106/18723 | 4.21e-04 | 2.39e-03 | 66 |
| GO:00062203 | Esophagus | ESCC | pyrimidine nucleotide metabolic process | 35/8552 | 50/18723 | 4.33e-04 | 2.44e-03 | 35 |
| GO:00091473 | Esophagus | ESCC | pyrimidine nucleoside triphosphate metabolic process | 20/8552 | 25/18723 | 4.81e-04 | 2.69e-03 | 20 |
| Hugo Symbol | Variant Class | Variant Classification | dbSNP RS | HGVSc | HGVSp | HGVSp Short | SWISSPROT | BIOTYPE | SIFT | PolyPhen | Tumor Sample Barcode | Tissue | Histology | Sex | Age | Stage | Therapy Types | Drugs | Outcome |
| ENTPD7 | SNV | Missense_Mutation | | c.696N>A | p.Phe232Leu | p.F232L | Q9NQZ7 | protein_coding | tolerated(0.06) | possibly_damaging(0.685) | TCGA-A2-A0EQ-01 | Breast | breast invasive carcinoma | Female | <65 | I/II | Chemotherapy | adriamycin | SD |
| ENTPD7 | SNV | Missense_Mutation | | c.1069N>T | p.Pro357Ser | p.P357S | Q9NQZ7 | protein_coding | deleterious(0.03) | probably_damaging(0.998) | TCGA-A2-A25E-01 | Breast | breast invasive carcinoma | Female | <65 | III/IV | Chemotherapy | cytoxan | PD |
| ENTPD7 | SNV | Missense_Mutation | | c.883G>C | p.Gly295Arg | p.G295R | Q9NQZ7 | protein_coding | deleterious(0) | probably_damaging(1) | TCGA-A8-A07R-01 | Breast | breast invasive carcinoma | Female | >=65 | III/IV | Ancillary | zoledronic | SD |
| ENTPD7 | SNV | Missense_Mutation | | c.1054C>G | p.Leu352Val | p.L352V | Q9NQZ7 | protein_coding | tolerated(0.1) | benign(0.292) | TCGA-AC-A23H-01 | Breast | breast invasive carcinoma | Female | >=65 | I/II | Unknown | Unknown | PD |
| ENTPD7 | SNV | Missense_Mutation | novel | c.772N>T | p.Asp258Tyr | p.D258Y | Q9NQZ7 | protein_coding | deleterious(0) | probably_damaging(0.993) | TCGA-AN-A0AR-01 | Breast | breast invasive carcinoma | Female | <65 | I/II | Unknown | Unknown | SD |
| ENTPD7 | SNV | Missense_Mutation | | c.1622N>A | p.Ser541Asn | p.S541N | Q9NQZ7 | protein_coding | tolerated(0.33) | benign(0.003) | TCGA-BH-A0HF-01 | Breast | breast invasive carcinoma | Female | >=65 | I/II | Hormone Therapy | arimidex | SD |
| ENTPD7 | SNV | Missense_Mutation | | c.1377N>G | p.Phe459Leu | p.F459L | Q9NQZ7 | protein_coding | tolerated(0.1) | benign(0.05) | TCGA-D8-A1JA-01 | Breast | breast invasive carcinoma | Female | <65 | III/IV | Chemotherapy | adriamycin | PD |
| ENTPD7 | SNV | Missense_Mutation | rs753602972 | c.76C>T | p.Arg26Cys | p.R26C | Q9NQZ7 | protein_coding | tolerated(0.11) | possibly_damaging(0.871) | TCGA-2W-A8YY-01 | Cervix | cervical & endocervical cancer | Female | <65 | I/II | Chemotherapy | cisplatin | CR |
| ENTPD7 | SNV | Missense_Mutation | | c.1662C>G | p.Phe554Leu | p.F554L | Q9NQZ7 | protein_coding | tolerated(0.15) | benign(0.028) | TCGA-DR-A0ZM-01 | Cervix | cervical & endocervical cancer | Female | <65 | III/IV | Unspecific | Cisplatin | SD |
| ENTPD7 | SNV | Missense_Mutation | novel | c.739N>A | p.Ala247Thr | p.A247T | Q9NQZ7 | protein_coding | tolerated(0.54) | benign(0.014) | TCGA-VS-A958-01 | Cervix | cervical & endocervical cancer | Female | <65 | I/II | Chemotherapy | cisplatin | CR |


