
|
|||||
|
 | |
| |
| |
| |
| |
| |
|
Gene: ENTPD6 |
Gene summary for ENTPD6 |
| Gene information | Species | Human | Gene symbol | ENTPD6 | Gene ID | 955 |
| Gene name | ectonucleoside triphosphate diphosphohydrolase 6 | |
| Gene Alias | CD39L2 | |
| Cytomap | 20p11.21 | |
| Gene Type | protein-coding | GO ID | GO:0006139 | UniProtAcc | O75354 |
Top |
Malignant transformation analysis |
| Identification of the aberrant gene expression in precancerous and cancerous lesions by comparing the gene expression of stem-like cells in diseased tissues with normal stem cells |
| Entrez ID | Symbol | Replicates | Species | Organ | Tissue | Adj P-value | Log2FC | Malignancy |
| 955 | ENTPD6 | LZE2T | Human | Esophagus | ESCC | 2.33e-03 | 5.41e-01 | 0.082 |
| 955 | ENTPD6 | LZE4T | Human | Esophagus | ESCC | 1.75e-03 | 1.97e-01 | 0.0811 |
| 955 | ENTPD6 | LZE5T | Human | Esophagus | ESCC | 1.06e-02 | 1.11e-01 | 0.0514 |
| 955 | ENTPD6 | LZE7T | Human | Esophagus | ESCC | 1.21e-10 | 3.50e-01 | 0.0667 |
| 955 | ENTPD6 | LZE20T | Human | Esophagus | ESCC | 5.36e-03 | 9.71e-02 | 0.0662 |
| 955 | ENTPD6 | LZE22T | Human | Esophagus | ESCC | 1.15e-06 | 3.30e-01 | 0.068 |
| 955 | ENTPD6 | LZE24T | Human | Esophagus | ESCC | 1.57e-06 | 2.62e-01 | 0.0596 |
| 955 | ENTPD6 | LZE21T | Human | Esophagus | ESCC | 6.73e-08 | 3.18e-01 | 0.0655 |
| 955 | ENTPD6 | P1T-E | Human | Esophagus | ESCC | 6.52e-09 | 3.68e-01 | 0.0875 |
| 955 | ENTPD6 | P2T-E | Human | Esophagus | ESCC | 1.03e-41 | 7.77e-01 | 0.1177 |
| 955 | ENTPD6 | P4T-E | Human | Esophagus | ESCC | 7.32e-18 | 2.76e-01 | 0.1323 |
| 955 | ENTPD6 | P5T-E | Human | Esophagus | ESCC | 4.42e-12 | 8.92e-02 | 0.1327 |
| 955 | ENTPD6 | P8T-E | Human | Esophagus | ESCC | 1.06e-15 | 1.74e-01 | 0.0889 |
| 955 | ENTPD6 | P9T-E | Human | Esophagus | ESCC | 1.55e-11 | 2.21e-01 | 0.1131 |
| 955 | ENTPD6 | P10T-E | Human | Esophagus | ESCC | 2.65e-52 | 1.00e+00 | 0.116 |
| 955 | ENTPD6 | P11T-E | Human | Esophagus | ESCC | 8.91e-12 | 5.52e-01 | 0.1426 |
| 955 | ENTPD6 | P12T-E | Human | Esophagus | ESCC | 2.81e-32 | 8.43e-01 | 0.1122 |
| 955 | ENTPD6 | P15T-E | Human | Esophagus | ESCC | 5.36e-21 | 3.84e-01 | 0.1149 |
| 955 | ENTPD6 | P16T-E | Human | Esophagus | ESCC | 1.96e-50 | 1.01e+00 | 0.1153 |
| 955 | ENTPD6 | P17T-E | Human | Esophagus | ESCC | 5.69e-07 | 3.72e-01 | 0.1278 |
| Page: 1 2 3 4 5 6 |
| Tissue | Expression Dynamics | Abbreviation |
| Esophagus |  | ESCC: Esophageal squamous cell carcinoma |
| HGIN: High-grade intraepithelial neoplasias | ||
| LGIN: Low-grade intraepithelial neoplasias | ||
| Liver | 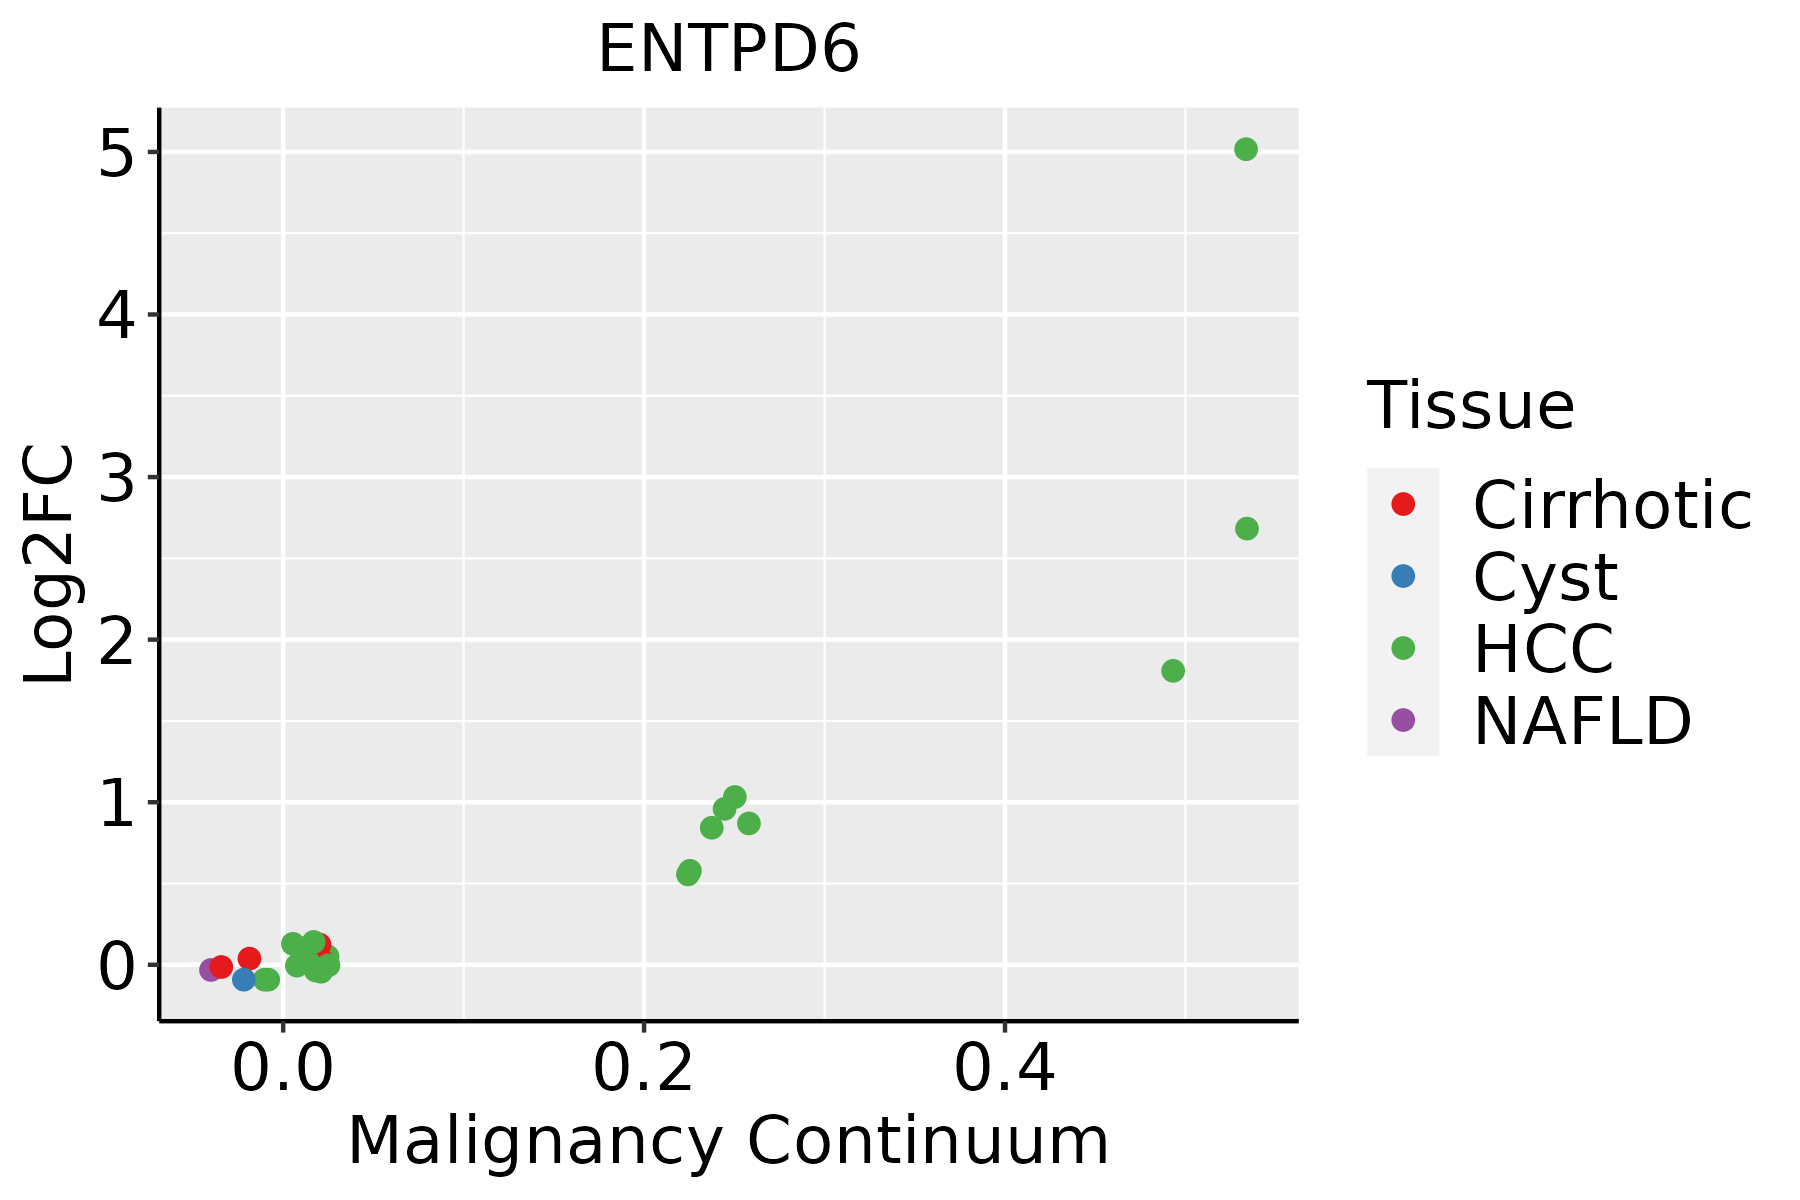 | HCC: Hepatocellular carcinoma |
| NAFLD: Non-alcoholic fatty liver disease | ||
| Oral Cavity | 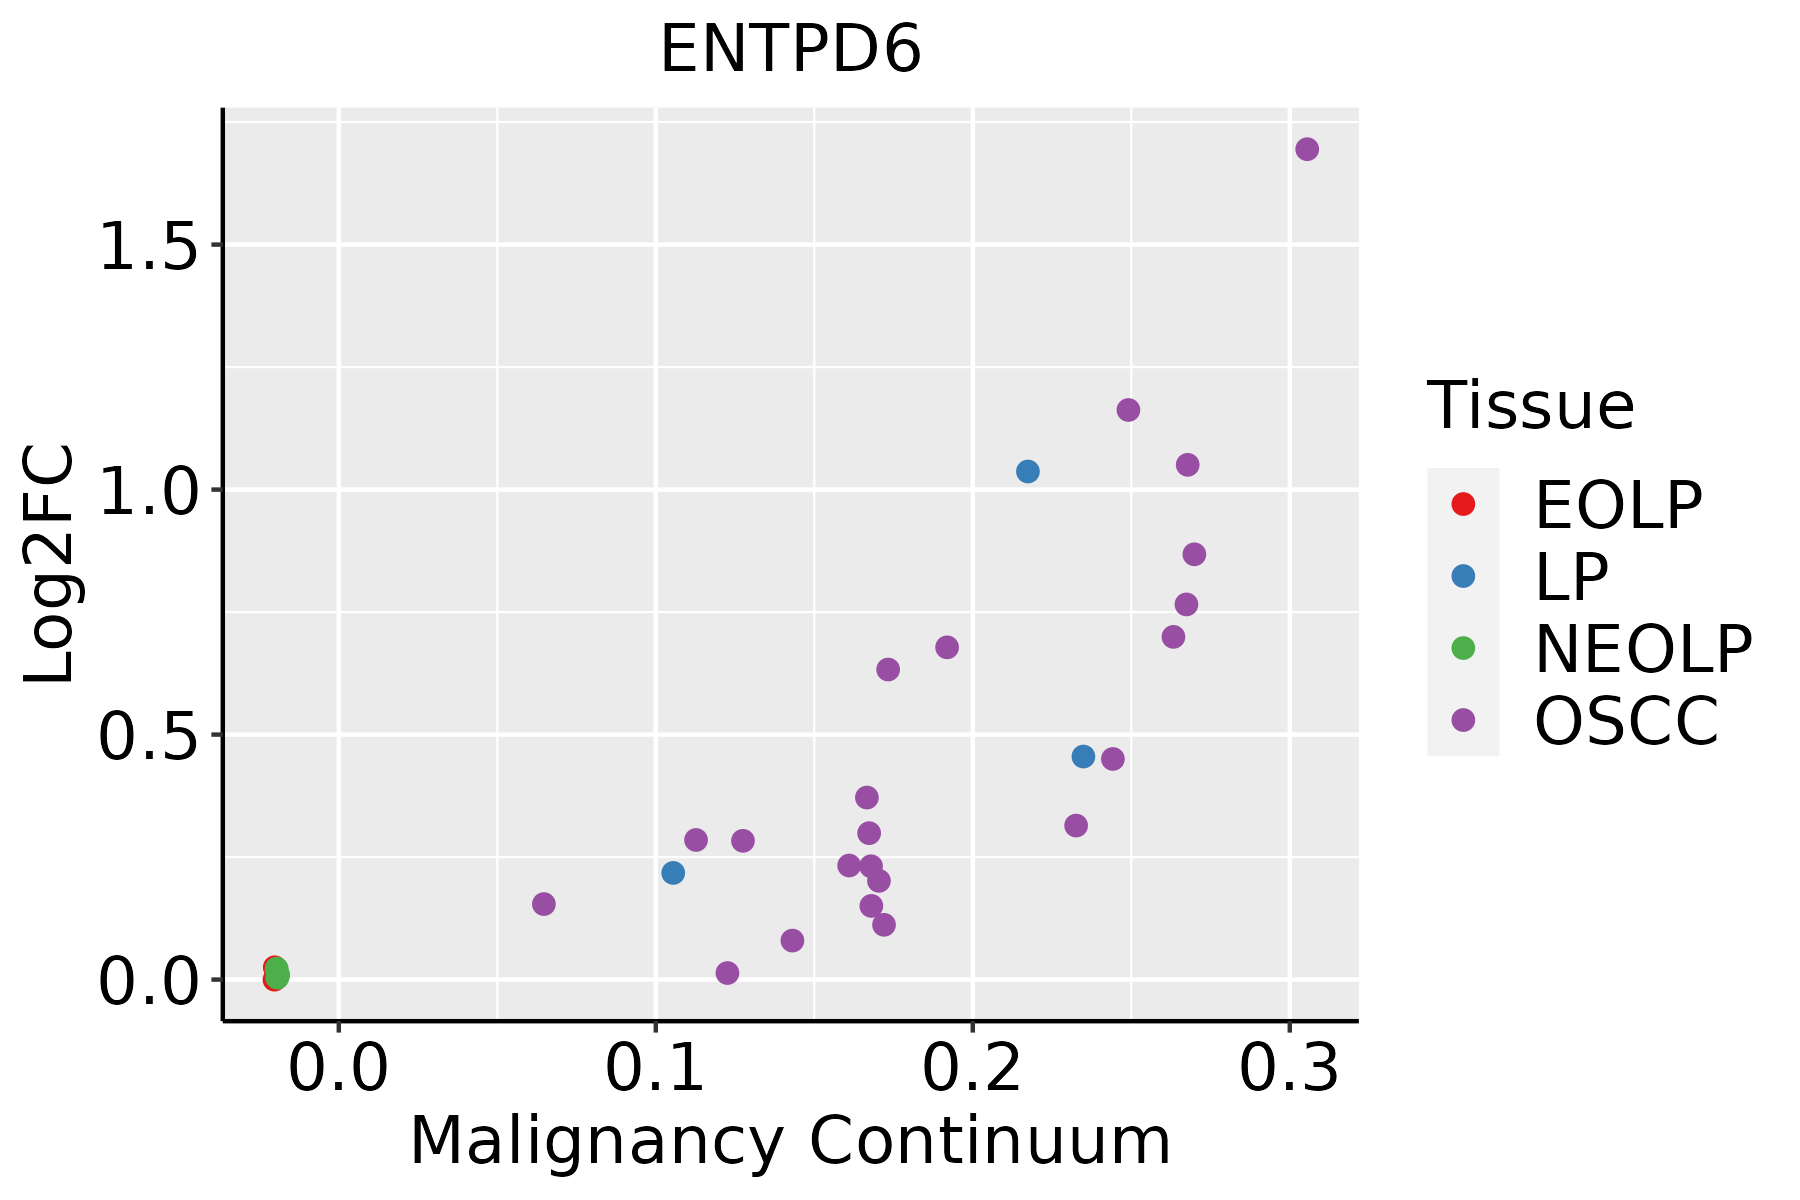 | EOLP: Erosive Oral lichen planus |
| LP: leukoplakia | ||
| NEOLP: Non-erosive oral lichen planus | ||
| OSCC: Oral squamous cell carcinoma | ||
| Prostate | 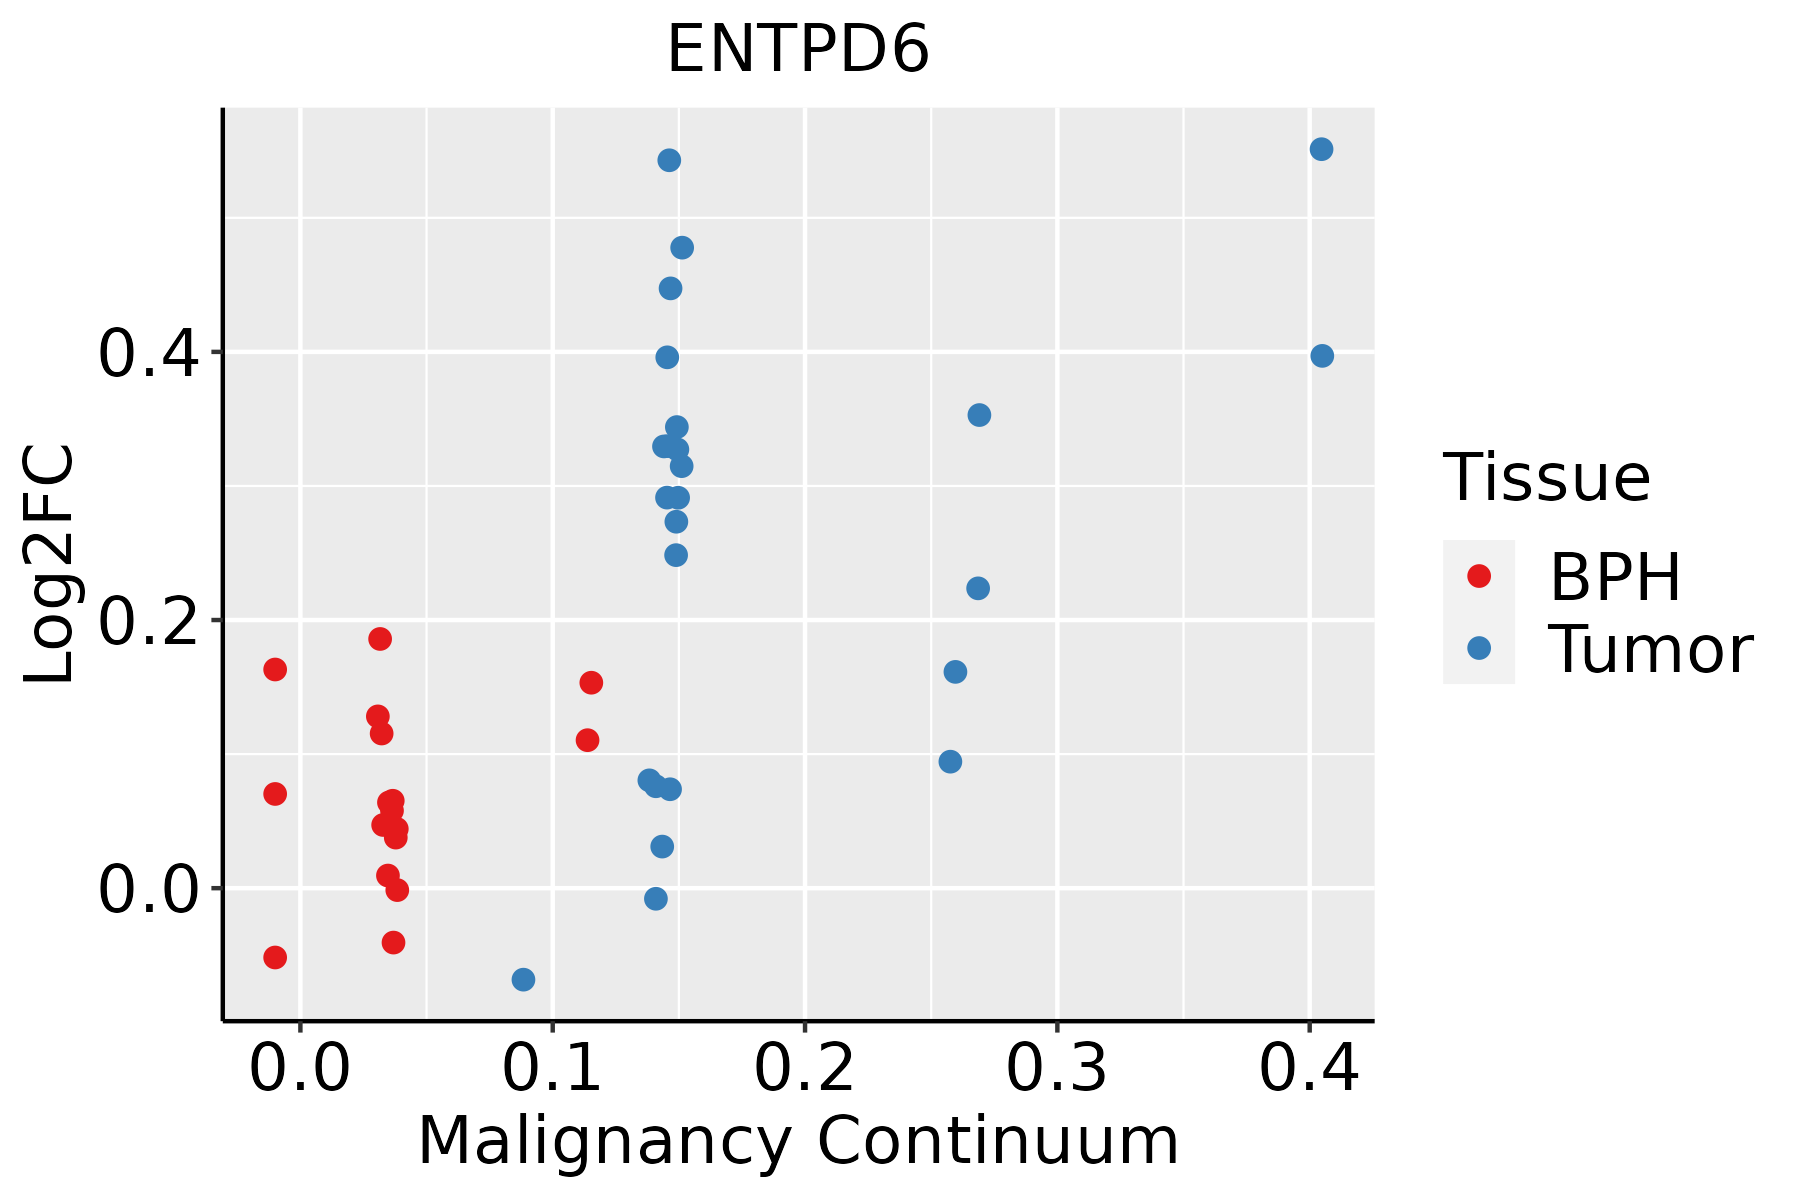 | BPH: Benign Prostatic Hyperplasia |
| Skin | 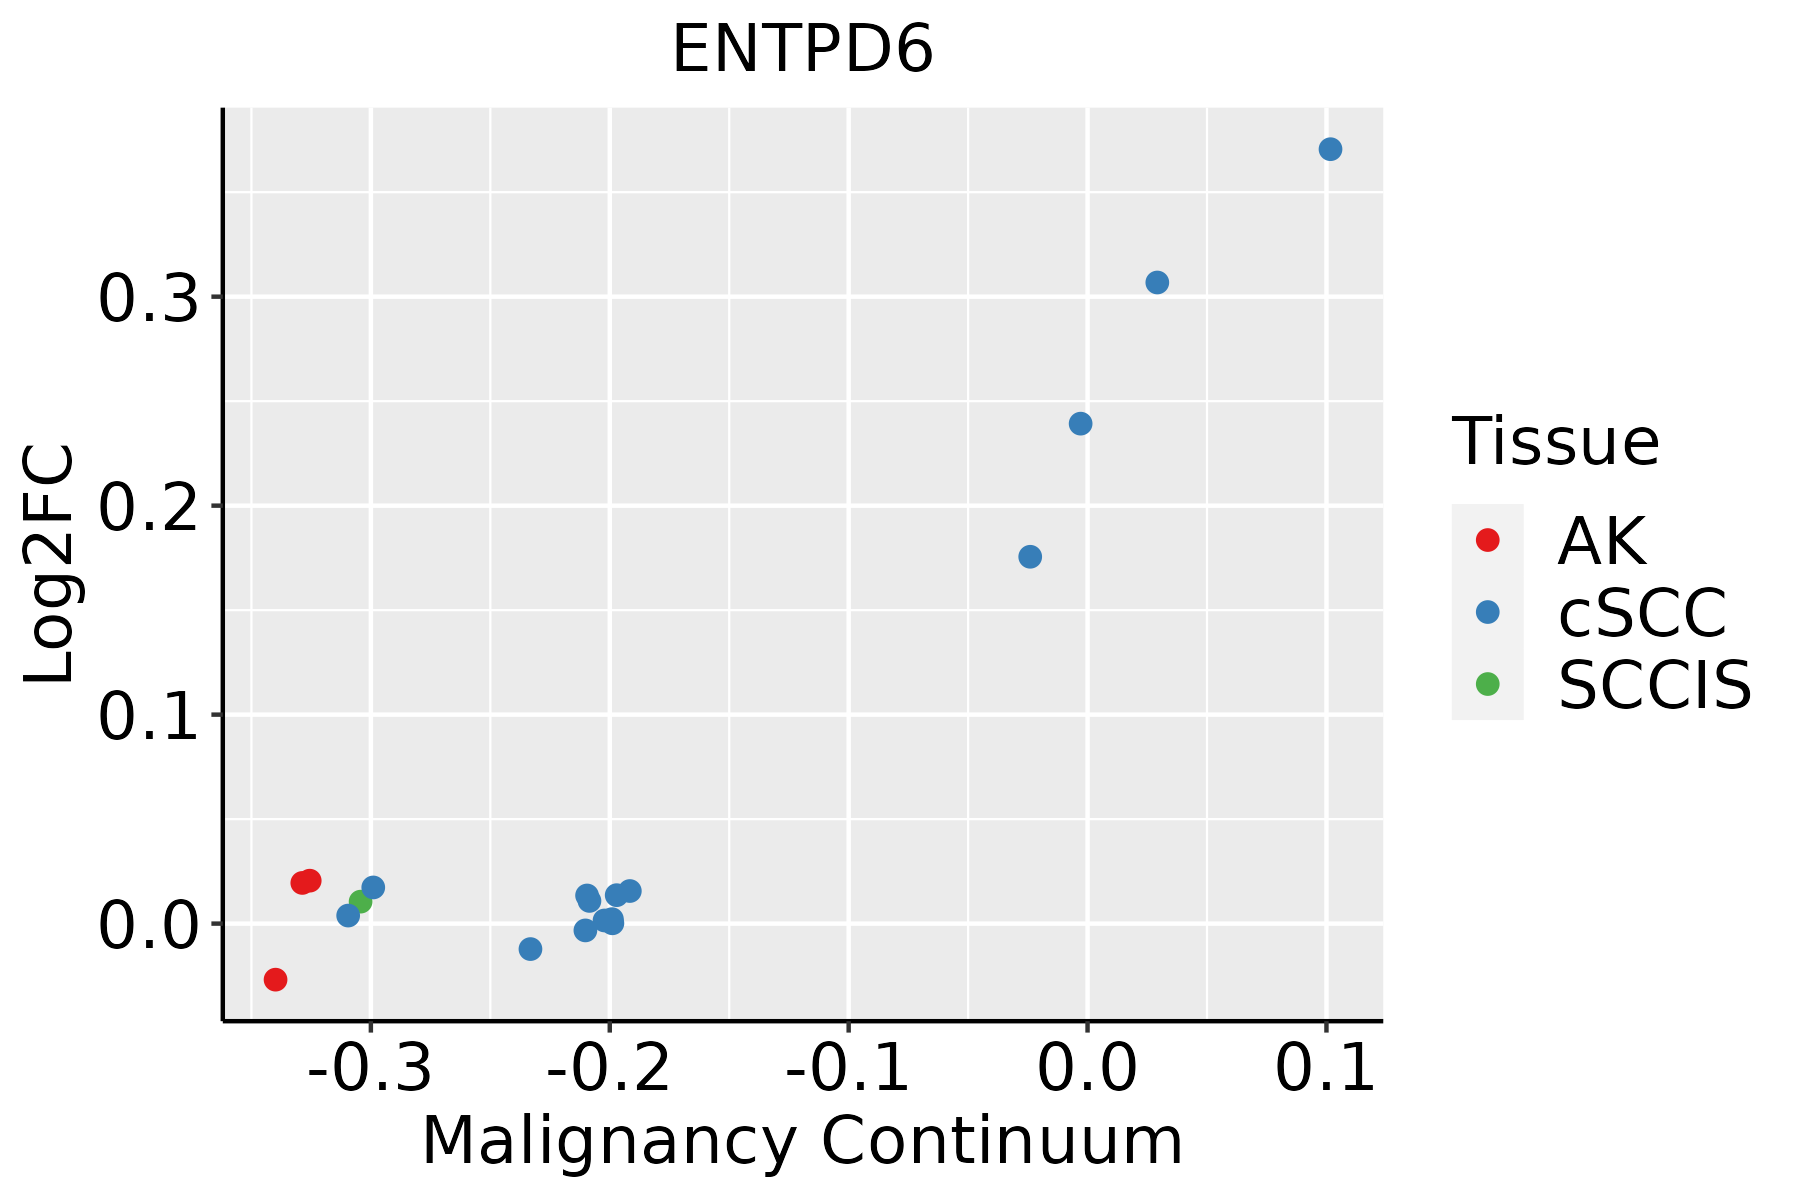 | AK: Actinic keratosis |
| cSCC: Cutaneous squamous cell carcinoma | ||
| SCCIS:squamous cell carcinoma in situ | ||
| Thyroid | 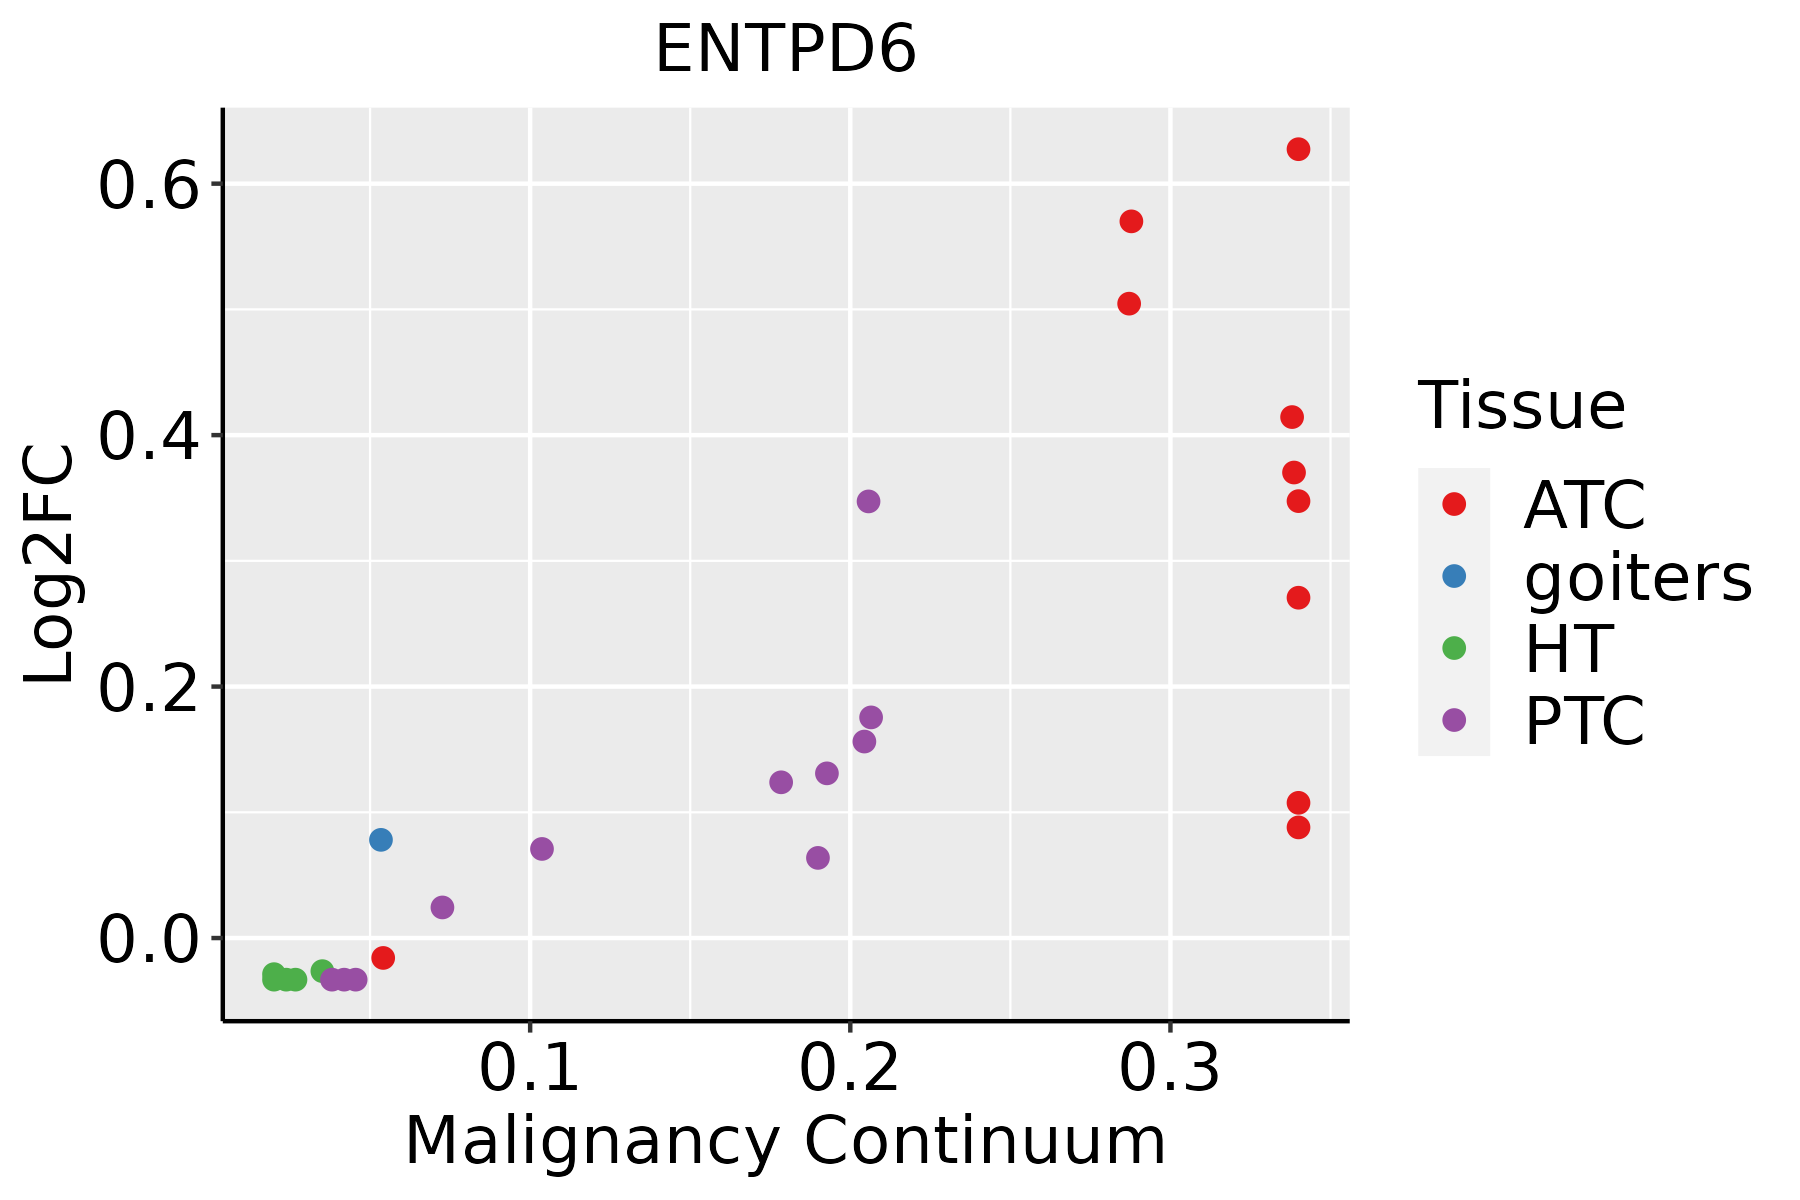 | ATC: Anaplastic thyroid cancer |
| HT: Hashimoto's thyroiditis | ||
| PTC: Papillary thyroid cancer |
| ∗log2FC in expression of this searched gene in stem-like cells from each diseased tissue sample relative to stem-like cells in normal samples in each tissue plotted against the malignancy continuum. Samples are colored based on if they are from different disease stage. |
Top |
Malignant transformation related pathway analysis |
| Find out the enriched GO biological processes and KEGG pathways involved in transition from healthy to precancer to cancer |
| Tissue | Disease Stage | Enriched GO biological Processes |
| Colorectum | AD |  |
| Colorectum | SER |  |
| Colorectum | MSS |  |
| Colorectum | MSI-H |  |
| Colorectum | FAP |  |
| ∗Top 15 enriched GO BP terms are showed in the bar plot of each disease state in each tissue. Each row represents a significant GO biological process which is colored according to the -log10(p.adjust). |
| Page: 1 2 3 4 5 6 7 8 9 |
| GO ID | Tissue | Disease Stage | Description | Gene Ratio | Bg Ratio | pvalue | p.adjust | Count |
| GO:0034655110 | Esophagus | ESCC | nucleobase-containing compound catabolic process | 272/8552 | 407/18723 | 2.92e-18 | 2.90e-16 | 272 |
| GO:004670018 | Esophagus | ESCC | heterocycle catabolic process | 286/8552 | 445/18723 | 1.12e-15 | 7.47e-14 | 286 |
| GO:004427019 | Esophagus | ESCC | cellular nitrogen compound catabolic process | 288/8552 | 451/18723 | 3.03e-15 | 1.79e-13 | 288 |
| GO:001943918 | Esophagus | ESCC | aromatic compound catabolic process | 295/8552 | 467/18723 | 1.09e-14 | 5.98e-13 | 295 |
| GO:190136118 | Esophagus | ESCC | organic cyclic compound catabolic process | 307/8552 | 495/18723 | 9.99e-14 | 4.80e-12 | 307 |
| GO:001631110 | Esophagus | ESCC | dephosphorylation | 251/8552 | 417/18723 | 1.26e-09 | 2.99e-08 | 251 |
| GO:0006753110 | Esophagus | ESCC | nucleoside phosphate metabolic process | 288/8552 | 497/18723 | 1.80e-08 | 3.50e-07 | 288 |
| GO:001003827 | Esophagus | ESCC | response to metal ion | 208/8552 | 373/18723 | 5.02e-05 | 3.90e-04 | 208 |
| GO:000913219 | Esophagus | ESCC | nucleoside diphosphate metabolic process | 77/8552 | 124/18723 | 1.65e-04 | 1.09e-03 | 77 |
| GO:190136111 | Liver | Cirrhotic | organic cyclic compound catabolic process | 213/4634 | 495/18723 | 1.58e-19 | 3.67e-17 | 213 |
| GO:001943911 | Liver | Cirrhotic | aromatic compound catabolic process | 202/4634 | 467/18723 | 6.93e-19 | 1.28e-16 | 202 |
| GO:004427011 | Liver | Cirrhotic | cellular nitrogen compound catabolic process | 195/4634 | 451/18723 | 2.99e-18 | 4.94e-16 | 195 |
| GO:004670011 | Liver | Cirrhotic | heterocycle catabolic process | 192/4634 | 445/18723 | 7.17e-18 | 1.12e-15 | 192 |
| GO:003465511 | Liver | Cirrhotic | nucleobase-containing compound catabolic process | 171/4634 | 407/18723 | 9.07e-15 | 9.33e-13 | 171 |
| GO:000675312 | Liver | Cirrhotic | nucleoside phosphate metabolic process | 190/4634 | 497/18723 | 1.10e-11 | 6.96e-10 | 190 |
| GO:001003812 | Liver | Cirrhotic | response to metal ion | 150/4634 | 373/18723 | 2.27e-11 | 1.37e-09 | 150 |
| GO:000913212 | Liver | Cirrhotic | nucleoside diphosphate metabolic process | 58/4634 | 124/18723 | 7.88e-08 | 2.33e-06 | 58 |
| GO:005159211 | Liver | Cirrhotic | response to calcium ion | 61/4634 | 149/18723 | 9.47e-06 | 1.38e-04 | 61 |
| GO:1901292 | Liver | Cirrhotic | nucleoside phosphate catabolic process | 36/4634 | 83/18723 | 1.54e-04 | 1.47e-03 | 36 |
| GO:001631111 | Liver | Cirrhotic | dephosphorylation | 130/4634 | 417/18723 | 1.58e-03 | 1.03e-02 | 130 |
| Page: 1 2 3 4 5 |
| Pathway ID | Tissue | Disease Stage | Description | Gene Ratio | Bg Ratio | pvalue | p.adjust | qvalue | Count |
| hsa012325 | Esophagus | ESCC | Nucleotide metabolism | 59/4205 | 85/8465 | 1.67e-04 | 6.58e-04 | 3.37e-04 | 59 |
| hsa002405 | Esophagus | ESCC | Pyrimidine metabolism | 41/4205 | 58/8465 | 9.14e-04 | 2.92e-03 | 1.49e-03 | 41 |
| hsa0123212 | Esophagus | ESCC | Nucleotide metabolism | 59/4205 | 85/8465 | 1.67e-04 | 6.58e-04 | 3.37e-04 | 59 |
| hsa0024012 | Esophagus | ESCC | Pyrimidine metabolism | 41/4205 | 58/8465 | 9.14e-04 | 2.92e-03 | 1.49e-03 | 41 |
| hsa01232 | Liver | Cirrhotic | Nucleotide metabolism | 39/2530 | 85/8465 | 1.27e-03 | 6.73e-03 | 4.15e-03 | 39 |
| hsa00240 | Liver | Cirrhotic | Pyrimidine metabolism | 27/2530 | 58/8465 | 5.31e-03 | 1.88e-02 | 1.16e-02 | 27 |
| hsa012321 | Liver | Cirrhotic | Nucleotide metabolism | 39/2530 | 85/8465 | 1.27e-03 | 6.73e-03 | 4.15e-03 | 39 |
| hsa002401 | Liver | Cirrhotic | Pyrimidine metabolism | 27/2530 | 58/8465 | 5.31e-03 | 1.88e-02 | 1.16e-02 | 27 |
| hsa002402 | Liver | HCC | Pyrimidine metabolism | 44/4020 | 58/8465 | 9.34e-06 | 7.11e-05 | 3.95e-05 | 44 |
| hsa012322 | Liver | HCC | Nucleotide metabolism | 59/4020 | 85/8465 | 3.30e-05 | 1.88e-04 | 1.04e-04 | 59 |
| hsa002403 | Liver | HCC | Pyrimidine metabolism | 44/4020 | 58/8465 | 9.34e-06 | 7.11e-05 | 3.95e-05 | 44 |
| hsa012323 | Liver | HCC | Nucleotide metabolism | 59/4020 | 85/8465 | 3.30e-05 | 1.88e-04 | 1.04e-04 | 59 |
| hsa012324 | Oral cavity | OSCC | Nucleotide metabolism | 54/3704 | 85/8465 | 1.78e-04 | 5.95e-04 | 3.03e-04 | 54 |
| hsa002404 | Oral cavity | OSCC | Pyrimidine metabolism | 37/3704 | 58/8465 | 1.62e-03 | 4.45e-03 | 2.26e-03 | 37 |
| hsa0123211 | Oral cavity | OSCC | Nucleotide metabolism | 54/3704 | 85/8465 | 1.78e-04 | 5.95e-04 | 3.03e-04 | 54 |
| hsa0024011 | Oral cavity | OSCC | Pyrimidine metabolism | 37/3704 | 58/8465 | 1.62e-03 | 4.45e-03 | 2.26e-03 | 37 |
| hsa0123221 | Oral cavity | LP | Nucleotide metabolism | 42/2418 | 85/8465 | 3.62e-05 | 2.36e-04 | 1.52e-04 | 42 |
| hsa0024021 | Oral cavity | LP | Pyrimidine metabolism | 28/2418 | 58/8465 | 1.12e-03 | 5.02e-03 | 3.24e-03 | 28 |
| hsa0123231 | Oral cavity | LP | Nucleotide metabolism | 42/2418 | 85/8465 | 3.62e-05 | 2.36e-04 | 1.52e-04 | 42 |
| hsa0024031 | Oral cavity | LP | Pyrimidine metabolism | 28/2418 | 58/8465 | 1.12e-03 | 5.02e-03 | 3.24e-03 | 28 |
| Page: 1 |
Top |
Cell-cell communication analysis |
| Identification of potential cell-cell interactions between two cell types and their ligand-receptor pairs for different disease states |
| Ligand | Receptor | LRpair | Pathway | Tissue | Disease Stage |
| Page: 1 |
Top |
Single-cell gene regulatory network inference analysis |
| Find out the significant the regulons (TFs) and the target genes of each regulon across cell types for different disease states |
| TF | Cell Type | Tissue | Disease Stage | Target Gene | RSS | Regulon Activity |
| ∗The dot plots of a searched regulon are shown for all cell subpopulations in each disease state of each tissue based on the regulon specific score inferred using pySCENIC and by calculating the average expression. |
| Page: 1 |
Top |
Somatic mutation of malignant transformation related genes |
| Annotation of somatic variants for genes involved in malignant transformation |
| Hugo Symbol | Variant Class | Variant Classification | dbSNP RS | HGVSc | HGVSp | HGVSp Short | SWISSPROT | BIOTYPE | SIFT | PolyPhen | Tumor Sample Barcode | Tissue | Histology | Sex | Age | Stage | Therapy Types | Drugs | Outcome |
| ENTPD6 | SNV | Missense_Mutation | rs777289378 | c.680N>T | p.Ser227Leu | p.S227L | O75354 | protein_coding | tolerated(1) | probably_damaging(0.975) | TCGA-AN-A046-01 | Breast | breast invasive carcinoma | Female | >=65 | I/II | Unknown | Unknown | SD |
| ENTPD6 | SNV | Missense_Mutation | rs145110271 | c.841N>T | p.Arg281Trp | p.R281W | O75354 | protein_coding | deleterious(0) | probably_damaging(0.912) | TCGA-AN-A046-01 | Breast | breast invasive carcinoma | Female | >=65 | I/II | Unknown | Unknown | SD |
| ENTPD6 | SNV | Missense_Mutation | c.1264N>G | p.Gln422Glu | p.Q422E | O75354 | protein_coding | tolerated(1) | benign(0.003) | TCGA-EW-A1J6-01 | Breast | breast invasive carcinoma | Female | >=65 | I/II | Hormone Therapy | femara | SD | |
| ENTPD6 | SNV | Missense_Mutation | novel | c.1082C>T | p.Ser361Leu | p.S361L | O75354 | protein_coding | tolerated(0.35) | benign(0.015) | TCGA-C5-A1ML-01 | Cervix | cervical & endocervical cancer | Female | <65 | I/II | Unknown | Unknown | PD |
| ENTPD6 | SNV | Missense_Mutation | c.569N>A | p.Gly190Glu | p.G190E | O75354 | protein_coding | tolerated(0.73) | possibly_damaging(0.463) | TCGA-VS-A8EL-01 | Cervix | cervical & endocervical cancer | Female | <65 | I/II | Chemotherapy | cisplatin | CR | |
| ENTPD6 | SNV | Missense_Mutation | rs145110271 | c.841N>T | p.Arg281Trp | p.R281W | O75354 | protein_coding | deleterious(0) | probably_damaging(0.912) | TCGA-A6-6780-01 | Colorectum | colon adenocarcinoma | Male | >=65 | I/II | Unknown | Unknown | SD |
| ENTPD6 | SNV | Missense_Mutation | novel | c.1156N>C | p.Tyr386His | p.Y386H | O75354 | protein_coding | deleterious(0.03) | probably_damaging(0.998) | TCGA-AZ-4315-01 | Colorectum | colon adenocarcinoma | Male | <65 | I/II | Unknown | Unknown | SD |
| ENTPD6 | SNV | Missense_Mutation | novel | c.1368N>C | p.Lys456Asn | p.K456N | O75354 | protein_coding | deleterious(0) | probably_damaging(0.976) | TCGA-CA-6717-01 | Colorectum | colon adenocarcinoma | Male | <65 | I/II | Chemotherapy | oxaliplatin | CR |
| ENTPD6 | SNV | Missense_Mutation | c.1000N>C | p.Trp334Arg | p.W334R | O75354 | protein_coding | deleterious(0) | probably_damaging(0.959) | TCGA-G4-6588-01 | Colorectum | colon adenocarcinoma | Female | <65 | I/II | Unknown | Unknown | SD | |
| ENTPD6 | SNV | Missense_Mutation | rs376852747 | c.1420N>A | p.Asp474Asn | p.D474N | O75354 | protein_coding | tolerated(0.15) | benign(0.37) | TCGA-G4-6627-01 | Colorectum | colon adenocarcinoma | Male | >=65 | I/II | Unknown | Unknown | PD |
| Page: 1 2 3 4 5 6 |
Top |
Related drugs of malignant transformation related genes |
| Identification of chemicals and drugs interact with genes involved in malignant transfromation |
| (DGIdb 4.0) |
| Entrez ID | Symbol | Category | Interaction Types | Drug Claim Name | Drug Name | PMIDs |
| Page: 1 |

Copyright 2023-Present -The University of Texas Health Science Center at Houston |