
|
|||||
|
 | |
| |
| |
| |
| |
| |
|
Gene: ENTPD5 |
Gene summary for ENTPD5 |
| Gene information | Species | Human | Gene symbol | ENTPD5 | Gene ID | 957 |
| Gene name | ectonucleoside triphosphate diphosphohydrolase 5 (inactive) | |
| Gene Alias | CD39L4 | |
| Cytomap | 14q24.3 | |
| Gene Type | protein-coding | GO ID | GO:0005975 | UniProtAcc | A0A024R6D3 |
Top |
Malignant transformation analysis |
| Identification of the aberrant gene expression in precancerous and cancerous lesions by comparing the gene expression of stem-like cells in diseased tissues with normal stem cells |
| Entrez ID | Symbol | Replicates | Species | Organ | Tissue | Adj P-value | Log2FC | Malignancy |
| 957 | ENTPD5 | HTA11_3410_2000001011 | Human | Colorectum | AD | 5.15e-09 | -4.60e-01 | 0.0155 |
| 957 | ENTPD5 | HTA11_347_2000001011 | Human | Colorectum | AD | 3.69e-10 | 5.71e-01 | -0.1954 |
| 957 | ENTPD5 | HTA11_866_3004761011 | Human | Colorectum | AD | 4.88e-07 | -4.30e-01 | 0.096 |
| 957 | ENTPD5 | HTA11_7696_3000711011 | Human | Colorectum | AD | 4.03e-02 | -2.66e-01 | 0.0674 |
| 957 | ENTPD5 | HTA11_6818_2000001021 | Human | Colorectum | AD | 1.61e-05 | -5.64e-01 | 0.0588 |
| 957 | ENTPD5 | HTA11_99999970781_79442 | Human | Colorectum | MSS | 7.26e-17 | -5.12e-01 | 0.294 |
| 957 | ENTPD5 | HTA11_99999965104_69814 | Human | Colorectum | MSS | 4.43e-04 | -5.01e-01 | 0.281 |
| 957 | ENTPD5 | HTA11_99999971662_82457 | Human | Colorectum | MSS | 1.33e-17 | -5.06e-01 | 0.3859 |
| 957 | ENTPD5 | HTA11_99999973899_84307 | Human | Colorectum | MSS | 2.19e-03 | -5.48e-01 | 0.2585 |
| 957 | ENTPD5 | HTA11_99999974143_84620 | Human | Colorectum | MSS | 1.96e-22 | -5.54e-01 | 0.3005 |
| 957 | ENTPD5 | F007 | Human | Colorectum | FAP | 2.12e-02 | -2.97e-01 | 0.1176 |
| 957 | ENTPD5 | A002-C-010 | Human | Colorectum | FAP | 2.02e-03 | -2.40e-01 | 0.242 |
| 957 | ENTPD5 | A001-C-207 | Human | Colorectum | FAP | 2.23e-04 | -3.93e-01 | 0.1278 |
| 957 | ENTPD5 | A015-C-203 | Human | Colorectum | FAP | 3.03e-24 | -4.65e-01 | -0.1294 |
| 957 | ENTPD5 | A015-C-204 | Human | Colorectum | FAP | 2.23e-06 | -3.14e-01 | -0.0228 |
| 957 | ENTPD5 | A014-C-040 | Human | Colorectum | FAP | 1.84e-03 | -4.17e-01 | -0.1184 |
| 957 | ENTPD5 | A002-C-201 | Human | Colorectum | FAP | 4.29e-13 | -4.38e-01 | 0.0324 |
| 957 | ENTPD5 | A002-C-203 | Human | Colorectum | FAP | 6.02e-08 | -2.96e-01 | 0.2786 |
| 957 | ENTPD5 | A001-C-119 | Human | Colorectum | FAP | 1.54e-11 | -5.33e-01 | -0.1557 |
| 957 | ENTPD5 | A001-C-108 | Human | Colorectum | FAP | 5.23e-19 | -3.84e-01 | -0.0272 |
| Page: 1 2 3 4 5 6 |
| Tissue | Expression Dynamics | Abbreviation |
| Colorectum (GSE201348) |  | FAP: Familial adenomatous polyposis |
| CRC: Colorectal cancer | ||
| Colorectum (HTA11) |  | AD: Adenomas |
| SER: Sessile serrated lesions | ||
| MSI-H: Microsatellite-high colorectal cancer | ||
| MSS: Microsatellite stable colorectal cancer | ||
| Esophagus |  | ESCC: Esophageal squamous cell carcinoma |
| HGIN: High-grade intraepithelial neoplasias | ||
| LGIN: Low-grade intraepithelial neoplasias | ||
| Liver | 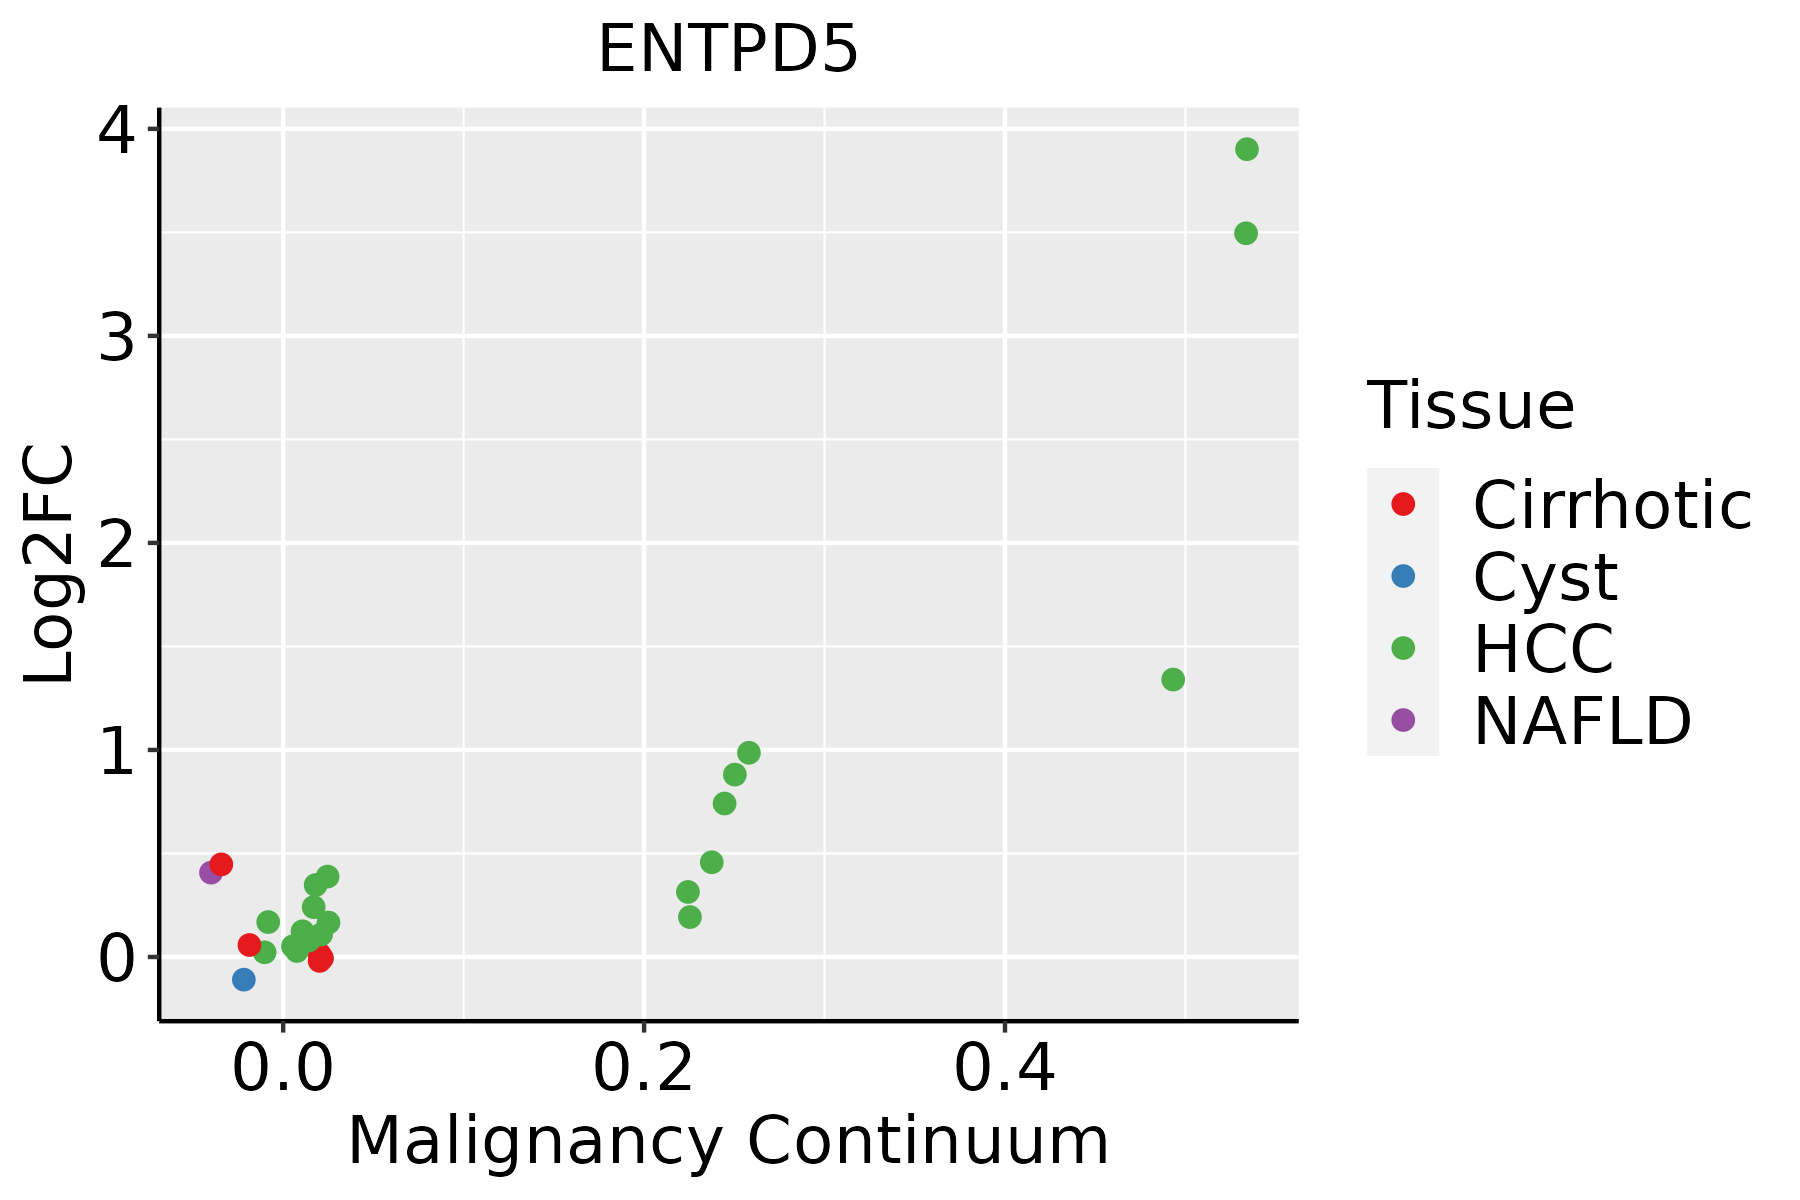 | HCC: Hepatocellular carcinoma |
| NAFLD: Non-alcoholic fatty liver disease | ||
| Prostate | 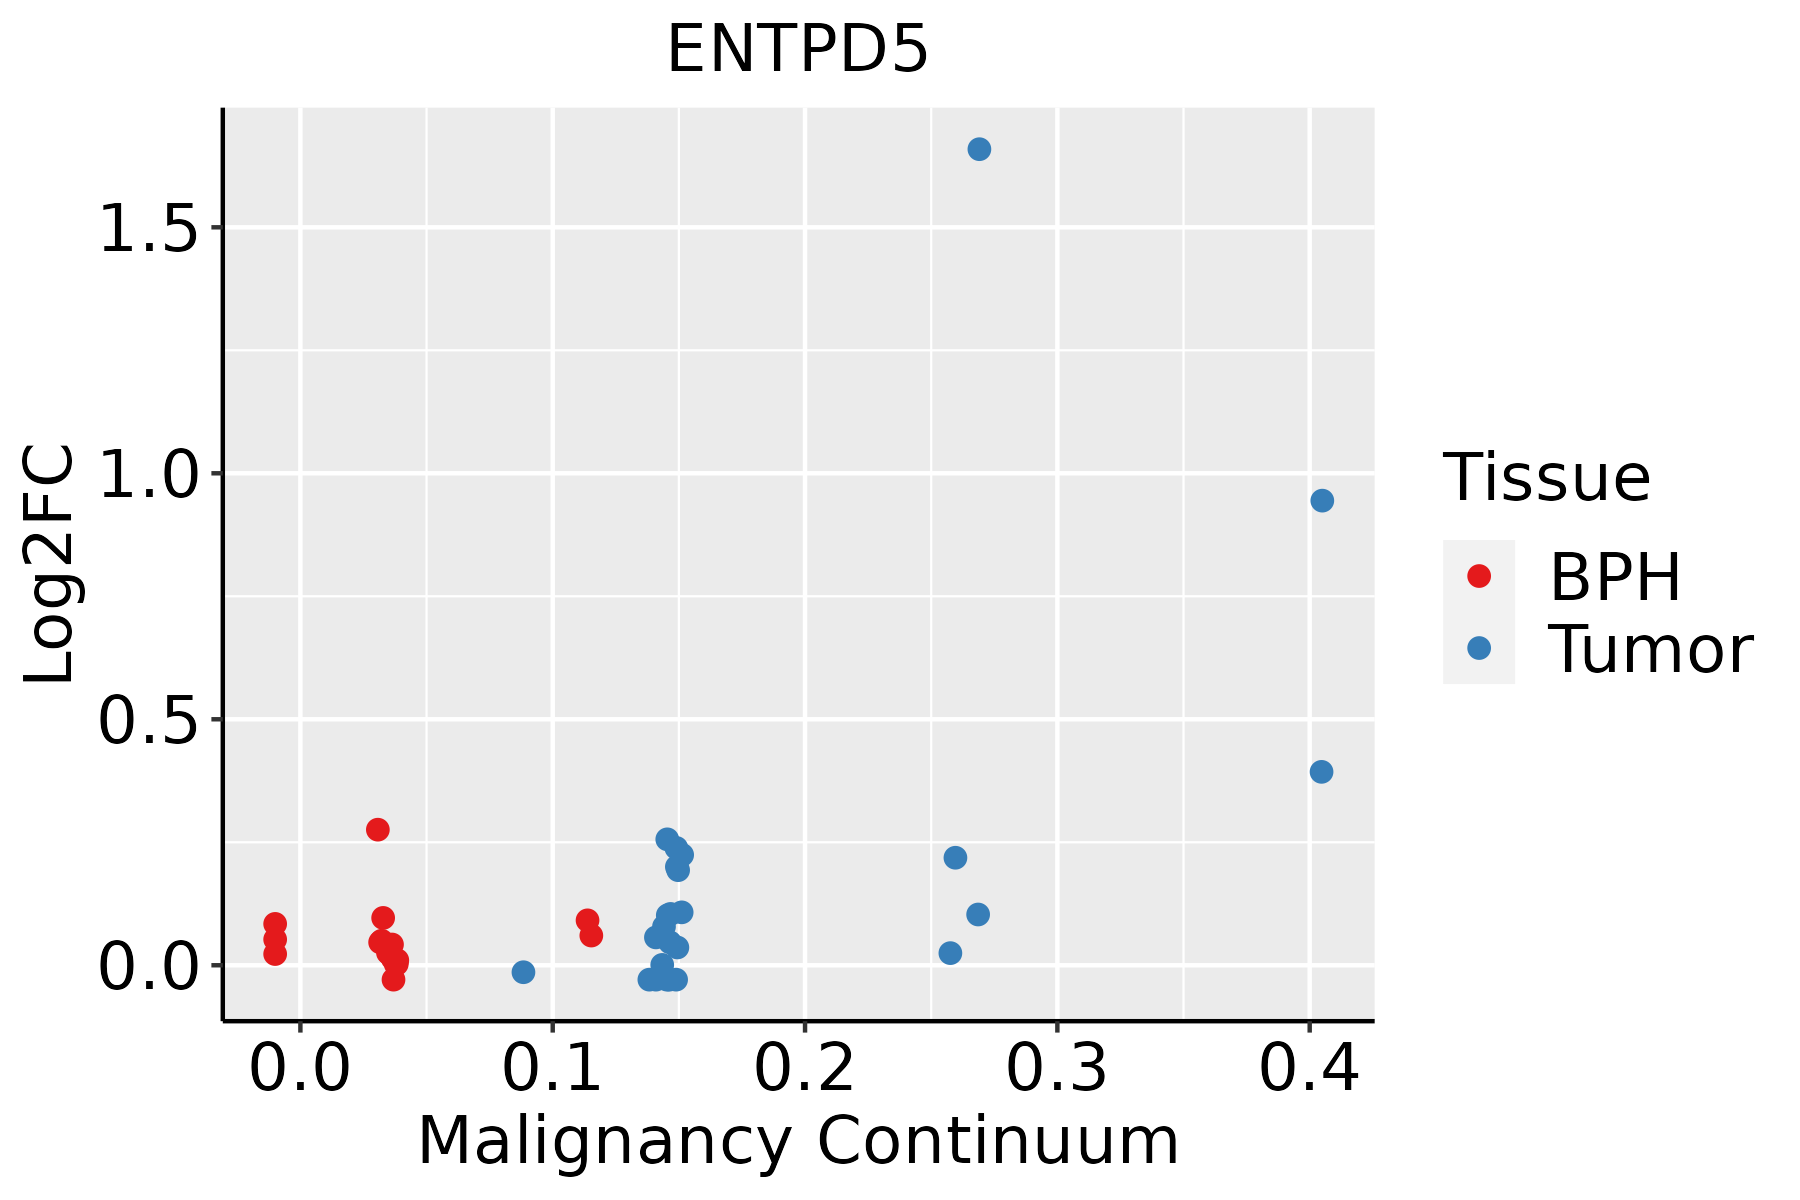 | BPH: Benign Prostatic Hyperplasia |
| ∗log2FC in expression of this searched gene in stem-like cells from each diseased tissue sample relative to stem-like cells in normal samples in each tissue plotted against the malignancy continuum. Samples are colored based on if they are from different disease stage. |
Top |
Malignant transformation related pathway analysis |
| Find out the enriched GO biological processes and KEGG pathways involved in transition from healthy to precancer to cancer |
| Tissue | Disease Stage | Enriched GO biological Processes |
| Colorectum | AD |  |
| Colorectum | SER |  |
| Colorectum | MSS |  |
| Colorectum | MSI-H |  |
| Colorectum | FAP |  |
| ∗Top 15 enriched GO BP terms are showed in the bar plot of each disease state in each tissue. Each row represents a significant GO biological process which is colored according to the -log10(p.adjust). |
| Page: 1 2 3 4 5 6 7 8 9 |
| GO ID | Tissue | Disease Stage | Description | Gene Ratio | Bg Ratio | pvalue | p.adjust | Count |
| GO:0046034 | Colorectum | AD | ATP metabolic process | 142/3918 | 277/18723 | 2.64e-29 | 8.26e-26 | 142 |
| GO:0006091 | Colorectum | AD | generation of precursor metabolites and energy | 209/3918 | 490/18723 | 3.17e-28 | 6.61e-25 | 209 |
| GO:0009896 | Colorectum | AD | positive regulation of catabolic process | 180/3918 | 492/18723 | 4.33e-16 | 1.94e-13 | 180 |
| GO:0009150 | Colorectum | AD | purine ribonucleotide metabolic process | 142/3918 | 368/18723 | 4.29e-15 | 1.17e-12 | 142 |
| GO:0006163 | Colorectum | AD | purine nucleotide metabolic process | 149/3918 | 396/18723 | 1.08e-14 | 2.80e-12 | 149 |
| GO:0072521 | Colorectum | AD | purine-containing compound metabolic process | 153/3918 | 416/18723 | 4.34e-14 | 1.01e-11 | 153 |
| GO:0031331 | Colorectum | AD | positive regulation of cellular catabolic process | 156/3918 | 427/18723 | 4.68e-14 | 1.05e-11 | 156 |
| GO:0009259 | Colorectum | AD | ribonucleotide metabolic process | 144/3918 | 385/18723 | 5.25e-14 | 1.13e-11 | 144 |
| GO:0019693 | Colorectum | AD | ribose phosphate metabolic process | 145/3918 | 396/18723 | 3.01e-13 | 5.71e-11 | 145 |
| GO:0009117 | Colorectum | AD | nucleotide metabolic process | 168/3918 | 489/18723 | 2.20e-12 | 3.36e-10 | 168 |
| GO:0006753 | Colorectum | AD | nucleoside phosphate metabolic process | 169/3918 | 497/18723 | 4.99e-12 | 6.98e-10 | 169 |
| GO:0044270 | Colorectum | AD | cellular nitrogen compound catabolic process | 147/3918 | 451/18723 | 3.35e-09 | 2.23e-07 | 147 |
| GO:0046700 | Colorectum | AD | heterocycle catabolic process | 145/3918 | 445/18723 | 4.37e-09 | 2.84e-07 | 145 |
| GO:0034655 | Colorectum | AD | nucleobase-containing compound catabolic process | 133/3918 | 407/18723 | 1.56e-08 | 9.12e-07 | 133 |
| GO:0009135 | Colorectum | AD | purine nucleoside diphosphate metabolic process | 47/3918 | 103/18723 | 1.61e-08 | 9.22e-07 | 47 |
| GO:0009179 | Colorectum | AD | purine ribonucleoside diphosphate metabolic process | 47/3918 | 103/18723 | 1.61e-08 | 9.22e-07 | 47 |
| GO:0006090 | Colorectum | AD | pyruvate metabolic process | 47/3918 | 106/18723 | 4.85e-08 | 2.55e-06 | 47 |
| GO:0009185 | Colorectum | AD | ribonucleoside diphosphate metabolic process | 47/3918 | 106/18723 | 4.85e-08 | 2.55e-06 | 47 |
| GO:0019439 | Colorectum | AD | aromatic compound catabolic process | 146/3918 | 467/18723 | 7.48e-08 | 3.84e-06 | 146 |
| GO:1901361 | Colorectum | AD | organic cyclic compound catabolic process | 153/3918 | 495/18723 | 8.23e-08 | 4.18e-06 | 153 |
| Page: 1 2 3 4 5 6 7 8 9 10 11 12 13 14 15 16 17 18 19 |
| Pathway ID | Tissue | Disease Stage | Description | Gene Ratio | Bg Ratio | pvalue | p.adjust | qvalue | Count |
| hsa012325 | Esophagus | ESCC | Nucleotide metabolism | 59/4205 | 85/8465 | 1.67e-04 | 6.58e-04 | 3.37e-04 | 59 |
| hsa002405 | Esophagus | ESCC | Pyrimidine metabolism | 41/4205 | 58/8465 | 9.14e-04 | 2.92e-03 | 1.49e-03 | 41 |
| hsa0123212 | Esophagus | ESCC | Nucleotide metabolism | 59/4205 | 85/8465 | 1.67e-04 | 6.58e-04 | 3.37e-04 | 59 |
| hsa0024012 | Esophagus | ESCC | Pyrimidine metabolism | 41/4205 | 58/8465 | 9.14e-04 | 2.92e-03 | 1.49e-03 | 41 |
| hsa002402 | Liver | HCC | Pyrimidine metabolism | 44/4020 | 58/8465 | 9.34e-06 | 7.11e-05 | 3.95e-05 | 44 |
| hsa012322 | Liver | HCC | Nucleotide metabolism | 59/4020 | 85/8465 | 3.30e-05 | 1.88e-04 | 1.04e-04 | 59 |
| hsa002403 | Liver | HCC | Pyrimidine metabolism | 44/4020 | 58/8465 | 9.34e-06 | 7.11e-05 | 3.95e-05 | 44 |
| hsa012323 | Liver | HCC | Nucleotide metabolism | 59/4020 | 85/8465 | 3.30e-05 | 1.88e-04 | 1.04e-04 | 59 |
| Page: 1 |
Top |
Cell-cell communication analysis |
| Identification of potential cell-cell interactions between two cell types and their ligand-receptor pairs for different disease states |
| Ligand | Receptor | LRpair | Pathway | Tissue | Disease Stage |
| Page: 1 |
Top |
Single-cell gene regulatory network inference analysis |
| Find out the significant the regulons (TFs) and the target genes of each regulon across cell types for different disease states |
| TF | Cell Type | Tissue | Disease Stage | Target Gene | RSS | Regulon Activity |
| ∗The dot plots of a searched regulon are shown for all cell subpopulations in each disease state of each tissue based on the regulon specific score inferred using pySCENIC and by calculating the average expression. |
| Page: 1 |
Top |
Somatic mutation of malignant transformation related genes |
| Annotation of somatic variants for genes involved in malignant transformation |
| Hugo Symbol | Variant Class | Variant Classification | dbSNP RS | HGVSc | HGVSp | HGVSp Short | SWISSPROT | BIOTYPE | SIFT | PolyPhen | Tumor Sample Barcode | Tissue | Histology | Sex | Age | Stage | Therapy Types | Drugs | Outcome |
| ENTPD5 | SNV | Missense_Mutation | c.1183N>C | p.Asp395His | p.D395H | O75356 | protein_coding | deleterious(0.04) | possibly_damaging(0.781) | TCGA-AC-A23H-01 | Breast | breast invasive carcinoma | Female | >=65 | I/II | Unknown | Unknown | PD | |
| ENTPD5 | SNV | Missense_Mutation | c.412G>C | p.Glu138Gln | p.E138Q | O75356 | protein_coding | tolerated(0.21) | possibly_damaging(0.751) | TCGA-AN-A0XU-01 | Breast | breast invasive carcinoma | Female | <65 | I/II | Unknown | Unknown | SD | |
| ENTPD5 | SNV | Missense_Mutation | novel | c.804N>G | p.Phe268Leu | p.F268L | O75356 | protein_coding | tolerated(1) | probably_damaging(0.998) | TCGA-GM-A3NW-01 | Breast | breast invasive carcinoma | Female | <65 | I/II | Chemotherapy | fluorouracil | SD |
| ENTPD5 | insertion | Nonsense_Mutation | novel | c.519_520insTATTTAGAGCTGGCTCTCATTTGACAGGTCAGCTGCATG | p.Gly173_Ile174insTyrLeuGluLeuAlaLeuIleTerGlnValSerCysMet | p.G173_I174insYLELALI*QVSCM | O75356 | protein_coding | TCGA-A8-A07U-01 | Breast | breast invasive carcinoma | Female | >=65 | III/IV | Chemotherapy | 5-fluorouracil | SD | ||
| ENTPD5 | SNV | Missense_Mutation | rs757235389 | c.134N>T | p.Ala45Val | p.A45V | O75356 | protein_coding | tolerated(0.27) | benign(0.037) | TCGA-2W-A8YY-01 | Cervix | cervical & endocervical cancer | Female | <65 | I/II | Chemotherapy | cisplatin | CR |
| ENTPD5 | SNV | Missense_Mutation | novel | c.596A>T | p.Asp199Val | p.D199V | O75356 | protein_coding | deleterious(0) | probably_damaging(1) | TCGA-VS-A9UD-01 | Cervix | cervical & endocervical cancer | Female | >=65 | III/IV | Chemotherapy | cisplatin | CR |
| ENTPD5 | SNV | Missense_Mutation | novel | c.987C>A | p.Phe329Leu | p.F329L | O75356 | protein_coding | tolerated(0.07) | probably_damaging(0.998) | TCGA-A5-A2K5-01 | Endometrium | uterine corpus endometrioid carcinoma | Female | >=65 | I/II | Unknown | Unknown | SD |
| ENTPD5 | SNV | Missense_Mutation | novel | c.987N>A | p.Phe329Leu | p.F329L | O75356 | protein_coding | tolerated(0.07) | probably_damaging(0.998) | TCGA-AP-A0LM-01 | Endometrium | uterine corpus endometrioid carcinoma | Female | <65 | III/IV | Chemotherapy | cisplatin | SD |
| ENTPD5 | SNV | Missense_Mutation | novel | c.1241N>C | p.Leu414Ser | p.L414S | O75356 | protein_coding | deleterious(0) | possibly_damaging(0.883) | TCGA-B5-A1MW-01 | Endometrium | uterine corpus endometrioid carcinoma | Female | <65 | I/II | Unknown | Unknown | PD |
| ENTPD5 | SNV | Missense_Mutation | novel | c.983C>T | p.Ala328Val | p.A328V | O75356 | protein_coding | deleterious(0.04) | probably_damaging(0.999) | TCGA-B5-A3FC-01 | Endometrium | uterine corpus endometrioid carcinoma | Female | <65 | I/II | Unknown | Unknown | SD |
| Page: 1 2 3 |
Top |
Related drugs of malignant transformation related genes |
| Identification of chemicals and drugs interact with genes involved in malignant transfromation |
| (DGIdb 4.0) |
| Entrez ID | Symbol | Category | Interaction Types | Drug Claim Name | Drug Name | PMIDs |
| Page: 1 |

Copyright 2023-Present -The University of Texas Health Science Center at Houston |