
|
|||||
|
 | |
| |
| |
| |
| |
| |
|
Gene: ENTPD2 |
Gene summary for ENTPD2 |
| Gene information | Species | Human | Gene symbol | ENTPD2 | Gene ID | 954 |
| Gene name | ectonucleoside triphosphate diphosphohydrolase 2 | |
| Gene Alias | CD39L1 | |
| Cytomap | 9q34.3 | |
| Gene Type | protein-coding | GO ID | GO:0001775 | UniProtAcc | Q9Y5L3 |
Top |
Malignant transformation analysis |
| Identification of the aberrant gene expression in precancerous and cancerous lesions by comparing the gene expression of stem-like cells in diseased tissues with normal stem cells |
| Entrez ID | Symbol | Replicates | Species | Organ | Tissue | Adj P-value | Log2FC | Malignancy |
| 954 | ENTPD2 | LZE7T | Human | Esophagus | ESCC | 4.90e-04 | 4.64e-01 | 0.0667 |
| 954 | ENTPD2 | P2T-E | Human | Esophagus | ESCC | 2.51e-10 | 2.95e-01 | 0.1177 |
| 954 | ENTPD2 | P4T-E | Human | Esophagus | ESCC | 5.08e-04 | 1.03e-01 | 0.1323 |
| 954 | ENTPD2 | P8T-E | Human | Esophagus | ESCC | 8.33e-17 | 3.56e-01 | 0.0889 |
| 954 | ENTPD2 | P11T-E | Human | Esophagus | ESCC | 5.97e-05 | 1.95e-01 | 0.1426 |
| 954 | ENTPD2 | P16T-E | Human | Esophagus | ESCC | 9.79e-22 | 5.08e-01 | 0.1153 |
| 954 | ENTPD2 | P20T-E | Human | Esophagus | ESCC | 1.27e-07 | 1.59e-01 | 0.1124 |
| 954 | ENTPD2 | P21T-E | Human | Esophagus | ESCC | 1.03e-26 | 5.56e-01 | 0.1617 |
| 954 | ENTPD2 | P22T-E | Human | Esophagus | ESCC | 9.17e-03 | 3.69e-02 | 0.1236 |
| 954 | ENTPD2 | P24T-E | Human | Esophagus | ESCC | 7.90e-07 | 1.30e-01 | 0.1287 |
| 954 | ENTPD2 | P26T-E | Human | Esophagus | ESCC | 9.78e-03 | 1.03e-01 | 0.1276 |
| 954 | ENTPD2 | P28T-E | Human | Esophagus | ESCC | 1.92e-07 | 1.46e-01 | 0.1149 |
| 954 | ENTPD2 | P30T-E | Human | Esophagus | ESCC | 2.22e-02 | 1.06e-01 | 0.137 |
| 954 | ENTPD2 | P32T-E | Human | Esophagus | ESCC | 8.85e-08 | 7.83e-02 | 0.1666 |
| 954 | ENTPD2 | P37T-E | Human | Esophagus | ESCC | 1.76e-12 | 2.53e-01 | 0.1371 |
| 954 | ENTPD2 | P39T-E | Human | Esophagus | ESCC | 1.98e-03 | 5.66e-02 | 0.0894 |
| 954 | ENTPD2 | P52T-E | Human | Esophagus | ESCC | 1.20e-10 | 2.66e-01 | 0.1555 |
| 954 | ENTPD2 | P56T-E | Human | Esophagus | ESCC | 4.18e-02 | 4.42e-01 | 0.1613 |
| 954 | ENTPD2 | P57T-E | Human | Esophagus | ESCC | 3.37e-06 | 7.92e-02 | 0.0926 |
| 954 | ENTPD2 | P61T-E | Human | Esophagus | ESCC | 2.79e-03 | 8.49e-02 | 0.099 |
| Page: 1 2 |
| Tissue | Expression Dynamics | Abbreviation |
| Esophagus | 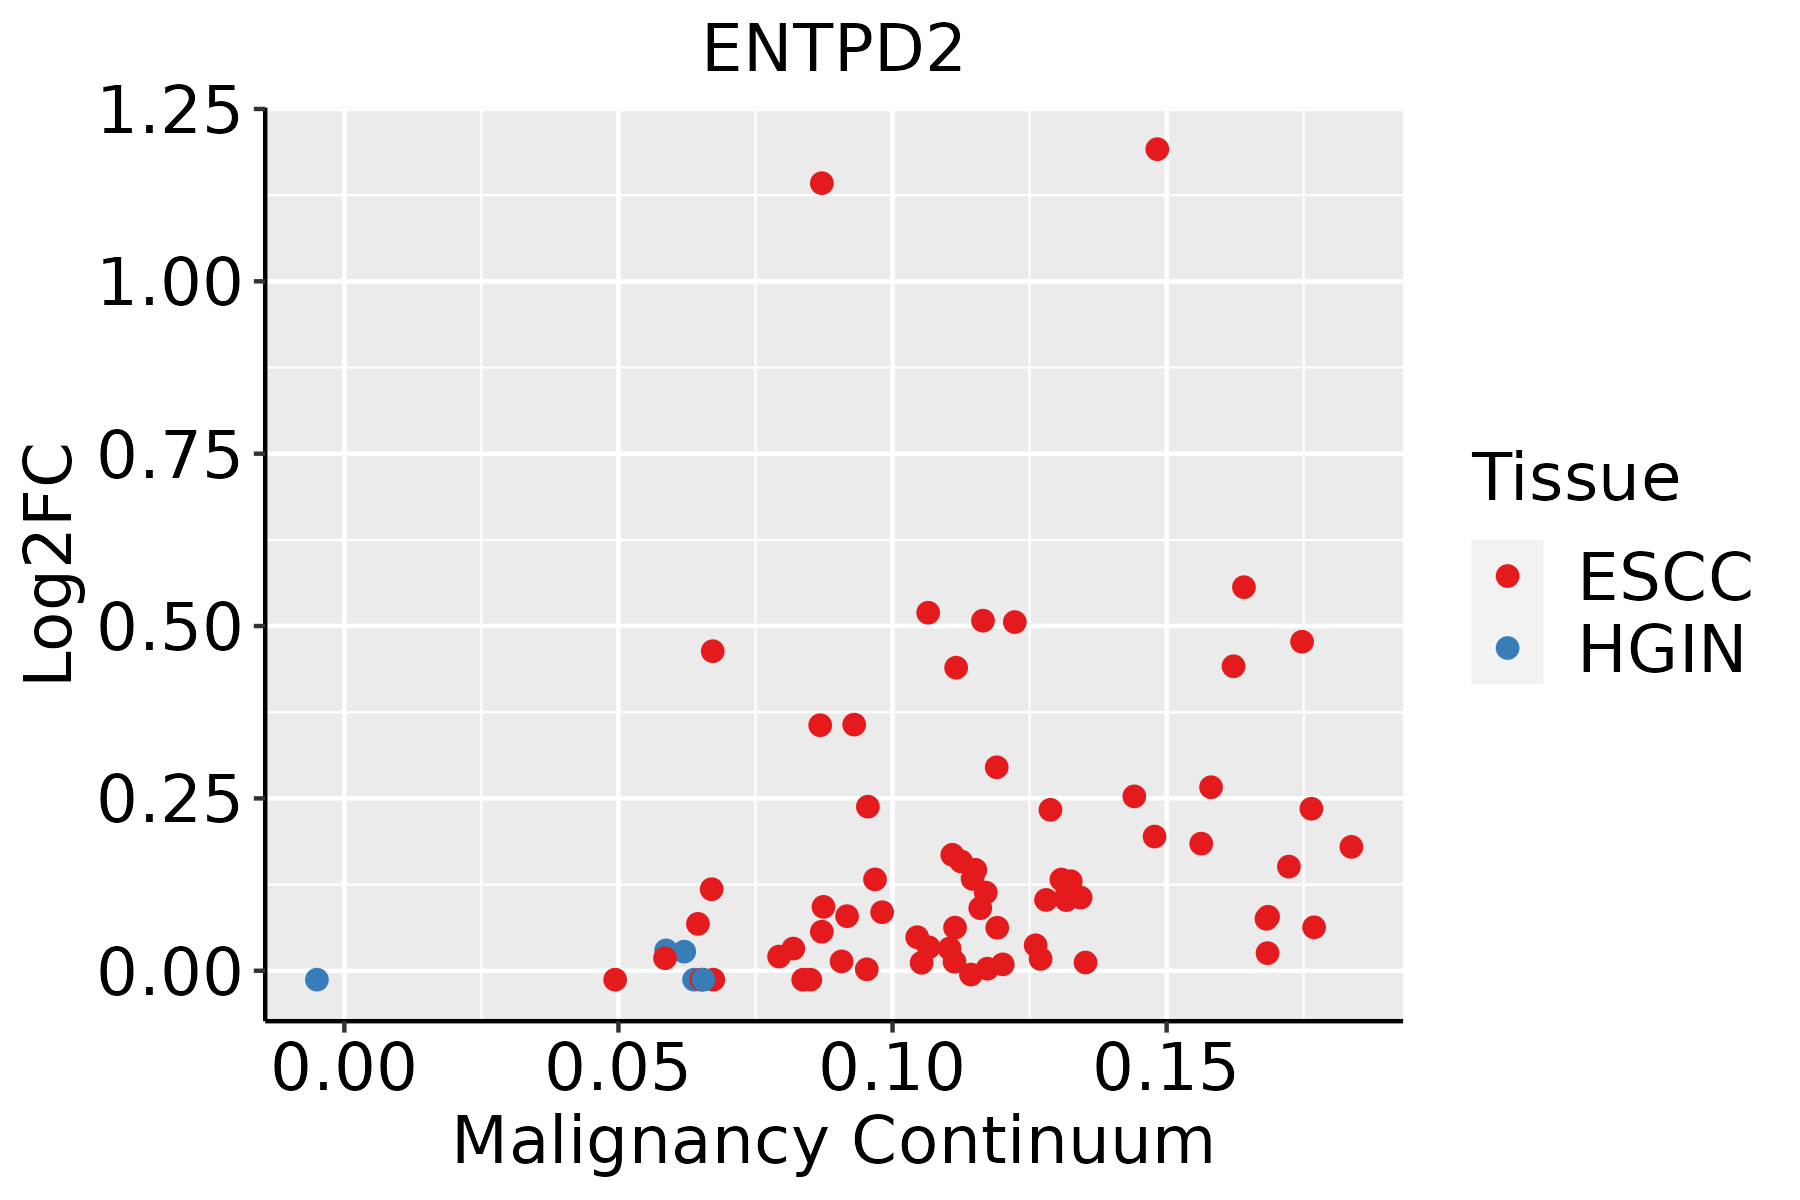 | ESCC: Esophageal squamous cell carcinoma |
| HGIN: High-grade intraepithelial neoplasias | ||
| LGIN: Low-grade intraepithelial neoplasias |
| ∗log2FC in expression of this searched gene in stem-like cells from each diseased tissue sample relative to stem-like cells in normal samples in each tissue plotted against the malignancy continuum. Samples are colored based on if they are from different disease stage. |
Top |
Malignant transformation related pathway analysis |
| Find out the enriched GO biological processes and KEGG pathways involved in transition from healthy to precancer to cancer |
| Tissue | Disease Stage | Enriched GO biological Processes |
| Colorectum | AD |  |
| Colorectum | SER |  |
| Colorectum | MSS |  |
| Colorectum | MSI-H |  |
| Colorectum | FAP |  |
| ∗Top 15 enriched GO BP terms are showed in the bar plot of each disease state in each tissue. Each row represents a significant GO biological process which is colored according to the -log10(p.adjust). |
| Page: 1 2 3 4 5 6 7 8 9 |
| GO ID | Tissue | Disease Stage | Description | Gene Ratio | Bg Ratio | pvalue | p.adjust | Count |
| GO:0034655110 | Esophagus | ESCC | nucleobase-containing compound catabolic process | 272/8552 | 407/18723 | 2.92e-18 | 2.90e-16 | 272 |
| GO:004670018 | Esophagus | ESCC | heterocycle catabolic process | 286/8552 | 445/18723 | 1.12e-15 | 7.47e-14 | 286 |
| GO:004427019 | Esophagus | ESCC | cellular nitrogen compound catabolic process | 288/8552 | 451/18723 | 3.03e-15 | 1.79e-13 | 288 |
| GO:001943918 | Esophagus | ESCC | aromatic compound catabolic process | 295/8552 | 467/18723 | 1.09e-14 | 5.98e-13 | 295 |
| GO:190136118 | Esophagus | ESCC | organic cyclic compound catabolic process | 307/8552 | 495/18723 | 9.99e-14 | 4.80e-12 | 307 |
| GO:0006753110 | Esophagus | ESCC | nucleoside phosphate metabolic process | 288/8552 | 497/18723 | 1.80e-08 | 3.50e-07 | 288 |
| GO:004206027 | Esophagus | ESCC | wound healing | 243/8552 | 422/18723 | 4.62e-07 | 6.25e-06 | 243 |
| GO:000913219 | Esophagus | ESCC | nucleoside diphosphate metabolic process | 77/8552 | 124/18723 | 1.65e-04 | 1.09e-03 | 77 |
| GO:000918520 | Esophagus | ESCC | ribonucleoside diphosphate metabolic process | 66/8552 | 106/18723 | 4.21e-04 | 2.39e-03 | 66 |
| GO:000913520 | Esophagus | ESCC | purine nucleoside diphosphate metabolic process | 63/8552 | 103/18723 | 1.10e-03 | 5.52e-03 | 63 |
| GO:000917920 | Esophagus | ESCC | purine ribonucleoside diphosphate metabolic process | 63/8552 | 103/18723 | 1.10e-03 | 5.52e-03 | 63 |
| Page: 1 |
| Pathway ID | Tissue | Disease Stage | Description | Gene Ratio | Bg Ratio | pvalue | p.adjust | qvalue | Count |
| hsa012325 | Esophagus | ESCC | Nucleotide metabolism | 59/4205 | 85/8465 | 1.67e-04 | 6.58e-04 | 3.37e-04 | 59 |
| hsa0123212 | Esophagus | ESCC | Nucleotide metabolism | 59/4205 | 85/8465 | 1.67e-04 | 6.58e-04 | 3.37e-04 | 59 |
| Page: 1 |
Top |
Cell-cell communication analysis |
| Identification of potential cell-cell interactions between two cell types and their ligand-receptor pairs for different disease states |
| Ligand | Receptor | LRpair | Pathway | Tissue | Disease Stage |
| Page: 1 |
Top |
Single-cell gene regulatory network inference analysis |
| Find out the significant the regulons (TFs) and the target genes of each regulon across cell types for different disease states |
| TF | Cell Type | Tissue | Disease Stage | Target Gene | RSS | Regulon Activity |
| ∗The dot plots of a searched regulon are shown for all cell subpopulations in each disease state of each tissue based on the regulon specific score inferred using pySCENIC and by calculating the average expression. |
| Page: 1 |
Top |
Somatic mutation of malignant transformation related genes |
| Annotation of somatic variants for genes involved in malignant transformation |
| Hugo Symbol | Variant Class | Variant Classification | dbSNP RS | HGVSc | HGVSp | HGVSp Short | SWISSPROT | BIOTYPE | SIFT | PolyPhen | Tumor Sample Barcode | Tissue | Histology | Sex | Age | Stage | Therapy Types | Drugs | Outcome |
| ENTPD2 | SNV | Missense_Mutation | c.434A>G | p.His145Arg | p.H145R | Q9Y5L3 | protein_coding | tolerated(0.35) | benign(0.003) | TCGA-A8-A09Z-01 | Breast | breast invasive carcinoma | Female | >=65 | I/II | Unknown | Unknown | SD | |
| ENTPD2 | SNV | Missense_Mutation | c.400N>C | p.Glu134Gln | p.E134Q | Q9Y5L3 | protein_coding | tolerated(0.47) | benign(0.021) | TCGA-AC-A23H-01 | Breast | breast invasive carcinoma | Female | >=65 | I/II | Unknown | Unknown | PD | |
| ENTPD2 | SNV | Missense_Mutation | rs138022111 | c.563N>A | p.Arg188Gln | p.R188Q | Q9Y5L3 | protein_coding | tolerated(0.52) | benign(0.003) | TCGA-BH-A0B6-01 | Breast | breast invasive carcinoma | Female | <65 | I/II | Unknown | Unknown | SD |
| ENTPD2 | SNV | Missense_Mutation | c.280N>G | p.Gln94Glu | p.Q94E | Q9Y5L3 | protein_coding | tolerated(0.43) | benign(0.011) | TCGA-BH-A18V-01 | Breast | breast invasive carcinoma | Female | <65 | I/II | Unknown | Unknown | SD | |
| ENTPD2 | SNV | Missense_Mutation | c.1418N>T | p.Ser473Phe | p.S473F | Q9Y5L3 | protein_coding | tolerated(0.41) | benign(0) | TCGA-E2-A15P-01 | Breast | breast invasive carcinoma | Female | <65 | I/II | Hormone Therapy | arimidex | SD | |
| ENTPD2 | SNV | Missense_Mutation | novel | c.1085C>A | p.Pro362His | p.P362H | Q9Y5L3 | protein_coding | deleterious(0.02) | probably_damaging(0.967) | TCGA-EW-A1IX-01 | Breast | breast invasive carcinoma | Female | <65 | I/II | Hormone Therapy | femara | SD |
| ENTPD2 | SNV | Missense_Mutation | c.1298N>T | p.Ala433Val | p.A433V | Q9Y5L3 | protein_coding | deleterious(0.01) | benign(0.077) | TCGA-A6-6653-01 | Colorectum | colon adenocarcinoma | Male | >=65 | I/II | Unknown | Unknown | SD | |
| ENTPD2 | SNV | Missense_Mutation | rs770323046 | c.562C>T | p.Arg188Trp | p.R188W | Q9Y5L3 | protein_coding | deleterious(0) | possibly_damaging(0.874) | TCGA-AZ-4313-01 | Colorectum | colon adenocarcinoma | Female | <65 | I/II | Unknown | Unknown | SD |
| ENTPD2 | SNV | Missense_Mutation | c.1100N>G | p.Gln367Arg | p.Q367R | Q9Y5L3 | protein_coding | tolerated(0.33) | benign(0.006) | TCGA-DM-A28C-01 | Colorectum | colon adenocarcinoma | Male | >=65 | I/II | Unknown | Unknown | PD | |
| ENTPD2 | SNV | Missense_Mutation | rs753972936 | c.1414N>A | p.Ala472Thr | p.A472T | Q9Y5L3 | protein_coding | tolerated(0.32) | benign(0) | TCGA-EI-6882-01 | Colorectum | rectum adenocarcinoma | Male | <65 | I/II | Unknown | Unknown | SD |
| Page: 1 2 3 |
Top |
Related drugs of malignant transformation related genes |
| Identification of chemicals and drugs interact with genes involved in malignant transfromation |
| (DGIdb 4.0) |
| Entrez ID | Symbol | Category | Interaction Types | Drug Claim Name | Drug Name | PMIDs |
| 954 | ENTPD2 | ENZYME | inhibitor | 315661118 | CHEMBL469212 |
| Page: 1 |

Copyright 2023-Present -The University of Texas Health Science Center at Houston |