
|
|||||
|
 | |
| |
| |
| |
| |
| |
|
Gene: ENPP3 |
Gene summary for ENPP3 |
| Gene information | Species | Human | Gene symbol | ENPP3 | Gene ID | 5169 |
| Gene name | ectonucleotide pyrophosphatase/phosphodiesterase 3 | |
| Gene Alias | B10 | |
| Cytomap | 6q23.2 | |
| Gene Type | protein-coding | GO ID | GO:0001775 | UniProtAcc | O14638 |
Top |
Malignant transformation analysis |
| Identification of the aberrant gene expression in precancerous and cancerous lesions by comparing the gene expression of stem-like cells in diseased tissues with normal stem cells |
| Entrez ID | Symbol | Replicates | Species | Organ | Tissue | Adj P-value | Log2FC | Malignancy |
| 5169 | ENPP3 | HTA11_1938_2000001011 | Human | Colorectum | AD | 6.42e-04 | 6.77e-01 | -0.0811 |
| 5169 | ENPP3 | HTA11_347_2000001011 | Human | Colorectum | AD | 3.04e-11 | 6.64e-01 | -0.1954 |
| 5169 | ENPP3 | HTA11_7696_3000711011 | Human | Colorectum | AD | 6.31e-03 | 4.10e-01 | 0.0674 |
| 5169 | ENPP3 | HTA11_99999970781_79442 | Human | Colorectum | MSS | 1.24e-22 | 7.88e-01 | 0.294 |
| 5169 | ENPP3 | HTA11_99999974143_84620 | Human | Colorectum | MSS | 2.39e-06 | -3.12e-01 | 0.3005 |
| 5169 | ENPP3 | A002-C-010 | Human | Colorectum | FAP | 1.61e-02 | 2.76e-01 | 0.242 |
| 5169 | ENPP3 | A015-C-203 | Human | Colorectum | FAP | 4.19e-07 | -3.58e-03 | -0.1294 |
| 5169 | ENPP3 | A015-C-204 | Human | Colorectum | FAP | 7.47e-04 | -1.88e-01 | -0.0228 |
| 5169 | ENPP3 | A002-C-201 | Human | Colorectum | FAP | 2.56e-03 | -7.61e-02 | 0.0324 |
| 5169 | ENPP3 | A002-C-021 | Human | Colorectum | FAP | 1.31e-06 | 4.80e-01 | 0.1171 |
| 5169 | ENPP3 | A002-C-205 | Human | Colorectum | FAP | 4.84e-11 | -2.87e-01 | -0.1236 |
| 5169 | ENPP3 | A015-C-006 | Human | Colorectum | FAP | 1.28e-09 | -3.64e-01 | -0.0994 |
| 5169 | ENPP3 | A002-C-114 | Human | Colorectum | FAP | 1.10e-06 | -1.34e-01 | -0.1561 |
| 5169 | ENPP3 | A015-C-104 | Human | Colorectum | FAP | 9.49e-09 | -2.20e-01 | -0.1899 |
| 5169 | ENPP3 | A001-C-014 | Human | Colorectum | FAP | 2.41e-03 | 1.14e-01 | 0.0135 |
| 5169 | ENPP3 | A002-C-016 | Human | Colorectum | FAP | 5.28e-07 | -1.19e-01 | 0.0521 |
| 5169 | ENPP3 | A015-C-002 | Human | Colorectum | FAP | 6.20e-04 | -2.20e-01 | -0.0763 |
| 5169 | ENPP3 | A002-C-116 | Human | Colorectum | FAP | 1.75e-08 | -2.00e-01 | -0.0452 |
| 5169 | ENPP3 | A014-C-008 | Human | Colorectum | FAP | 7.36e-05 | -1.54e-01 | -0.191 |
| 5169 | ENPP3 | A018-E-020 | Human | Colorectum | FAP | 5.26e-10 | -2.25e-01 | -0.2034 |
| Page: 1 2 |
| Tissue | Expression Dynamics | Abbreviation |
| Colorectum (GSE201348) |  | FAP: Familial adenomatous polyposis |
| CRC: Colorectal cancer | ||
| Colorectum (HTA11) |  | AD: Adenomas |
| SER: Sessile serrated lesions | ||
| MSI-H: Microsatellite-high colorectal cancer | ||
| MSS: Microsatellite stable colorectal cancer | ||
| Endometrium | 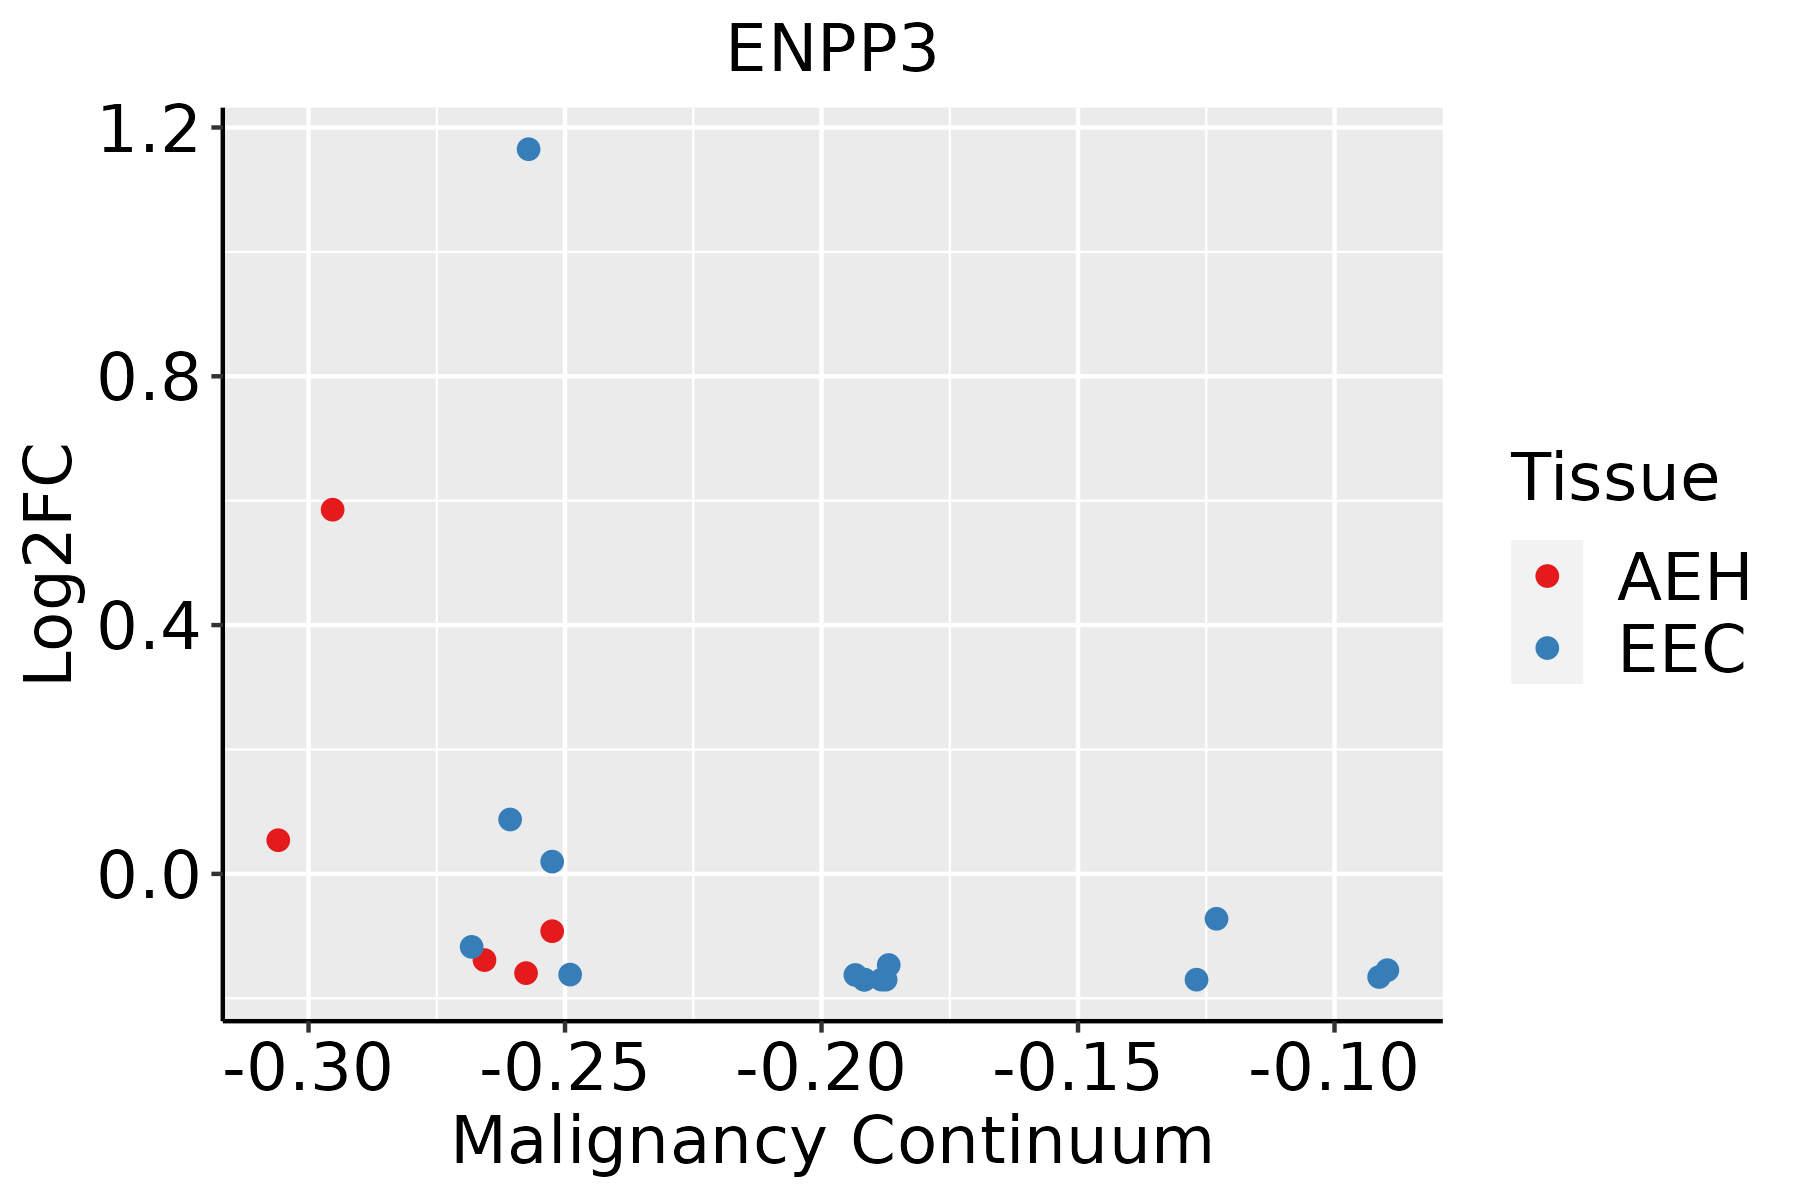 | AEH: Atypical endometrial hyperplasia |
| EEC: Endometrioid Cancer | ||
| Liver | 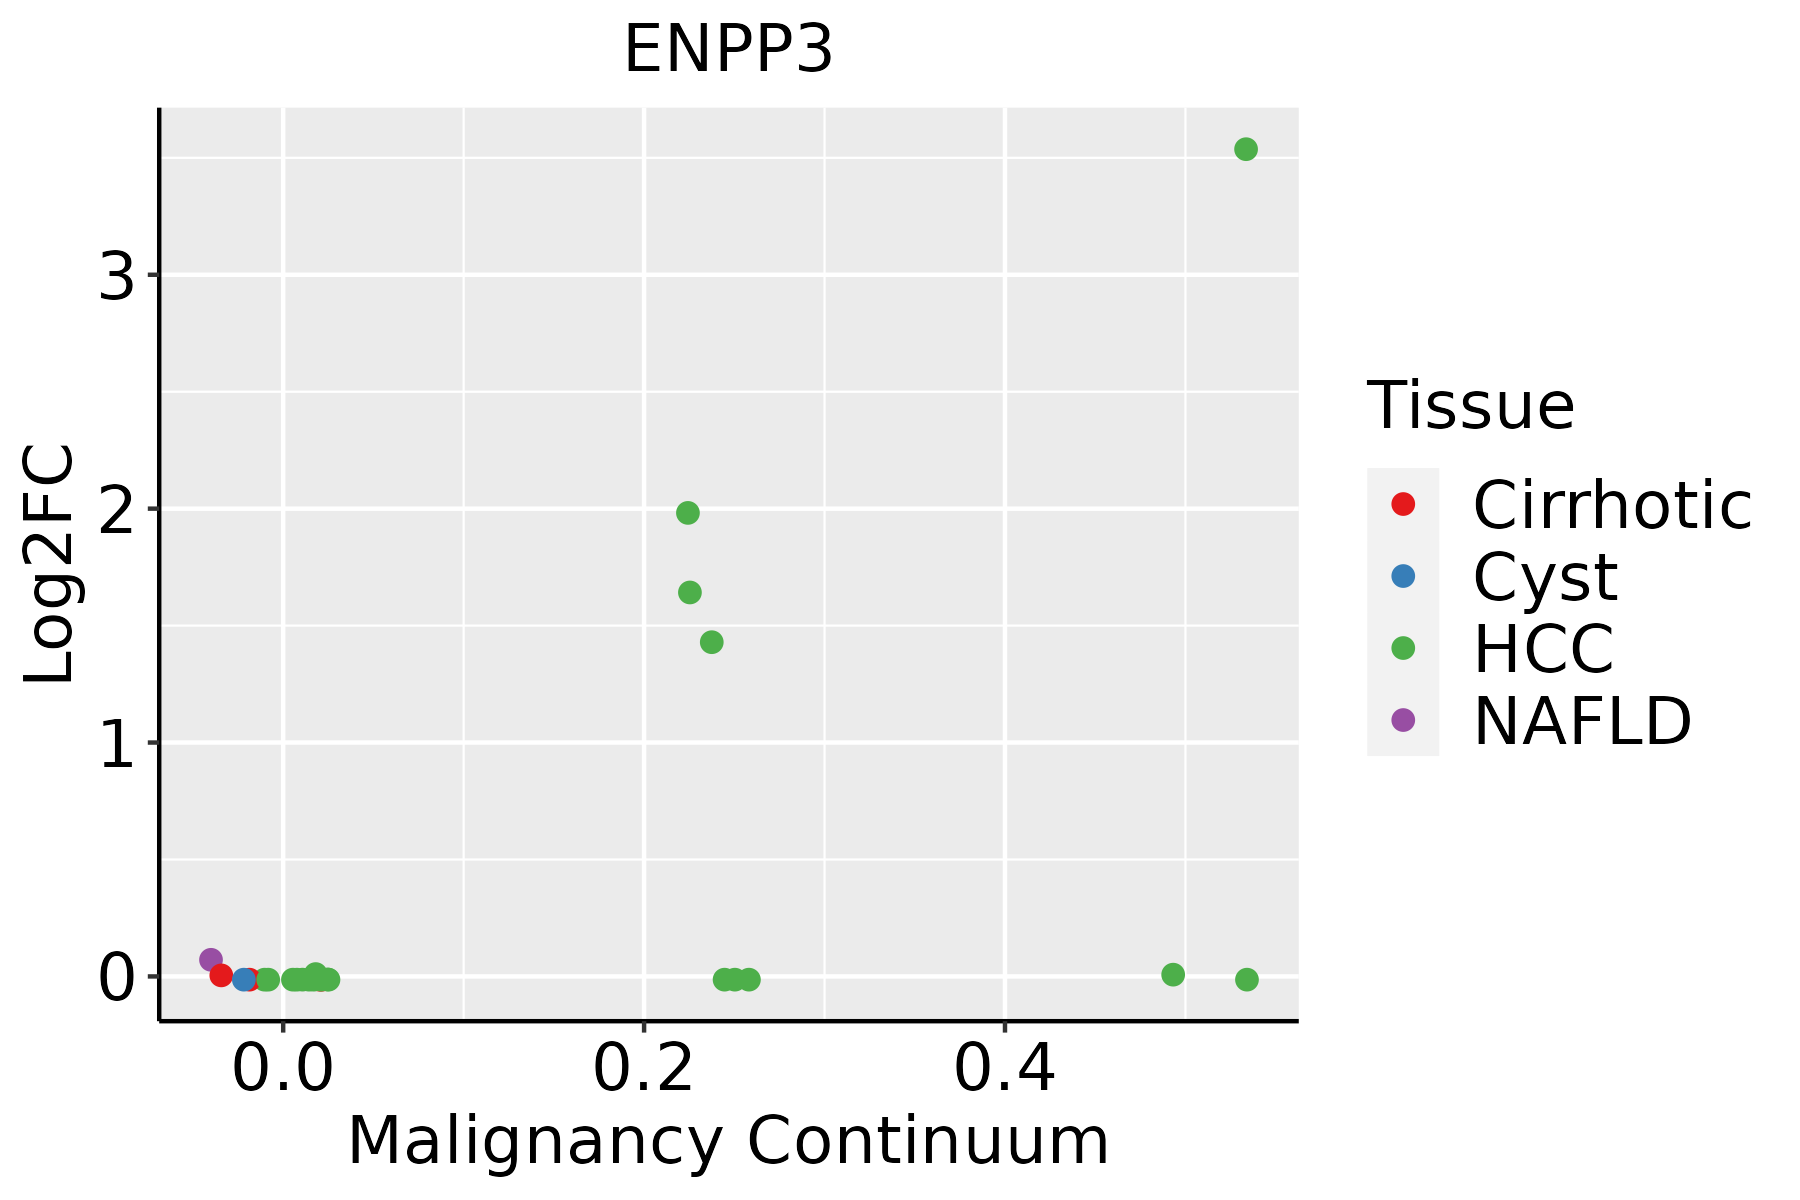 | HCC: Hepatocellular carcinoma |
| NAFLD: Non-alcoholic fatty liver disease |
| ∗log2FC in expression of this searched gene in stem-like cells from each diseased tissue sample relative to stem-like cells in normal samples in each tissue plotted against the malignancy continuum. Samples are colored based on if they are from different disease stage. |
Top |
Malignant transformation related pathway analysis |
| Find out the enriched GO biological processes and KEGG pathways involved in transition from healthy to precancer to cancer |
| Tissue | Disease Stage | Enriched GO biological Processes |
| Colorectum | AD |  |
| Colorectum | SER |  |
| Colorectum | MSS |  |
| Colorectum | MSI-H |  |
| Colorectum | FAP |  |
| ∗Top 15 enriched GO BP terms are showed in the bar plot of each disease state in each tissue. Each row represents a significant GO biological process which is colored according to the -log10(p.adjust). |
| Page: 1 2 3 4 5 6 7 8 9 |
| GO ID | Tissue | Disease Stage | Description | Gene Ratio | Bg Ratio | pvalue | p.adjust | Count |
| GO:0046034 | Colorectum | AD | ATP metabolic process | 142/3918 | 277/18723 | 2.64e-29 | 8.26e-26 | 142 |
| GO:0009117 | Colorectum | AD | nucleotide metabolic process | 168/3918 | 489/18723 | 2.20e-12 | 3.36e-10 | 168 |
| GO:0006753 | Colorectum | AD | nucleoside phosphate metabolic process | 169/3918 | 497/18723 | 4.99e-12 | 6.98e-10 | 169 |
| GO:0044270 | Colorectum | AD | cellular nitrogen compound catabolic process | 147/3918 | 451/18723 | 3.35e-09 | 2.23e-07 | 147 |
| GO:0046700 | Colorectum | AD | heterocycle catabolic process | 145/3918 | 445/18723 | 4.37e-09 | 2.84e-07 | 145 |
| GO:0034655 | Colorectum | AD | nucleobase-containing compound catabolic process | 133/3918 | 407/18723 | 1.56e-08 | 9.12e-07 | 133 |
| GO:0019439 | Colorectum | AD | aromatic compound catabolic process | 146/3918 | 467/18723 | 7.48e-08 | 3.84e-06 | 146 |
| GO:1901361 | Colorectum | AD | organic cyclic compound catabolic process | 153/3918 | 495/18723 | 8.23e-08 | 4.18e-06 | 153 |
| GO:0009141 | Colorectum | AD | nucleoside triphosphate metabolic process | 48/3918 | 112/18723 | 1.27e-07 | 6.02e-06 | 48 |
| GO:00460342 | Colorectum | MSS | ATP metabolic process | 125/3467 | 277/18723 | 1.38e-24 | 2.15e-21 | 125 |
| GO:00442702 | Colorectum | MSS | cellular nitrogen compound catabolic process | 141/3467 | 451/18723 | 2.95e-11 | 3.83e-09 | 141 |
| GO:00467002 | Colorectum | MSS | heterocycle catabolic process | 139/3467 | 445/18723 | 4.37e-11 | 5.05e-09 | 139 |
| GO:00346552 | Colorectum | MSS | nucleobase-containing compound catabolic process | 129/3467 | 407/18723 | 7.48e-11 | 8.18e-09 | 129 |
| GO:19013612 | Colorectum | MSS | organic cyclic compound catabolic process | 148/3467 | 495/18723 | 3.47e-10 | 3.18e-08 | 148 |
| GO:00194392 | Colorectum | MSS | aromatic compound catabolic process | 140/3467 | 467/18723 | 8.56e-10 | 6.85e-08 | 140 |
| GO:00091172 | Colorectum | MSS | nucleotide metabolic process | 144/3467 | 489/18723 | 1.87e-09 | 1.35e-07 | 144 |
| GO:00067532 | Colorectum | MSS | nucleoside phosphate metabolic process | 145/3467 | 497/18723 | 3.25e-09 | 2.23e-07 | 145 |
| GO:00091412 | Colorectum | MSS | nucleoside triphosphate metabolic process | 42/3467 | 112/18723 | 1.75e-06 | 5.60e-05 | 42 |
| GO:00460344 | Colorectum | FAP | ATP metabolic process | 87/2622 | 277/18723 | 6.50e-14 | 6.63e-11 | 87 |
| GO:00442704 | Colorectum | FAP | cellular nitrogen compound catabolic process | 101/2622 | 451/18723 | 7.42e-07 | 3.44e-05 | 101 |
| Page: 1 2 3 4 |
| Pathway ID | Tissue | Disease Stage | Description | Gene Ratio | Bg Ratio | pvalue | p.adjust | qvalue | Count |
| hsa002402 | Liver | HCC | Pyrimidine metabolism | 44/4020 | 58/8465 | 9.34e-06 | 7.11e-05 | 3.95e-05 | 44 |
| hsa012322 | Liver | HCC | Nucleotide metabolism | 59/4020 | 85/8465 | 3.30e-05 | 1.88e-04 | 1.04e-04 | 59 |
| hsa002403 | Liver | HCC | Pyrimidine metabolism | 44/4020 | 58/8465 | 9.34e-06 | 7.11e-05 | 3.95e-05 | 44 |
| hsa012323 | Liver | HCC | Nucleotide metabolism | 59/4020 | 85/8465 | 3.30e-05 | 1.88e-04 | 1.04e-04 | 59 |
| Page: 1 |
Top |
Cell-cell communication analysis |
| Identification of potential cell-cell interactions between two cell types and their ligand-receptor pairs for different disease states |
| Ligand | Receptor | LRpair | Pathway | Tissue | Disease Stage |
| Page: 1 |
Top |
Single-cell gene regulatory network inference analysis |
| Find out the significant the regulons (TFs) and the target genes of each regulon across cell types for different disease states |
| TF | Cell Type | Tissue | Disease Stage | Target Gene | RSS | Regulon Activity |
| ∗The dot plots of a searched regulon are shown for all cell subpopulations in each disease state of each tissue based on the regulon specific score inferred using pySCENIC and by calculating the average expression. |
| Page: 1 |
Top |
Somatic mutation of malignant transformation related genes |
| Annotation of somatic variants for genes involved in malignant transformation |
| Hugo Symbol | Variant Class | Variant Classification | dbSNP RS | HGVSc | HGVSp | HGVSp Short | SWISSPROT | BIOTYPE | SIFT | PolyPhen | Tumor Sample Barcode | Tissue | Histology | Sex | Age | Stage | Therapy Types | Drugs | Outcome |
| ENPP3 | SNV | Missense_Mutation | c.2071N>C | p.Gly691Arg | p.G691R | O14638 | protein_coding | deleterious(0) | probably_damaging(0.996) | TCGA-A8-A082-01 | Breast | breast invasive carcinoma | Female | <65 | I/II | Chemotherapy | 5-fluorouracil | CR | |
| ENPP3 | SNV | Missense_Mutation | novel | c.460G>A | p.Glu154Lys | p.E154K | O14638 | protein_coding | tolerated(0.2) | benign(0.007) | TCGA-AN-A046-01 | Breast | breast invasive carcinoma | Female | >=65 | I/II | Unknown | Unknown | SD |
| ENPP3 | SNV | Missense_Mutation | novel | c.1841G>A | p.Arg614Lys | p.R614K | O14638 | protein_coding | tolerated(0.19) | benign(0.005) | TCGA-AN-A046-01 | Breast | breast invasive carcinoma | Female | >=65 | I/II | Unknown | Unknown | SD |
| ENPP3 | SNV | Missense_Mutation | c.1288N>G | p.Arg430Gly | p.R430G | O14638 | protein_coding | deleterious(0) | possibly_damaging(0.7) | TCGA-C8-A132-01 | Breast | breast invasive carcinoma | Female | <65 | I/II | Unknown | Unknown | SD | |
| ENPP3 | SNV | Missense_Mutation | c.1364N>A | p.Arg455Lys | p.R455K | O14638 | protein_coding | deleterious(0) | probably_damaging(0.998) | TCGA-S3-AA10-01 | Breast | breast invasive carcinoma | Female | >=65 | I/II | Chemotherapy | cytoxan | CR | |
| ENPP3 | insertion | Frame_Shift_Ins | novel | c.2597_2598insACACAAAGAAAAAA | p.Tyr867HisfsTer21 | p.Y867Hfs*21 | O14638 | protein_coding | TCGA-A8-A0AB-01 | Breast | breast invasive carcinoma | Female | <65 | I/II | Chemotherapy | 5-fluorouracil | CR | ||
| ENPP3 | insertion | Nonsense_Mutation | novel | c.603_604insCCTACCAAAACCTTCCCACATCAAAGTAGTTGTCCCTATATATAG | p.Pro207_Asn208insHisGlnSerSerCysProTyrIleTerProThrLysThrPhePro | p.P207_N208insHQSSCPYI*PTKTFP | O14638 | protein_coding | TCGA-AO-A128-01 | Breast | breast invasive carcinoma | Female | <65 | I/II | Chemotherapy | doxorubicin | SD | ||
| ENPP3 | SNV | Missense_Mutation | c.1343N>C | p.Leu448Pro | p.L448P | O14638 | protein_coding | deleterious(0) | probably_damaging(0.992) | TCGA-C5-A7UE-01 | Cervix | cervical & endocervical cancer | Female | <65 | I/II | Chemotherapy | cisplatin | SD | |
| ENPP3 | SNV | Missense_Mutation | rs371115901 | c.305N>A | p.Arg102His | p.R102H | O14638 | protein_coding | deleterious(0) | probably_damaging(0.999) | TCGA-C5-A8XH-01 | Cervix | cervical & endocervical cancer | Female | <65 | I/II | Unknown | Unknown | SD |
| ENPP3 | SNV | Missense_Mutation | rs201810317 | c.2519N>A | p.Arg840His | p.R840H | O14638 | protein_coding | deleterious(0) | probably_damaging(0.993) | TCGA-DS-A0VM-01 | Cervix | cervical & endocervical cancer | Female | <65 | I/II | Chemotherapy | cisplatin | PD |
| Page: 1 2 3 4 5 6 7 8 9 10 11 12 13 |
Top |
Related drugs of malignant transformation related genes |
| Identification of chemicals and drugs interact with genes involved in malignant transfromation |
| (DGIdb 4.0) |
| Entrez ID | Symbol | Category | Interaction Types | Drug Claim Name | Drug Name | PMIDs |
| 5169 | ENPP3 | DRUGGABLE GENOME, EXTERNAL SIDE OF PLASMA MEMBRANE | AGS-16C3F | |||
| 5169 | ENPP3 | DRUGGABLE GENOME, EXTERNAL SIDE OF PLASMA MEMBRANE | AGS-16M8F |
| Page: 1 |

Copyright 2023-Present -The University of Texas Health Science Center at Houston |