
|
|||||
|
 | |
| |
| |
| |
| |
| |
|
Gene: ENOX2 |
Gene summary for ENOX2 |
| Gene information | Species | Human | Gene symbol | ENOX2 | Gene ID | 10495 |
| Gene name | ecto-NOX disulfide-thiol exchanger 2 | |
| Gene Alias | APK1 | |
| Cytomap | Xq26.1 | |
| Gene Type | protein-coding | GO ID | GO:0006091 | UniProtAcc | Q16206 |
Top |
Malignant transformation analysis |
| Identification of the aberrant gene expression in precancerous and cancerous lesions by comparing the gene expression of stem-like cells in diseased tissues with normal stem cells |
| Entrez ID | Symbol | Replicates | Species | Organ | Tissue | Adj P-value | Log2FC | Malignancy |
| 10495 | ENOX2 | LZE4T | Human | Esophagus | ESCC | 3.20e-03 | 1.51e-01 | 0.0811 |
| 10495 | ENOX2 | LZE20T | Human | Esophagus | ESCC | 5.95e-03 | 1.53e-01 | 0.0662 |
| 10495 | ENOX2 | LZE24T | Human | Esophagus | ESCC | 1.59e-08 | 2.87e-01 | 0.0596 |
| 10495 | ENOX2 | P1T-E | Human | Esophagus | ESCC | 2.41e-02 | 1.92e-01 | 0.0875 |
| 10495 | ENOX2 | P2T-E | Human | Esophagus | ESCC | 3.52e-19 | 3.34e-01 | 0.1177 |
| 10495 | ENOX2 | P4T-E | Human | Esophagus | ESCC | 3.41e-10 | 2.11e-01 | 0.1323 |
| 10495 | ENOX2 | P5T-E | Human | Esophagus | ESCC | 3.97e-04 | 1.09e-01 | 0.1327 |
| 10495 | ENOX2 | P8T-E | Human | Esophagus | ESCC | 1.30e-15 | 2.27e-01 | 0.0889 |
| 10495 | ENOX2 | P9T-E | Human | Esophagus | ESCC | 3.71e-10 | 2.67e-01 | 0.1131 |
| 10495 | ENOX2 | P10T-E | Human | Esophagus | ESCC | 4.24e-18 | 3.20e-01 | 0.116 |
| 10495 | ENOX2 | P11T-E | Human | Esophagus | ESCC | 1.29e-02 | 2.11e-01 | 0.1426 |
| 10495 | ENOX2 | P12T-E | Human | Esophagus | ESCC | 9.44e-07 | 1.62e-01 | 0.1122 |
| 10495 | ENOX2 | P15T-E | Human | Esophagus | ESCC | 1.02e-06 | 1.69e-01 | 0.1149 |
| 10495 | ENOX2 | P16T-E | Human | Esophagus | ESCC | 9.56e-08 | 1.40e-01 | 0.1153 |
| 10495 | ENOX2 | P17T-E | Human | Esophagus | ESCC | 6.62e-03 | 2.43e-01 | 0.1278 |
| 10495 | ENOX2 | P20T-E | Human | Esophagus | ESCC | 6.63e-08 | 2.51e-01 | 0.1124 |
| 10495 | ENOX2 | P21T-E | Human | Esophagus | ESCC | 4.44e-08 | 1.67e-01 | 0.1617 |
| 10495 | ENOX2 | P22T-E | Human | Esophagus | ESCC | 7.52e-23 | 3.78e-01 | 0.1236 |
| 10495 | ENOX2 | P23T-E | Human | Esophagus | ESCC | 3.24e-23 | 5.49e-01 | 0.108 |
| 10495 | ENOX2 | P24T-E | Human | Esophagus | ESCC | 1.97e-10 | 2.15e-01 | 0.1287 |
| Page: 1 2 3 4 |
| Tissue | Expression Dynamics | Abbreviation |
| Esophagus | 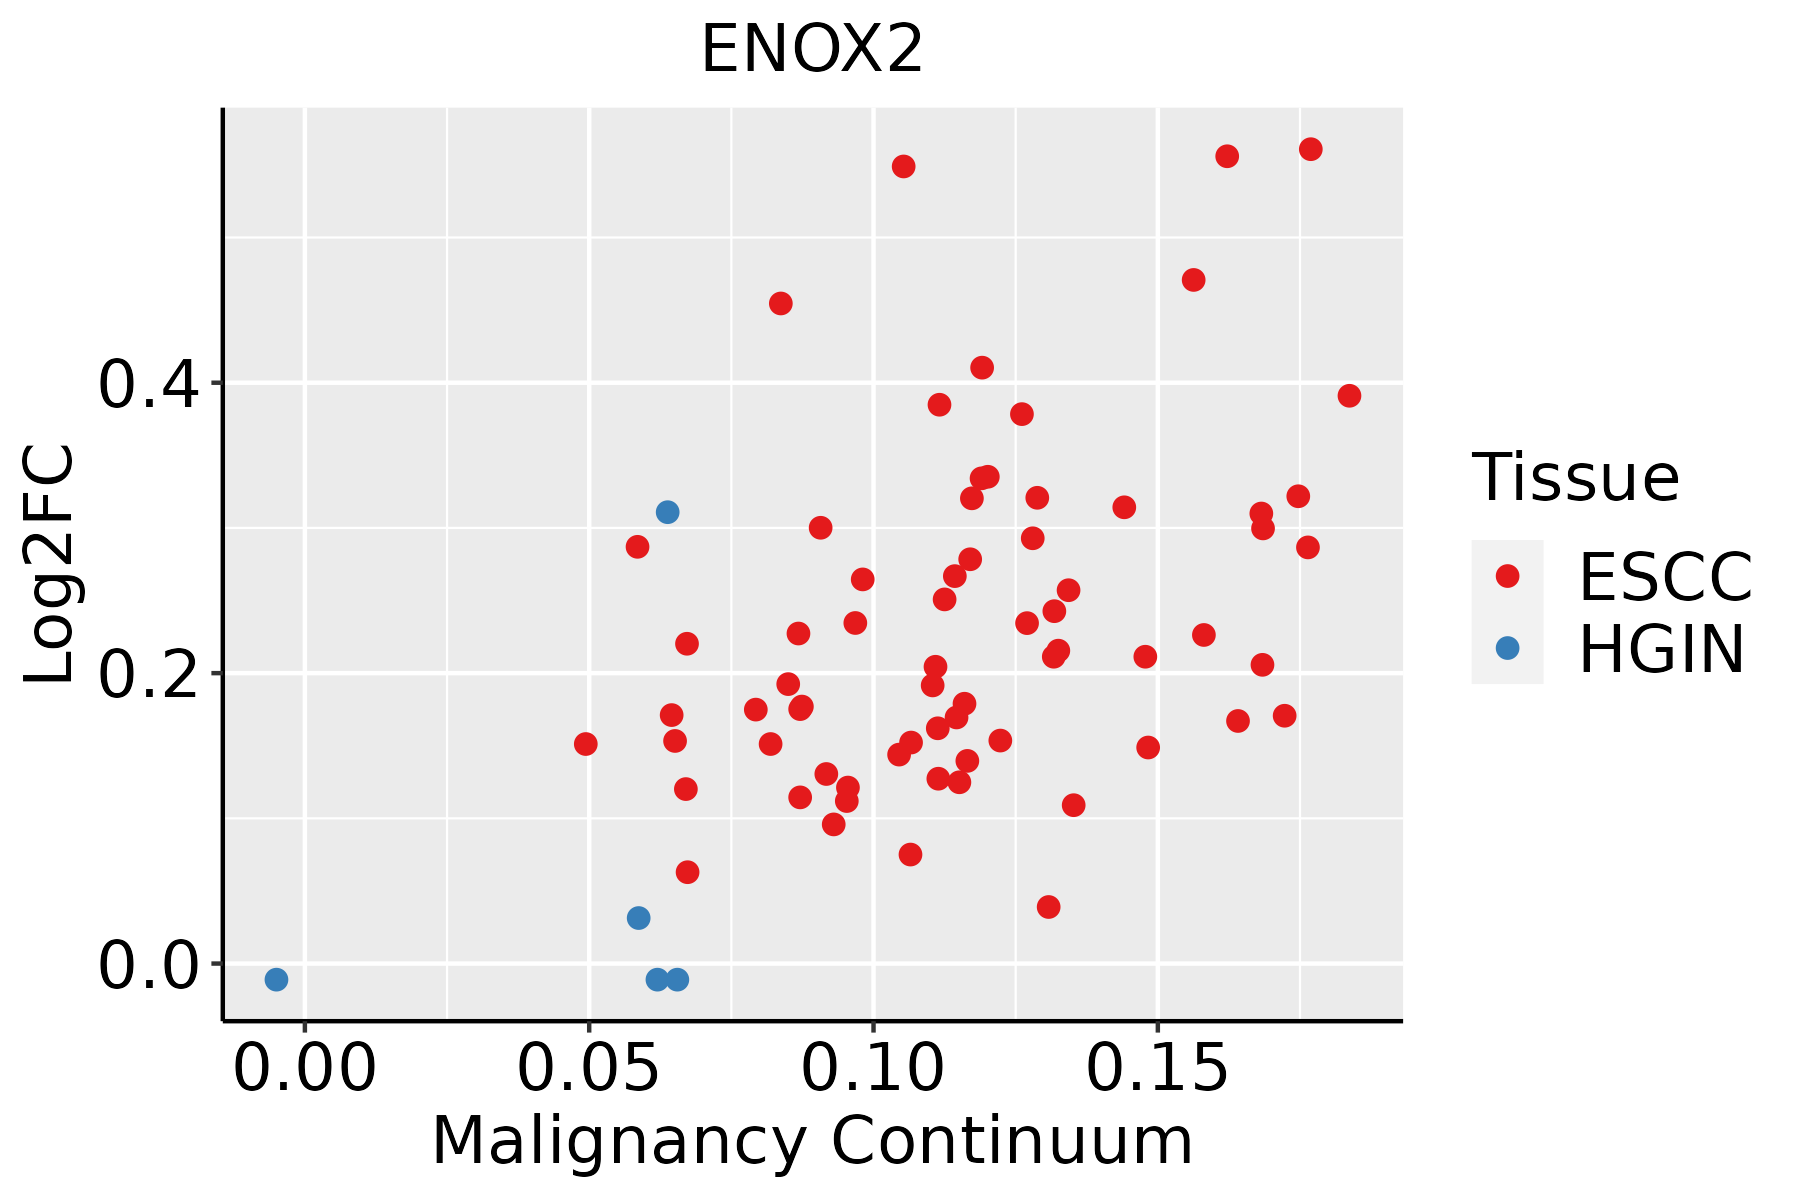 | ESCC: Esophageal squamous cell carcinoma |
| HGIN: High-grade intraepithelial neoplasias | ||
| LGIN: Low-grade intraepithelial neoplasias | ||
| Liver | 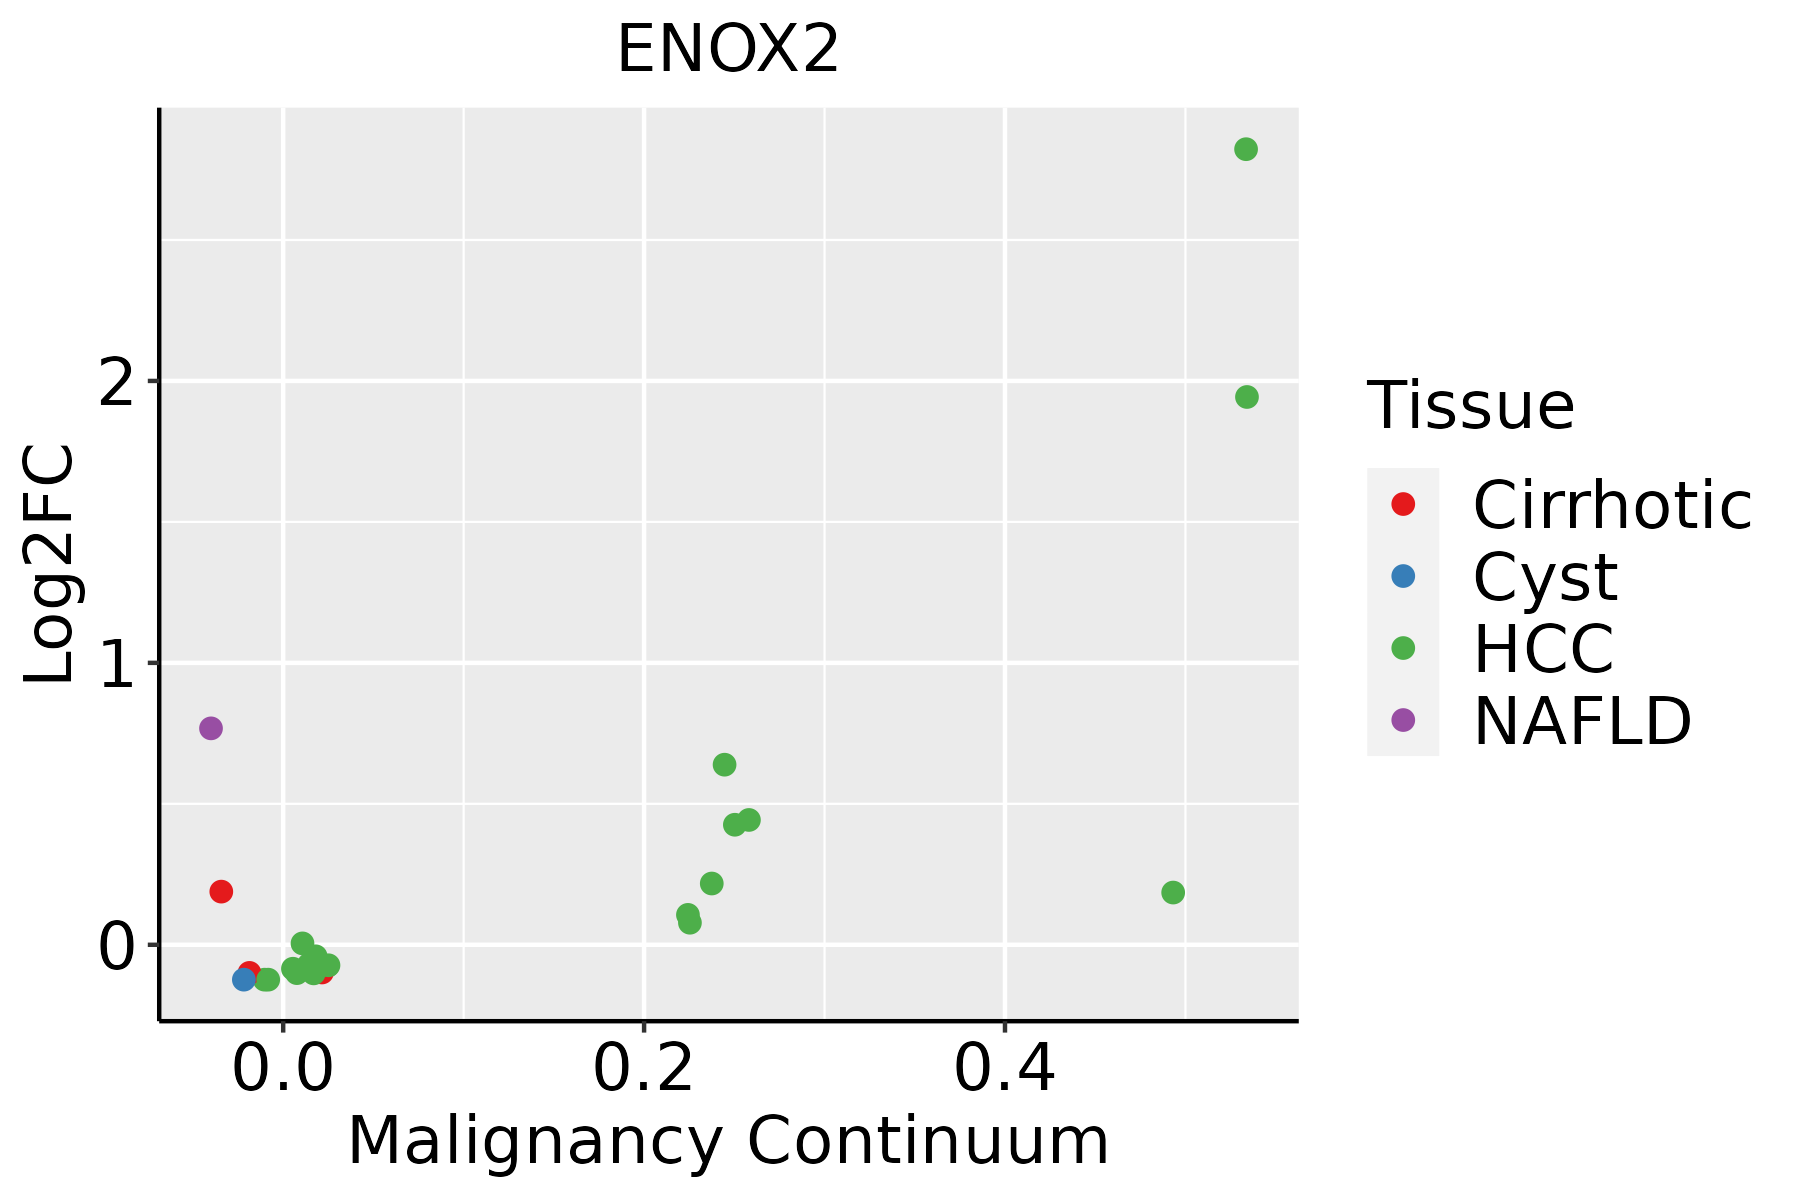 | HCC: Hepatocellular carcinoma |
| NAFLD: Non-alcoholic fatty liver disease | ||
| Oral Cavity | 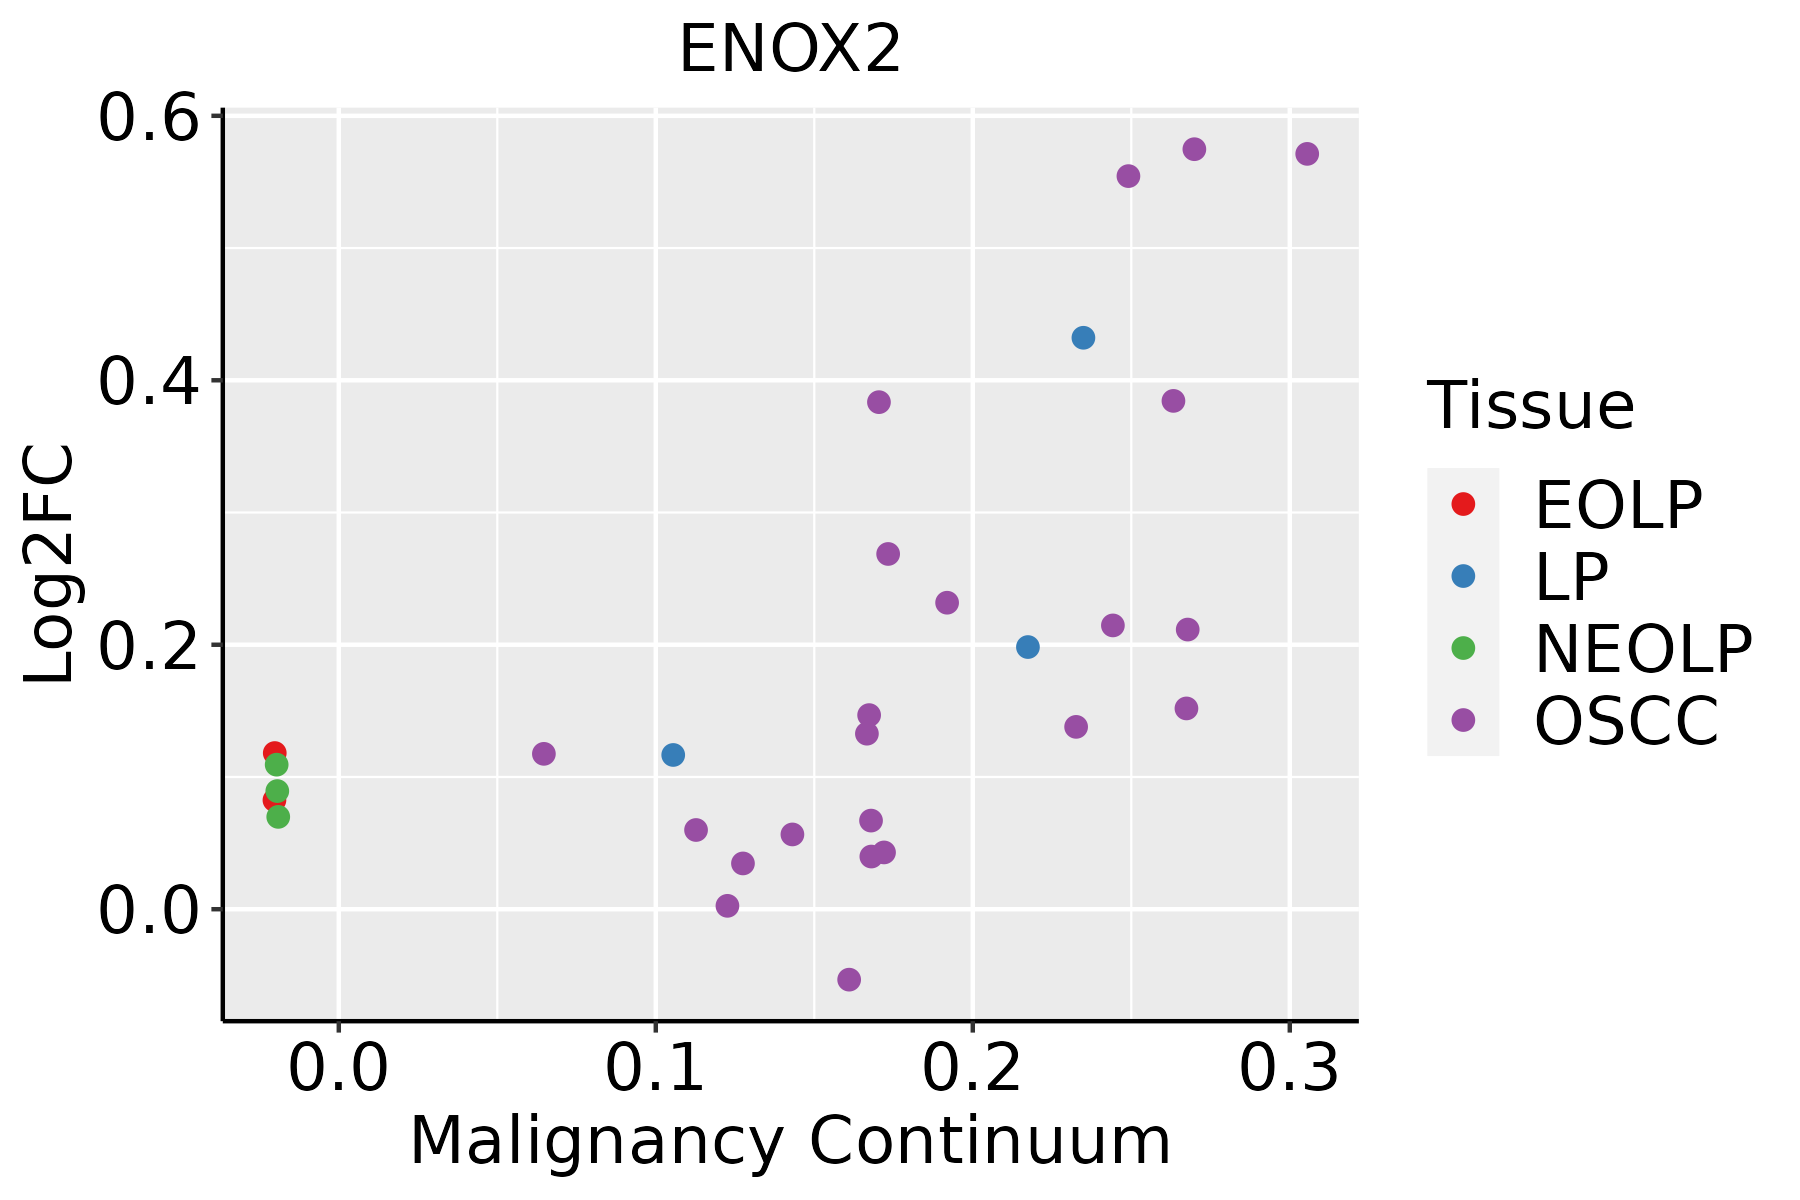 | EOLP: Erosive Oral lichen planus |
| LP: leukoplakia | ||
| NEOLP: Non-erosive oral lichen planus | ||
| OSCC: Oral squamous cell carcinoma |
| ∗log2FC in expression of this searched gene in stem-like cells from each diseased tissue sample relative to stem-like cells in normal samples in each tissue plotted against the malignancy continuum. Samples are colored based on if they are from different disease stage. |
Top |
Malignant transformation related pathway analysis |
| Find out the enriched GO biological processes and KEGG pathways involved in transition from healthy to precancer to cancer |
| Tissue | Disease Stage | Enriched GO biological Processes |
| Colorectum | AD |  |
| Colorectum | SER |  |
| Colorectum | MSS |  |
| Colorectum | MSI-H |  |
| Colorectum | FAP |  |
| ∗Top 15 enriched GO BP terms are showed in the bar plot of each disease state in each tissue. Each row represents a significant GO biological process which is colored according to the -log10(p.adjust). |
| Page: 1 2 3 4 5 6 7 8 9 |
| GO ID | Tissue | Disease Stage | Description | Gene Ratio | Bg Ratio | pvalue | p.adjust | Count |
| GO:0006091110 | Esophagus | ESCC | generation of precursor metabolites and energy | 331/8552 | 490/18723 | 3.86e-23 | 8.45e-21 | 331 |
| GO:0022900110 | Esophagus | ESCC | electron transport chain | 133/8552 | 175/18723 | 2.18e-16 | 1.67e-14 | 133 |
| GO:004851118 | Esophagus | ESCC | rhythmic process | 164/8552 | 298/18723 | 6.80e-04 | 3.57e-03 | 164 |
| GO:00060917 | Liver | NAFLD | generation of precursor metabolites and energy | 84/1882 | 490/18723 | 7.03e-07 | 3.95e-05 | 84 |
| GO:00485115 | Liver | NAFLD | rhythmic process | 56/1882 | 298/18723 | 3.03e-06 | 1.23e-04 | 56 |
| GO:00229007 | Liver | NAFLD | electron transport chain | 29/1882 | 175/18723 | 4.87e-03 | 3.84e-02 | 29 |
| GO:000609122 | Liver | HCC | generation of precursor metabolites and energy | 340/7958 | 490/18723 | 4.04e-34 | 2.85e-31 | 340 |
| GO:002290022 | Liver | HCC | electron transport chain | 134/7958 | 175/18723 | 3.32e-20 | 4.68e-18 | 134 |
| GO:004851121 | Liver | HCC | rhythmic process | 156/7958 | 298/18723 | 3.54e-04 | 2.46e-03 | 156 |
| GO:002290018 | Oral cavity | OSCC | electron transport chain | 126/7305 | 175/18723 | 6.65e-19 | 8.42e-17 | 126 |
| GO:000609118 | Oral cavity | OSCC | generation of precursor metabolites and energy | 286/7305 | 490/18723 | 1.45e-18 | 1.71e-16 | 286 |
| GO:004851116 | Oral cavity | OSCC | rhythmic process | 157/7305 | 298/18723 | 1.00e-06 | 1.36e-05 | 157 |
| GO:002290019 | Oral cavity | LP | electron transport chain | 108/4623 | 175/18723 | 2.21e-25 | 9.90e-23 | 108 |
| GO:000609119 | Oral cavity | LP | generation of precursor metabolites and energy | 214/4623 | 490/18723 | 1.12e-20 | 2.60e-18 | 214 |
| Page: 1 |
| Pathway ID | Tissue | Disease Stage | Description | Gene Ratio | Bg Ratio | pvalue | p.adjust | qvalue | Count |
| Page: 1 |
Top |
Cell-cell communication analysis |
| Identification of potential cell-cell interactions between two cell types and their ligand-receptor pairs for different disease states |
| Ligand | Receptor | LRpair | Pathway | Tissue | Disease Stage |
| Page: 1 |
Top |
Single-cell gene regulatory network inference analysis |
| Find out the significant the regulons (TFs) and the target genes of each regulon across cell types for different disease states |
| TF | Cell Type | Tissue | Disease Stage | Target Gene | RSS | Regulon Activity |
| ∗The dot plots of a searched regulon are shown for all cell subpopulations in each disease state of each tissue based on the regulon specific score inferred using pySCENIC and by calculating the average expression. |
| Page: 1 |
Top |
Somatic mutation of malignant transformation related genes |
| Annotation of somatic variants for genes involved in malignant transformation |
| Hugo Symbol | Variant Class | Variant Classification | dbSNP RS | HGVSc | HGVSp | HGVSp Short | SWISSPROT | BIOTYPE | SIFT | PolyPhen | Tumor Sample Barcode | Tissue | Histology | Sex | Age | Stage | Therapy Types | Drugs | Outcome |
| ENOX2 | SNV | Missense_Mutation | c.1445N>G | p.Leu482Arg | p.L482R | Q16206 | protein_coding | deleterious(0) | probably_damaging(0.936) | TCGA-A2-A0CL-01 | Breast | breast invasive carcinoma | Female | <65 | III/IV | Chemotherapy | cytoxan | SD | |
| ENOX2 | SNV | Missense_Mutation | novel | c.625N>T | p.Asp209Tyr | p.D209Y | Q16206 | protein_coding | deleterious(0) | probably_damaging(0.979) | TCGA-A8-A07W-01 | Breast | breast invasive carcinoma | Female | >=65 | III/IV | Hormone Therapy | exemestane | SD |
| ENOX2 | SNV | Missense_Mutation | c.210N>A | p.Met70Ile | p.M70I | Q16206 | protein_coding | tolerated(0.33) | probably_damaging(0.958) | TCGA-A8-A0A7-01 | Breast | breast invasive carcinoma | Female | <65 | I/II | Unknown | Unknown | SD | |
| ENOX2 | SNV | Missense_Mutation | c.655N>T | p.Arg219Cys | p.R219C | Q16206 | protein_coding | deleterious(0) | probably_damaging(0.994) | TCGA-AN-A0AK-01 | Breast | breast invasive carcinoma | Female | >=65 | I/II | Unknown | Unknown | SD | |
| ENOX2 | insertion | Frame_Shift_Ins | novel | c.435_436insCACACCCTCCTCTGGAAAGC | p.Glu146HisfsTer83 | p.E146Hfs*83 | Q16206 | protein_coding | TCGA-A8-A0A2-01 | Breast | breast invasive carcinoma | Female | >=65 | I/II | Hormone Therapy | tamoxiphen | SD | ||
| ENOX2 | insertion | Frame_Shift_Ins | novel | c.1622_1623insGTTAAAACCAGGGCAGTCTCAGGCAAACTTGAATAAGTTGA | p.Ile541MetfsTer62 | p.I541Mfs*62 | Q16206 | protein_coding | TCGA-AN-A0FN-01 | Breast | breast invasive carcinoma | Female | <65 | I/II | Unknown | Unknown | SD | ||
| ENOX2 | deletion | Frame_Shift_Del | novel | c.1037delA | p.Lys346ArgfsTer32 | p.K346Rfs*32 | Q16206 | protein_coding | TCGA-D8-A27V-01 | Breast | breast invasive carcinoma | Female | <65 | I/II | Hormone Therapy | tamoxiphen | SD | ||
| ENOX2 | SNV | Missense_Mutation | novel | c.1726N>A | p.Leu576Ile | p.L576I | Q16206 | protein_coding | tolerated(0.1) | probably_damaging(0.996) | TCGA-2W-A8YY-01 | Cervix | cervical & endocervical cancer | Female | <65 | I/II | Chemotherapy | cisplatin | CR |
| ENOX2 | SNV | Missense_Mutation | c.997N>C | p.Glu333Gln | p.E333Q | Q16206 | protein_coding | tolerated(0.11) | probably_damaging(0.962) | TCGA-C5-A1M6-01 | Cervix | cervical & endocervical cancer | Female | <65 | I/II | Chemotherapy | cisplatin | PD | |
| ENOX2 | SNV | Missense_Mutation | novel | c.1431N>C | p.Lys477Asn | p.K477N | Q16206 | protein_coding | tolerated(0.72) | benign(0) | TCGA-VS-A94Z-01 | Cervix | cervical & endocervical cancer | Female | <65 | I/II | Chemotherapy | cisplatin | CR |
| Page: 1 2 3 4 5 6 7 8 9 10 |
Top |
Related drugs of malignant transformation related genes |
| Identification of chemicals and drugs interact with genes involved in malignant transfromation |
| (DGIdb 4.0) |
| Entrez ID | Symbol | Category | Interaction Types | Drug Claim Name | Drug Name | PMIDs |
| Page: 1 |

Copyright 2023-Present -The University of Texas Health Science Center at Houston |