
|
|||||
|
 | |
| |
| |
| |
| |
| |
|
Gene: ENOSF1 |
Gene summary for ENOSF1 |
| Gene information | Species | Human | Gene symbol | ENOSF1 | Gene ID | 55556 |
| Gene name | enolase superfamily member 1 | |
| Gene Alias | FUCD | |
| Cytomap | 18p11.32 | |
| Gene Type | protein-coding | GO ID | GO:0005975 | UniProtAcc | Q7L5Y1 |
Top |
Malignant transformation analysis |
| Identification of the aberrant gene expression in precancerous and cancerous lesions by comparing the gene expression of stem-like cells in diseased tissues with normal stem cells |
| Entrez ID | Symbol | Replicates | Species | Organ | Tissue | Adj P-value | Log2FC | Malignancy |
| 55556 | ENOSF1 | CA_HPV_1 | Human | Cervix | CC | 1.04e-02 | -1.27e-01 | 0.0264 |
| 55556 | ENOSF1 | CCI_1 | Human | Cervix | CC | 1.39e-02 | 6.28e-01 | 0.528 |
| 55556 | ENOSF1 | HTA11_347_2000001011 | Human | Colorectum | AD | 1.36e-05 | 4.96e-01 | -0.1954 |
| 55556 | ENOSF1 | HTA11_546_2000001011 | Human | Colorectum | AD | 4.80e-02 | 5.06e-01 | -0.0842 |
| 55556 | ENOSF1 | HTA11_7696_3000711011 | Human | Colorectum | AD | 4.36e-03 | 3.71e-01 | 0.0674 |
| 55556 | ENOSF1 | HTA11_99999971662_82457 | Human | Colorectum | MSS | 3.03e-10 | -4.87e-01 | 0.3859 |
| 55556 | ENOSF1 | HTA11_99999973899_84307 | Human | Colorectum | MSS | 3.61e-06 | -6.42e-01 | 0.2585 |
| 55556 | ENOSF1 | F007 | Human | Colorectum | FAP | 1.04e-10 | -5.71e-01 | 0.1176 |
| 55556 | ENOSF1 | A002-C-010 | Human | Colorectum | FAP | 2.30e-02 | -1.42e-01 | 0.242 |
| 55556 | ENOSF1 | A001-C-207 | Human | Colorectum | FAP | 2.05e-07 | -3.15e-01 | 0.1278 |
| 55556 | ENOSF1 | A015-C-203 | Human | Colorectum | FAP | 3.39e-34 | -2.93e-01 | -0.1294 |
| 55556 | ENOSF1 | A015-C-204 | Human | Colorectum | FAP | 1.71e-09 | -3.20e-01 | -0.0228 |
| 55556 | ENOSF1 | A014-C-040 | Human | Colorectum | FAP | 1.48e-07 | -5.88e-01 | -0.1184 |
| 55556 | ENOSF1 | A002-C-201 | Human | Colorectum | FAP | 2.11e-15 | -2.96e-01 | 0.0324 |
| 55556 | ENOSF1 | A002-C-203 | Human | Colorectum | FAP | 4.43e-06 | -1.19e-01 | 0.2786 |
| 55556 | ENOSF1 | A001-C-119 | Human | Colorectum | FAP | 5.19e-07 | -3.49e-01 | -0.1557 |
| 55556 | ENOSF1 | A001-C-108 | Human | Colorectum | FAP | 1.08e-18 | -1.46e-01 | -0.0272 |
| 55556 | ENOSF1 | A002-C-205 | Human | Colorectum | FAP | 2.79e-25 | -1.04e-01 | -0.1236 |
| 55556 | ENOSF1 | A001-C-104 | Human | Colorectum | FAP | 2.68e-04 | -3.53e-02 | 0.0184 |
| 55556 | ENOSF1 | A015-C-005 | Human | Colorectum | FAP | 5.47e-04 | -1.24e-01 | -0.0336 |
| Page: 1 2 3 4 5 6 7 8 9 |
| Tissue | Expression Dynamics | Abbreviation |
| Cervix | 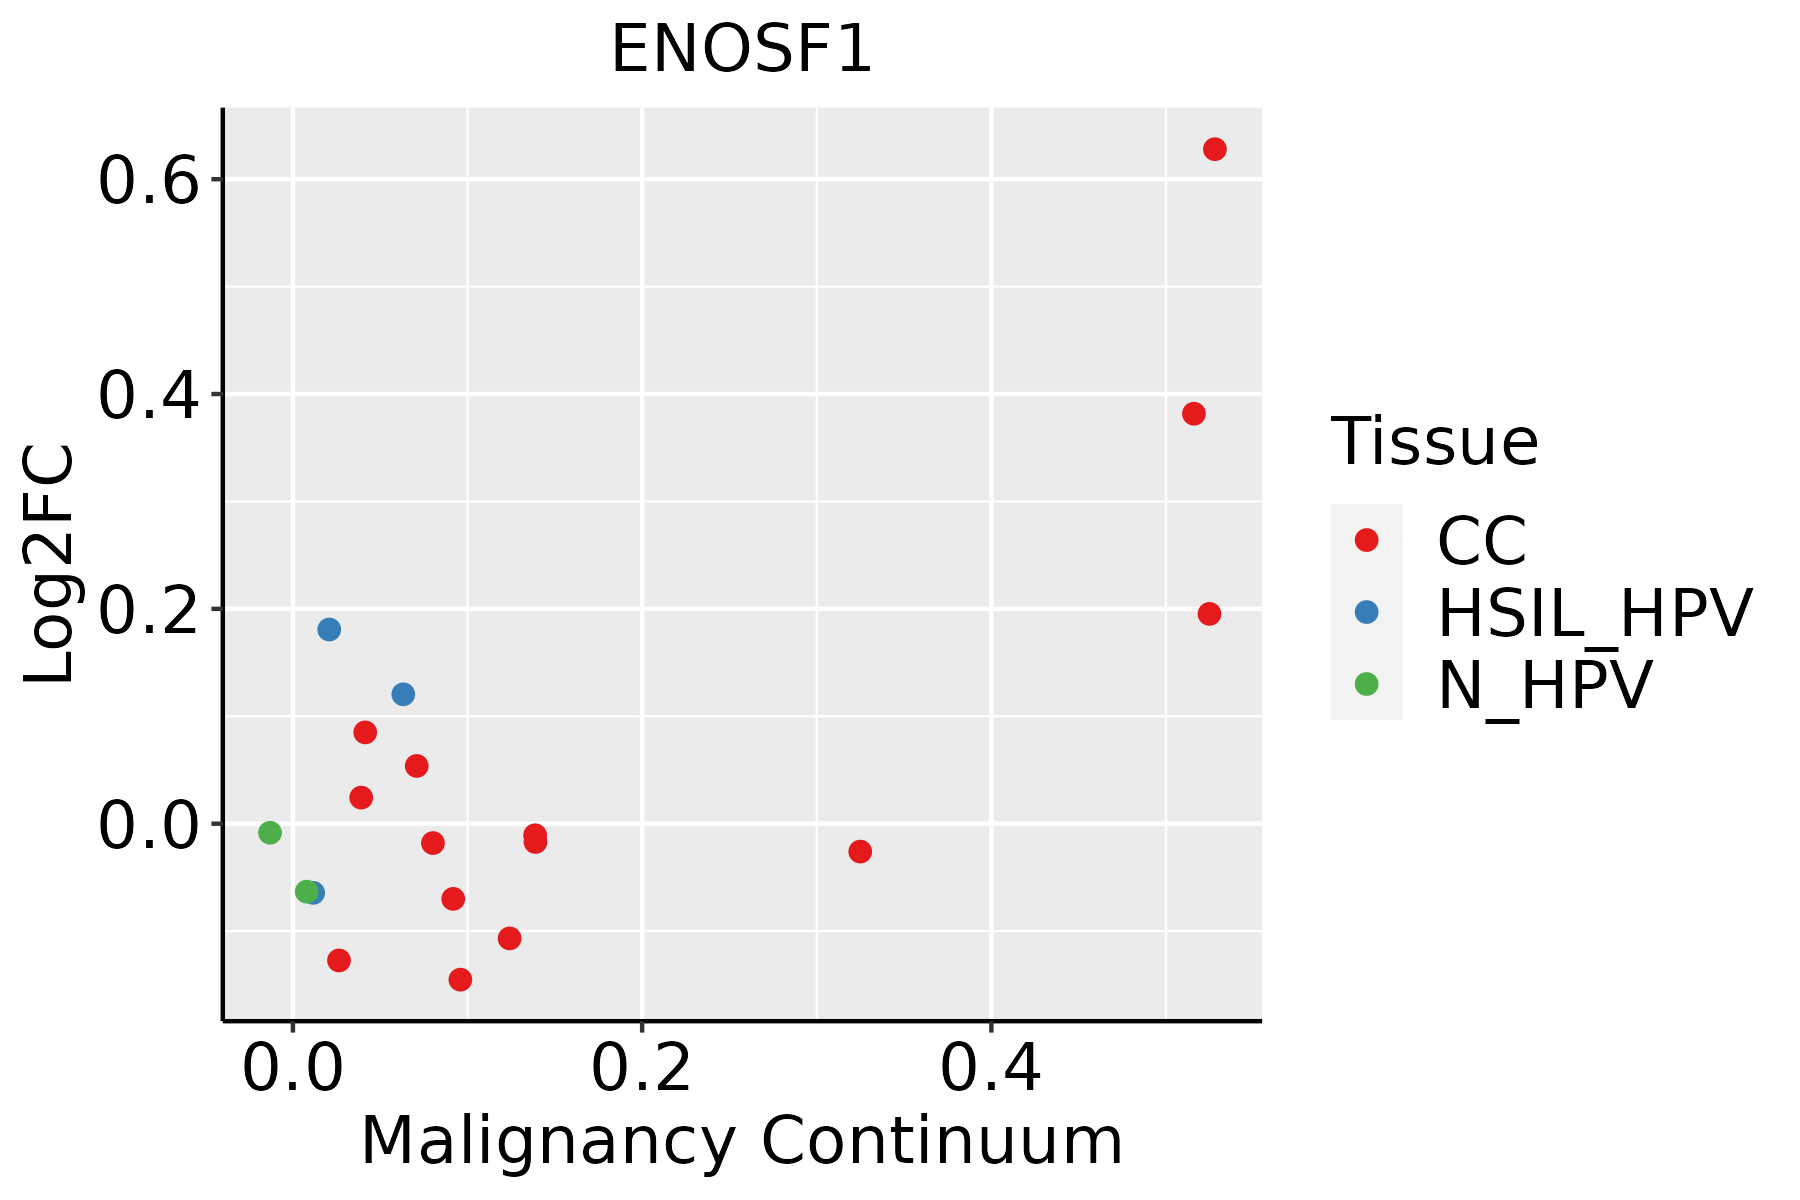 | CC: Cervix cancer |
| HSIL_HPV: HPV-infected high-grade squamous intraepithelial lesions | ||
| N_HPV: HPV-infected normal cervix | ||
| Colorectum (GSE201348) |  | FAP: Familial adenomatous polyposis |
| CRC: Colorectal cancer | ||
| Colorectum (HTA11) |  | AD: Adenomas |
| SER: Sessile serrated lesions | ||
| MSI-H: Microsatellite-high colorectal cancer | ||
| MSS: Microsatellite stable colorectal cancer | ||
| Esophagus | 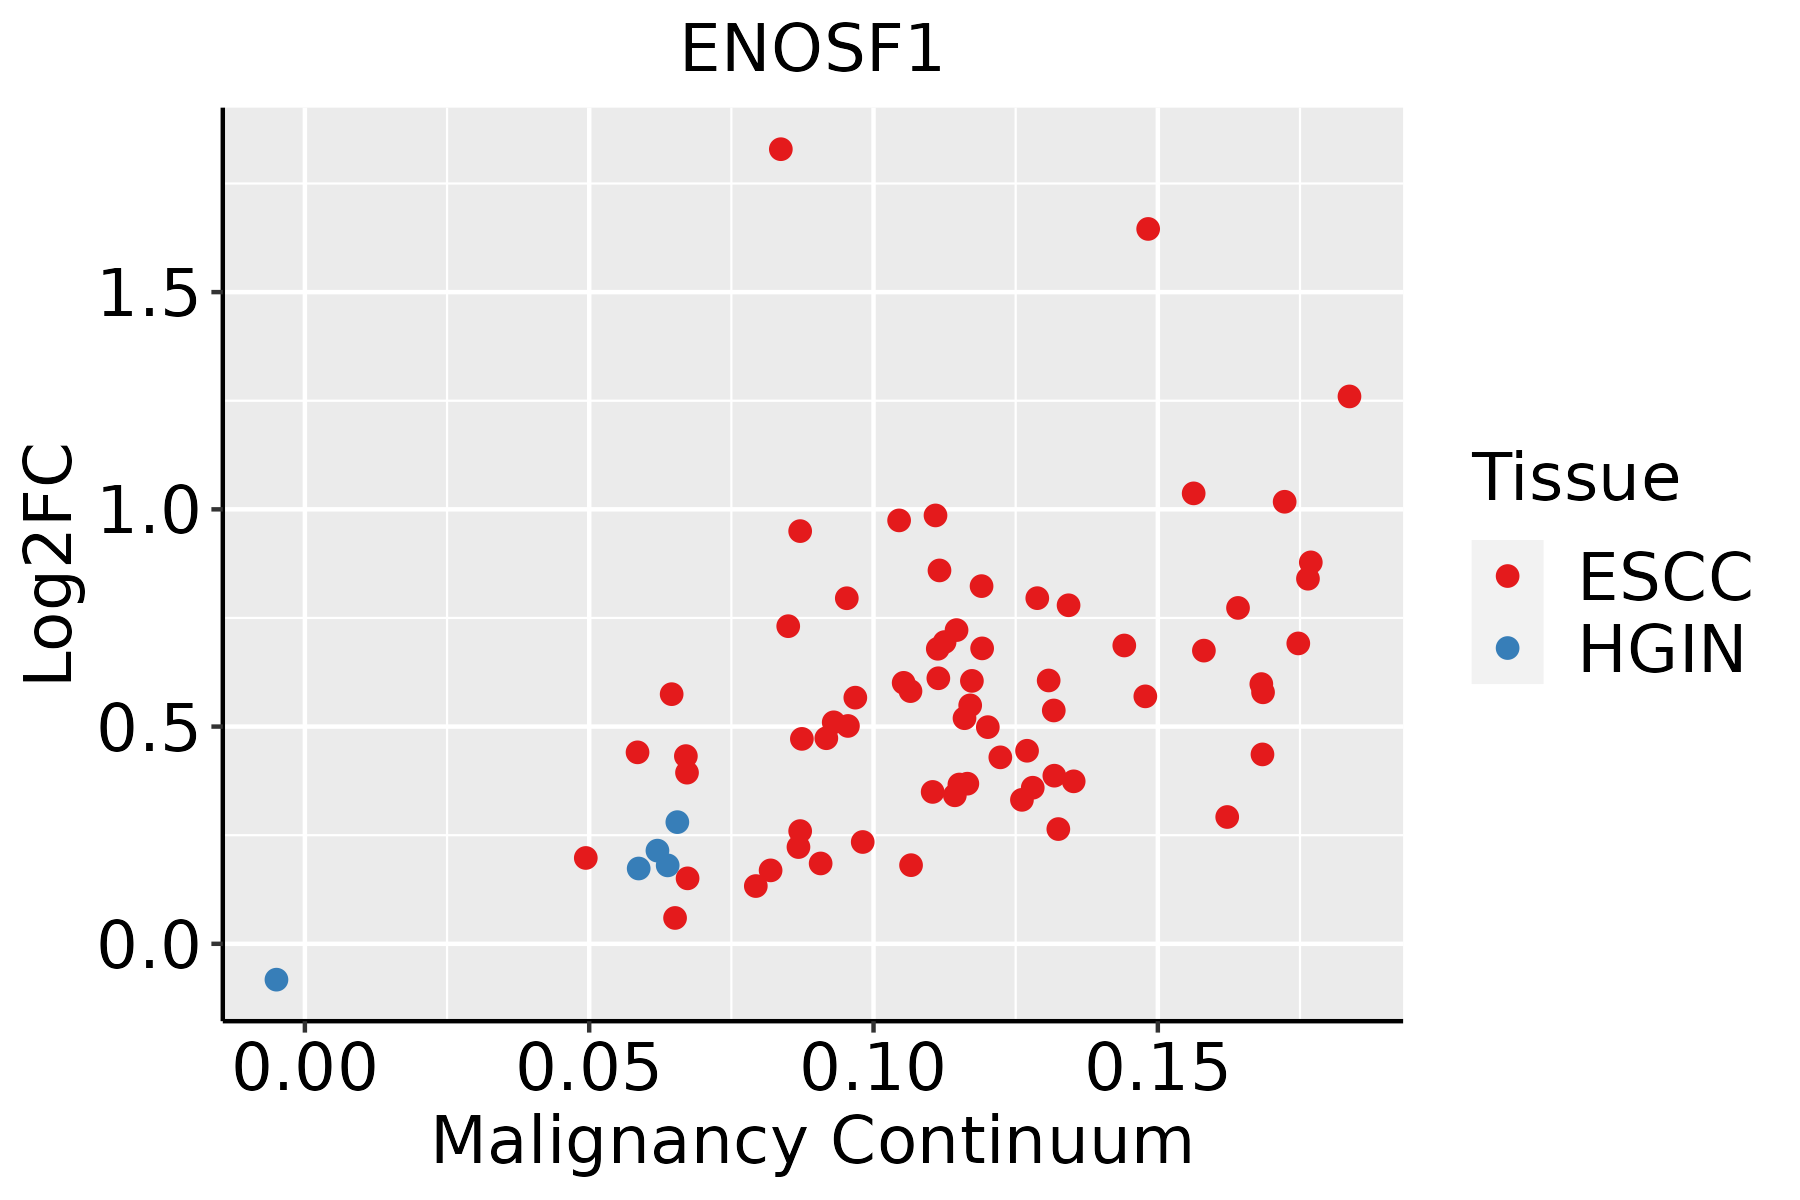 | ESCC: Esophageal squamous cell carcinoma |
| HGIN: High-grade intraepithelial neoplasias | ||
| LGIN: Low-grade intraepithelial neoplasias | ||
| Liver |  | HCC: Hepatocellular carcinoma |
| NAFLD: Non-alcoholic fatty liver disease | ||
| Lung |  | AAH: Atypical adenomatous hyperplasia |
| AIS: Adenocarcinoma in situ | ||
| IAC: Invasive lung adenocarcinoma | ||
| MIA: Minimally invasive adenocarcinoma | ||
| Oral Cavity | 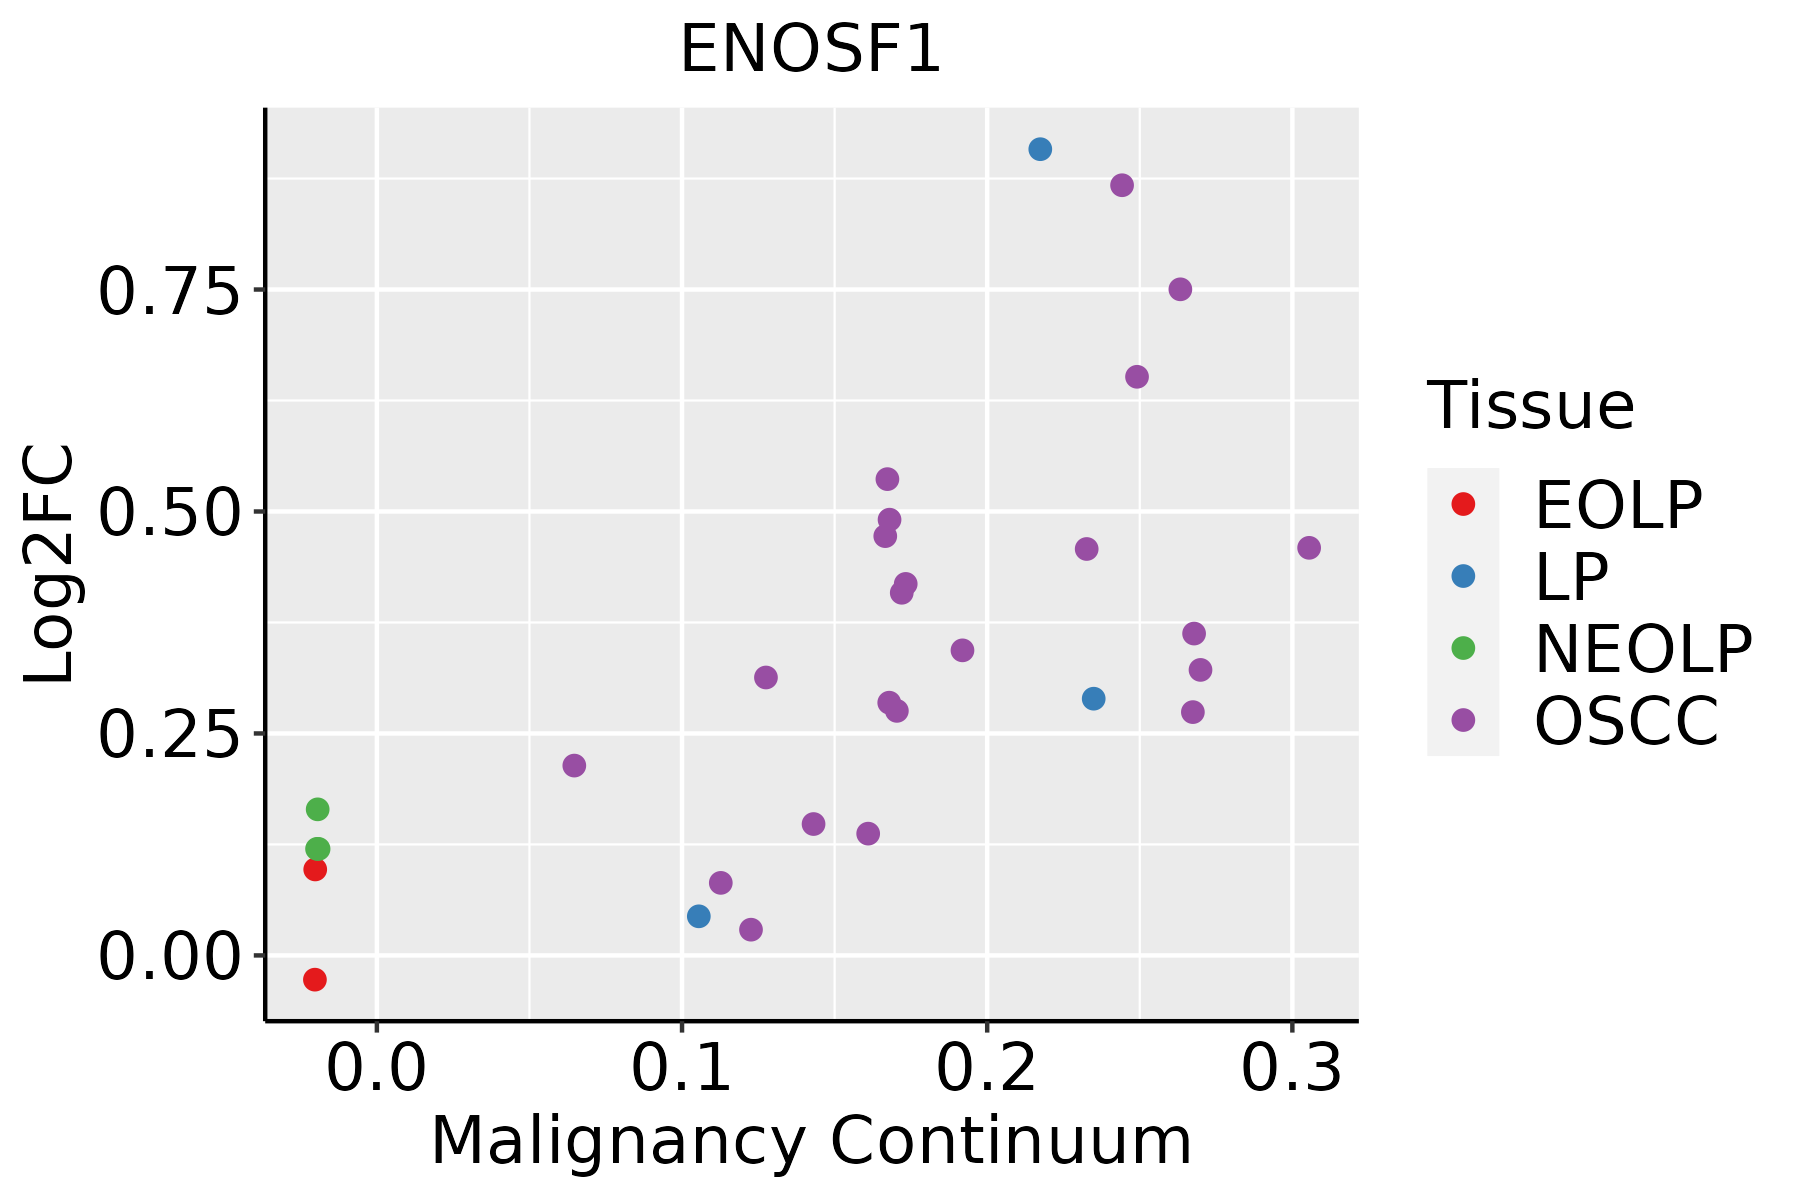 | EOLP: Erosive Oral lichen planus |
| LP: leukoplakia | ||
| NEOLP: Non-erosive oral lichen planus | ||
| OSCC: Oral squamous cell carcinoma | ||
| Skin | 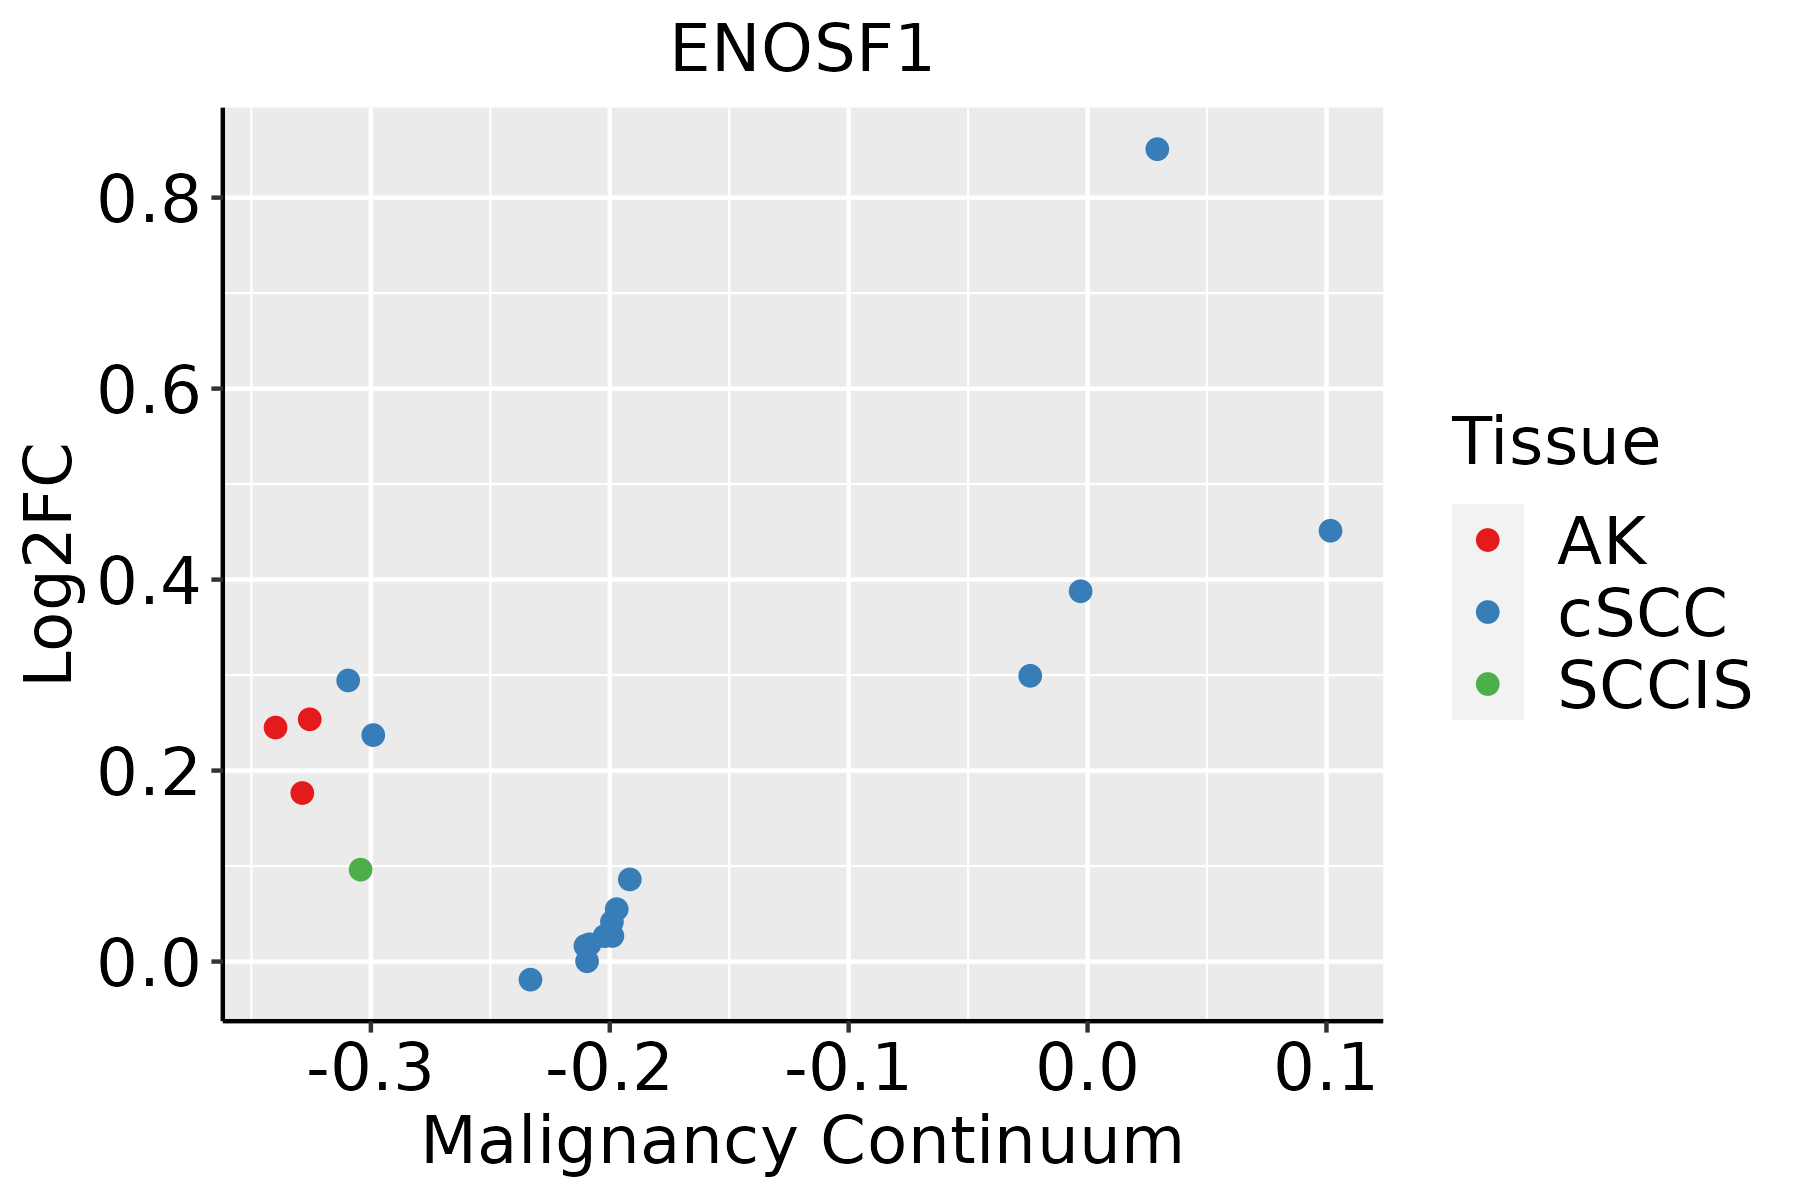 | AK: Actinic keratosis |
| cSCC: Cutaneous squamous cell carcinoma | ||
| SCCIS:squamous cell carcinoma in situ | ||
| Thyroid |  | ATC: Anaplastic thyroid cancer |
| HT: Hashimoto's thyroiditis | ||
| PTC: Papillary thyroid cancer |
| ∗log2FC in expression of this searched gene in stem-like cells from each diseased tissue sample relative to stem-like cells in normal samples in each tissue plotted against the malignancy continuum. Samples are colored based on if they are from different disease stage. |
Top |
Malignant transformation related pathway analysis |
| Find out the enriched GO biological processes and KEGG pathways involved in transition from healthy to precancer to cancer |
| Tissue | Disease Stage | Enriched GO biological Processes |
| Colorectum | AD |  |
| Colorectum | SER |  |
| Colorectum | MSS |  |
| Colorectum | MSI-H |  |
| Colorectum | FAP |  |
| ∗Top 15 enriched GO BP terms are showed in the bar plot of each disease state in each tissue. Each row represents a significant GO biological process which is colored according to the -log10(p.adjust). |
| Page: 1 2 3 4 5 6 7 8 9 |
| GO ID | Tissue | Disease Stage | Description | Gene Ratio | Bg Ratio | pvalue | p.adjust | Count |
| GO:0044282 | Colorectum | AD | small molecule catabolic process | 118/3918 | 376/18723 | 1.05e-06 | 3.55e-05 | 118 |
| GO:0016052 | Colorectum | AD | carbohydrate catabolic process | 56/3918 | 154/18723 | 7.01e-06 | 1.73e-04 | 56 |
| GO:0044262 | Colorectum | AD | cellular carbohydrate metabolic process | 87/3918 | 283/18723 | 6.00e-05 | 1.01e-03 | 87 |
| GO:0016054 | Colorectum | AD | organic acid catabolic process | 73/3918 | 240/18723 | 3.20e-04 | 3.81e-03 | 73 |
| GO:0046395 | Colorectum | AD | carboxylic acid catabolic process | 70/3918 | 236/18723 | 9.06e-04 | 8.71e-03 | 70 |
| GO:0006520 | Colorectum | AD | cellular amino acid metabolic process | 81/3918 | 284/18723 | 1.37e-03 | 1.19e-02 | 81 |
| GO:00160522 | Colorectum | MSS | carbohydrate catabolic process | 45/3467 | 154/18723 | 7.93e-04 | 8.36e-03 | 45 |
| GO:00442822 | Colorectum | MSS | small molecule catabolic process | 94/3467 | 376/18723 | 9.85e-04 | 9.86e-03 | 94 |
| GO:00160542 | Colorectum | MSS | organic acid catabolic process | 61/3467 | 240/18723 | 4.72e-03 | 3.31e-02 | 61 |
| GO:00160523 | Colorectum | FAP | carbohydrate catabolic process | 44/2622 | 154/18723 | 1.82e-06 | 7.42e-05 | 44 |
| GO:00442621 | Colorectum | FAP | cellular carbohydrate metabolic process | 66/2622 | 283/18723 | 1.53e-05 | 4.01e-04 | 66 |
| GO:00442823 | Colorectum | FAP | small molecule catabolic process | 77/2622 | 376/18723 | 3.25e-04 | 4.16e-03 | 77 |
| GO:00160543 | Colorectum | FAP | organic acid catabolic process | 50/2622 | 240/18723 | 2.30e-03 | 1.85e-02 | 50 |
| GO:00463951 | Colorectum | FAP | carboxylic acid catabolic process | 48/2622 | 236/18723 | 4.53e-03 | 3.08e-02 | 48 |
| GO:00160524 | Colorectum | CRC | carbohydrate catabolic process | 34/2078 | 154/18723 | 6.37e-05 | 1.39e-03 | 34 |
| GO:00442622 | Colorectum | CRC | cellular carbohydrate metabolic process | 49/2078 | 283/18723 | 1.06e-03 | 1.24e-02 | 49 |
| GO:00442626 | Esophagus | ESCC | cellular carbohydrate metabolic process | 160/8552 | 283/18723 | 1.43e-04 | 9.66e-04 | 160 |
| GO:001605216 | Esophagus | ESCC | carbohydrate catabolic process | 91/8552 | 154/18723 | 5.39e-04 | 2.97e-03 | 91 |
| GO:00442827 | Esophagus | ESCC | small molecule catabolic process | 201/8552 | 376/18723 | 1.35e-03 | 6.41e-03 | 201 |
| GO:00442751 | Esophagus | ESCC | cellular carbohydrate catabolic process | 27/8552 | 40/18723 | 4.39e-03 | 1.73e-02 | 27 |
| Page: 1 2 |
| Pathway ID | Tissue | Disease Stage | Description | Gene Ratio | Bg Ratio | pvalue | p.adjust | qvalue | Count |
| hsa00051 | Colorectum | AD | Fructose and mannose metabolism | 17/2092 | 34/8465 | 1.25e-03 | 8.02e-03 | 5.12e-03 | 17 |
| hsa000511 | Colorectum | AD | Fructose and mannose metabolism | 17/2092 | 34/8465 | 1.25e-03 | 8.02e-03 | 5.12e-03 | 17 |
| hsa000512 | Esophagus | ESCC | Fructose and mannose metabolism | 24/4205 | 34/8465 | 1.09e-02 | 2.51e-02 | 1.29e-02 | 24 |
| hsa0005111 | Esophagus | ESCC | Fructose and mannose metabolism | 24/4205 | 34/8465 | 1.09e-02 | 2.51e-02 | 1.29e-02 | 24 |
| Page: 1 |
Top |
Cell-cell communication analysis |
| Identification of potential cell-cell interactions between two cell types and their ligand-receptor pairs for different disease states |
| Ligand | Receptor | LRpair | Pathway | Tissue | Disease Stage |
| Page: 1 |
Top |
Single-cell gene regulatory network inference analysis |
| Find out the significant the regulons (TFs) and the target genes of each regulon across cell types for different disease states |
| TF | Cell Type | Tissue | Disease Stage | Target Gene | RSS | Regulon Activity |
| ∗The dot plots of a searched regulon are shown for all cell subpopulations in each disease state of each tissue based on the regulon specific score inferred using pySCENIC and by calculating the average expression. |
| Page: 1 |
Top |
Somatic mutation of malignant transformation related genes |
| Annotation of somatic variants for genes involved in malignant transformation |
| Hugo Symbol | Variant Class | Variant Classification | dbSNP RS | HGVSc | HGVSp | HGVSp Short | SWISSPROT | BIOTYPE | SIFT | PolyPhen | Tumor Sample Barcode | Tissue | Histology | Sex | Age | Stage | Therapy Types | Drugs | Outcome |
| ENOSF1 | SNV | Missense_Mutation | rs763758268 | c.425N>T | p.Ala142Val | p.A142V | Q7L5Y1 | protein_coding | deleterious(0.01) | probably_damaging(0.999) | TCGA-AN-A0FL-01 | Breast | breast invasive carcinoma | Female | <65 | I/II | Unknown | Unknown | SD |
| ENOSF1 | SNV | Missense_Mutation | novel | c.733G>T | p.Gly245Cys | p.G245C | Q7L5Y1 | protein_coding | deleterious(0) | probably_damaging(1) | TCGA-D8-A1XQ-01 | Breast | breast invasive carcinoma | Female | >=65 | I/II | Unknown | Unknown | SD |
| ENOSF1 | SNV | Missense_Mutation | c.1317N>T | p.Glu439Asp | p.E439D | Q7L5Y1 | protein_coding | tolerated(0.37) | benign(0) | TCGA-D8-A27N-01 | Breast | breast invasive carcinoma | Female | <65 | III/IV | Chemotherapy | taxol+adriamycin+cyclophosphamide+herceptin | SD | |
| ENOSF1 | SNV | Missense_Mutation | c.1327A>G | p.Lys443Glu | p.K443E | Q7L5Y1 | protein_coding | tolerated(0.42) | benign(0) | TCGA-AD-6901-01 | Colorectum | colon adenocarcinoma | Male | >=65 | I/II | Chemotherapy | xeloda | PD | |
| ENOSF1 | SNV | Missense_Mutation | novel | c.890N>G | p.Glu297Gly | p.E297G | Q7L5Y1 | protein_coding | deleterious(0) | probably_damaging(1) | TCGA-AZ-4315-01 | Colorectum | colon adenocarcinoma | Male | <65 | I/II | Unknown | Unknown | SD |
| ENOSF1 | SNV | Missense_Mutation | c.197N>T | p.Ala66Val | p.A66V | Q7L5Y1 | protein_coding | tolerated(0.09) | benign(0.013) | TCGA-AZ-6598-01 | Colorectum | colon adenocarcinoma | Female | >=65 | I/II | Unknown | Unknown | SD | |
| ENOSF1 | SNV | Missense_Mutation | c.424N>A | p.Ala142Thr | p.A142T | Q7L5Y1 | protein_coding | deleterious(0) | probably_damaging(0.999) | TCGA-AZ-6601-01 | Colorectum | colon adenocarcinoma | Male | >=65 | I/II | Unknown | Unknown | PD | |
| ENOSF1 | SNV | Missense_Mutation | c.798N>T | p.Lys266Asn | p.K266N | Q7L5Y1 | protein_coding | tolerated(0.39) | benign(0.015) | TCGA-F5-6814-01 | Colorectum | rectum adenocarcinoma | Male | <65 | I/II | Unknown | Unknown | SD | |
| ENOSF1 | deletion | Frame_Shift_Del | novel | c.175delN | p.Tyr59MetfsTer4 | p.Y59Mfs*4 | Q7L5Y1 | protein_coding | TCGA-AG-A01J-01 | Colorectum | rectum adenocarcinoma | Female | <65 | I/II | Unknown | Unknown | SD | ||
| ENOSF1 | SNV | Missense_Mutation | novel | c.305N>C | p.Leu102Pro | p.L102P | Q7L5Y1 | protein_coding | deleterious(0.01) | benign(0.345) | TCGA-A5-A1OF-01 | Endometrium | uterine corpus endometrioid carcinoma | Female | <65 | I/II | Unknown | Unknown | SD |
| Page: 1 2 3 4 |
Top |
Related drugs of malignant transformation related genes |
| Identification of chemicals and drugs interact with genes involved in malignant transfromation |
| (DGIdb 4.0) |
| Entrez ID | Symbol | Category | Interaction Types | Drug Claim Name | Drug Name | PMIDs |
| 55556 | ENOSF1 | ENZYME | fluorouracil | FLUOROURACIL | 17549067,27995989,20714149,27001118,23263912 | |
| 55556 | ENOSF1 | ENZYME | methotrexate | METHOTREXATE | 18322994,16130010 | |
| 55556 | ENOSF1 | ENZYME | capecitabine | CAPECITABINE | 17549067,27995989,20714149,27001118,23263912,28347776 | |
| 55556 | ENOSF1 | ENZYME | 3TC | LAMIVUDINE | 10864683 | |
| 55556 | ENOSF1 | ENZYME | AZT | ZIDOVUDINE | 15980332 | |
| 55556 | ENOSF1 | ENZYME | ANTIVIRAL | 12238529 |
| Page: 1 |

Copyright 2023-Present -The University of Texas Health Science Center at Houston |