
|
|||||
|
 | |
| |
| |
| |
| |
| |
|
Gene: ENO1 |
Gene summary for ENO1 |
| Gene information | Species | Human | Gene symbol | ENO1 | Gene ID | 2023 |
| Gene name | enolase 1 | |
| Gene Alias | ENO1L1 | |
| Cytomap | 1p36.23 | |
| Gene Type | protein-coding | GO ID | GO:0000122 | UniProtAcc | P06733 |
Top |
Malignant transformation analysis |
| Identification of the aberrant gene expression in precancerous and cancerous lesions by comparing the gene expression of stem-like cells in diseased tissues with normal stem cells |
| Entrez ID | Symbol | Replicates | Species | Organ | Tissue | Adj P-value | Log2FC | Malignancy |
| 2023 | ENO1 | GSM4909285 | Human | Breast | IDC | 1.09e-02 | 5.05e-02 | 0.21 |
| 2023 | ENO1 | GSM4909286 | Human | Breast | IDC | 1.07e-30 | -6.26e-01 | 0.1081 |
| 2023 | ENO1 | GSM4909291 | Human | Breast | IDC | 2.76e-09 | -5.33e-01 | 0.1753 |
| 2023 | ENO1 | GSM4909293 | Human | Breast | IDC | 7.68e-22 | -4.31e-01 | 0.1581 |
| 2023 | ENO1 | GSM4909294 | Human | Breast | IDC | 2.36e-05 | -3.95e-01 | 0.2022 |
| 2023 | ENO1 | GSM4909296 | Human | Breast | IDC | 8.13e-12 | -6.11e-01 | 0.1524 |
| 2023 | ENO1 | GSM4909297 | Human | Breast | IDC | 3.14e-28 | -7.17e-01 | 0.1517 |
| 2023 | ENO1 | GSM4909298 | Human | Breast | IDC | 5.91e-39 | -8.71e-01 | 0.1551 |
| 2023 | ENO1 | GSM4909299 | Human | Breast | IDC | 3.20e-14 | -3.86e-01 | 0.035 |
| 2023 | ENO1 | GSM4909301 | Human | Breast | IDC | 1.00e-53 | -1.09e+00 | 0.1577 |
| 2023 | ENO1 | GSM4909302 | Human | Breast | IDC | 4.81e-09 | -4.43e-01 | 0.1545 |
| 2023 | ENO1 | GSM4909304 | Human | Breast | IDC | 5.97e-07 | -1.84e-01 | 0.1636 |
| 2023 | ENO1 | GSM4909306 | Human | Breast | IDC | 1.32e-14 | -5.22e-01 | 0.1564 |
| 2023 | ENO1 | GSM4909307 | Human | Breast | IDC | 2.82e-09 | -4.78e-01 | 0.1569 |
| 2023 | ENO1 | GSM4909308 | Human | Breast | IDC | 5.37e-29 | -6.33e-01 | 0.158 |
| 2023 | ENO1 | GSM4909309 | Human | Breast | IDC | 7.07e-06 | -3.95e-01 | 0.0483 |
| 2023 | ENO1 | GSM4909311 | Human | Breast | IDC | 1.10e-42 | -8.36e-01 | 0.1534 |
| 2023 | ENO1 | GSM4909312 | Human | Breast | IDC | 4.50e-35 | -9.13e-01 | 0.1552 |
| 2023 | ENO1 | GSM4909313 | Human | Breast | IDC | 1.09e-18 | -6.59e-01 | 0.0391 |
| 2023 | ENO1 | GSM4909315 | Human | Breast | IDC | 7.68e-11 | 2.56e-01 | 0.21 |
| Page: 1 2 3 4 5 6 7 8 9 10 11 12 13 14 15 16 17 18 |
| Tissue | Expression Dynamics | Abbreviation |
| Breast | 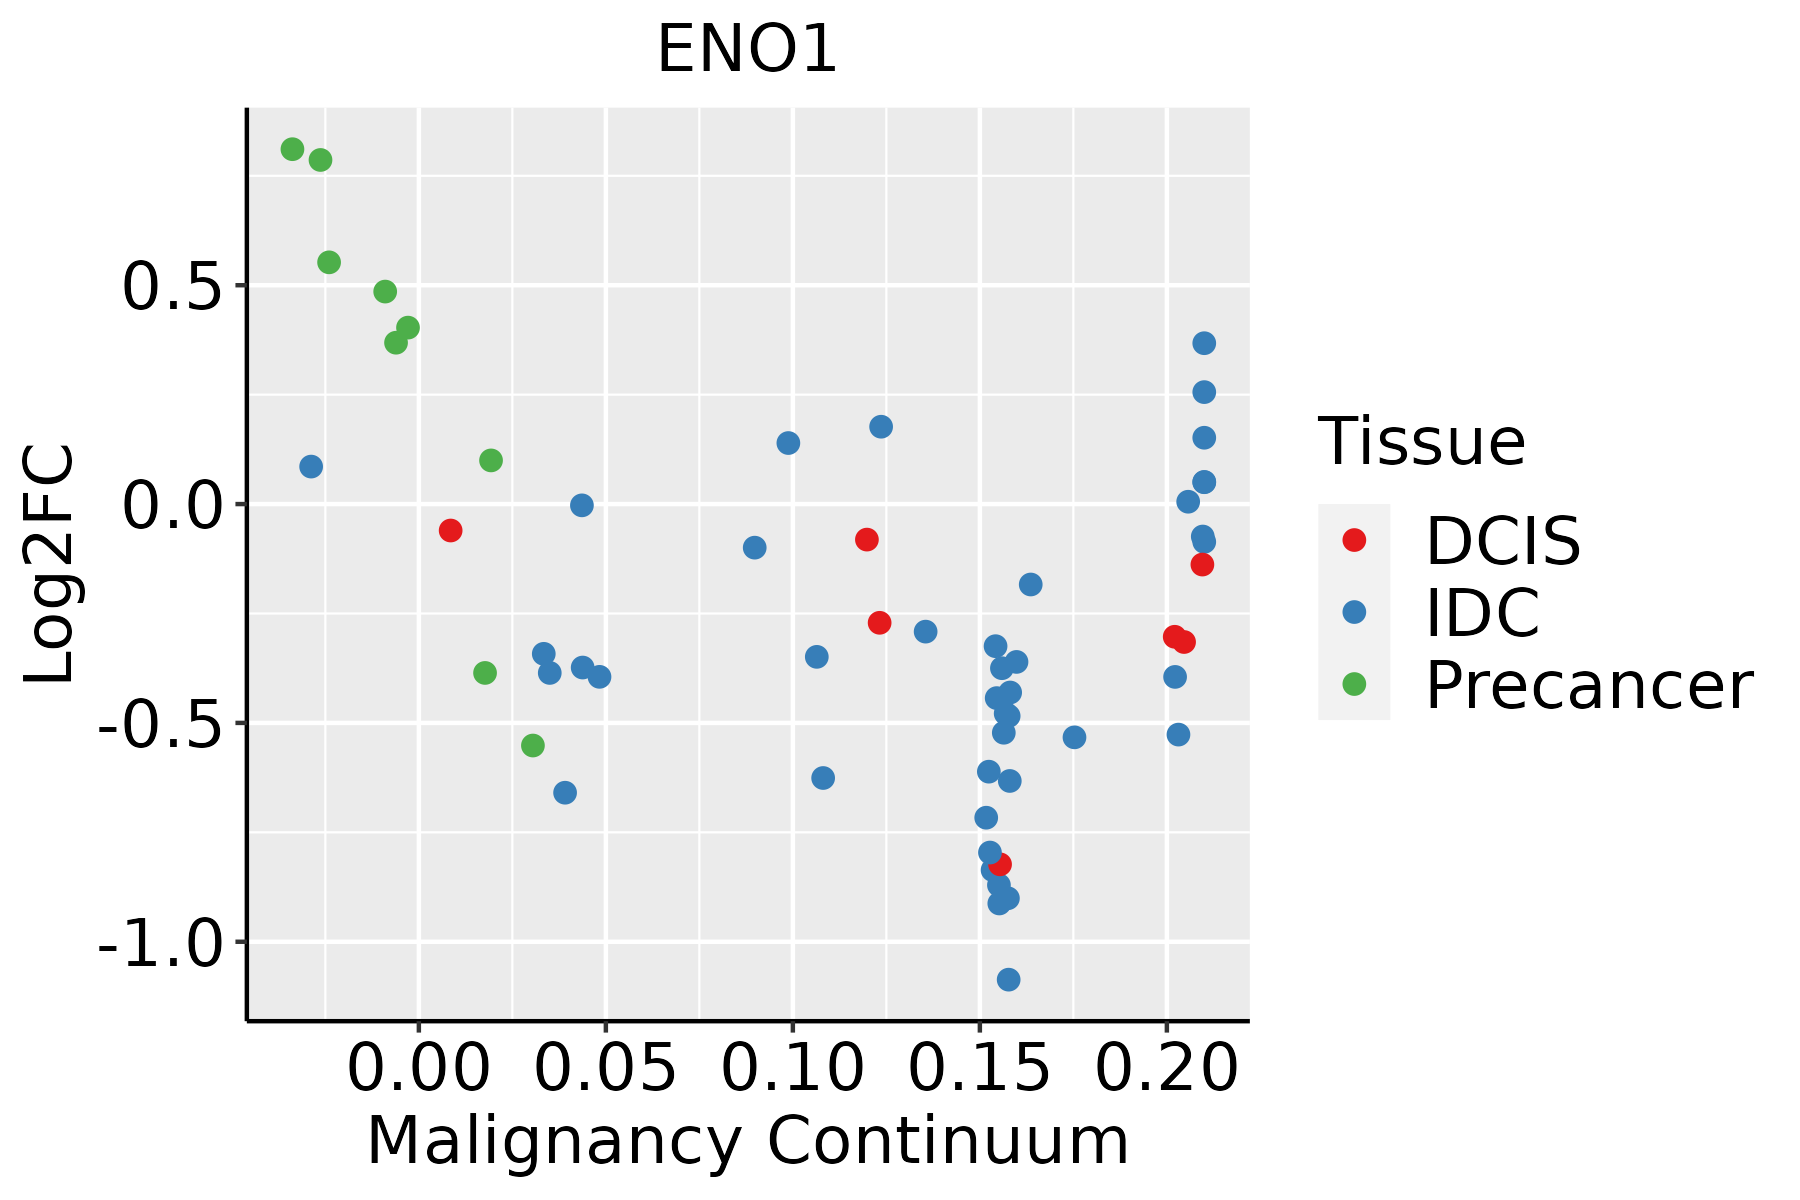 | IDC: Invasive ductal carcinoma |
| DCIS: Ductal carcinoma in situ | ||
| Precancer(BRCA1-mut): Precancerous lesion from BRCA1 mutation carriers | ||
| Cervix | 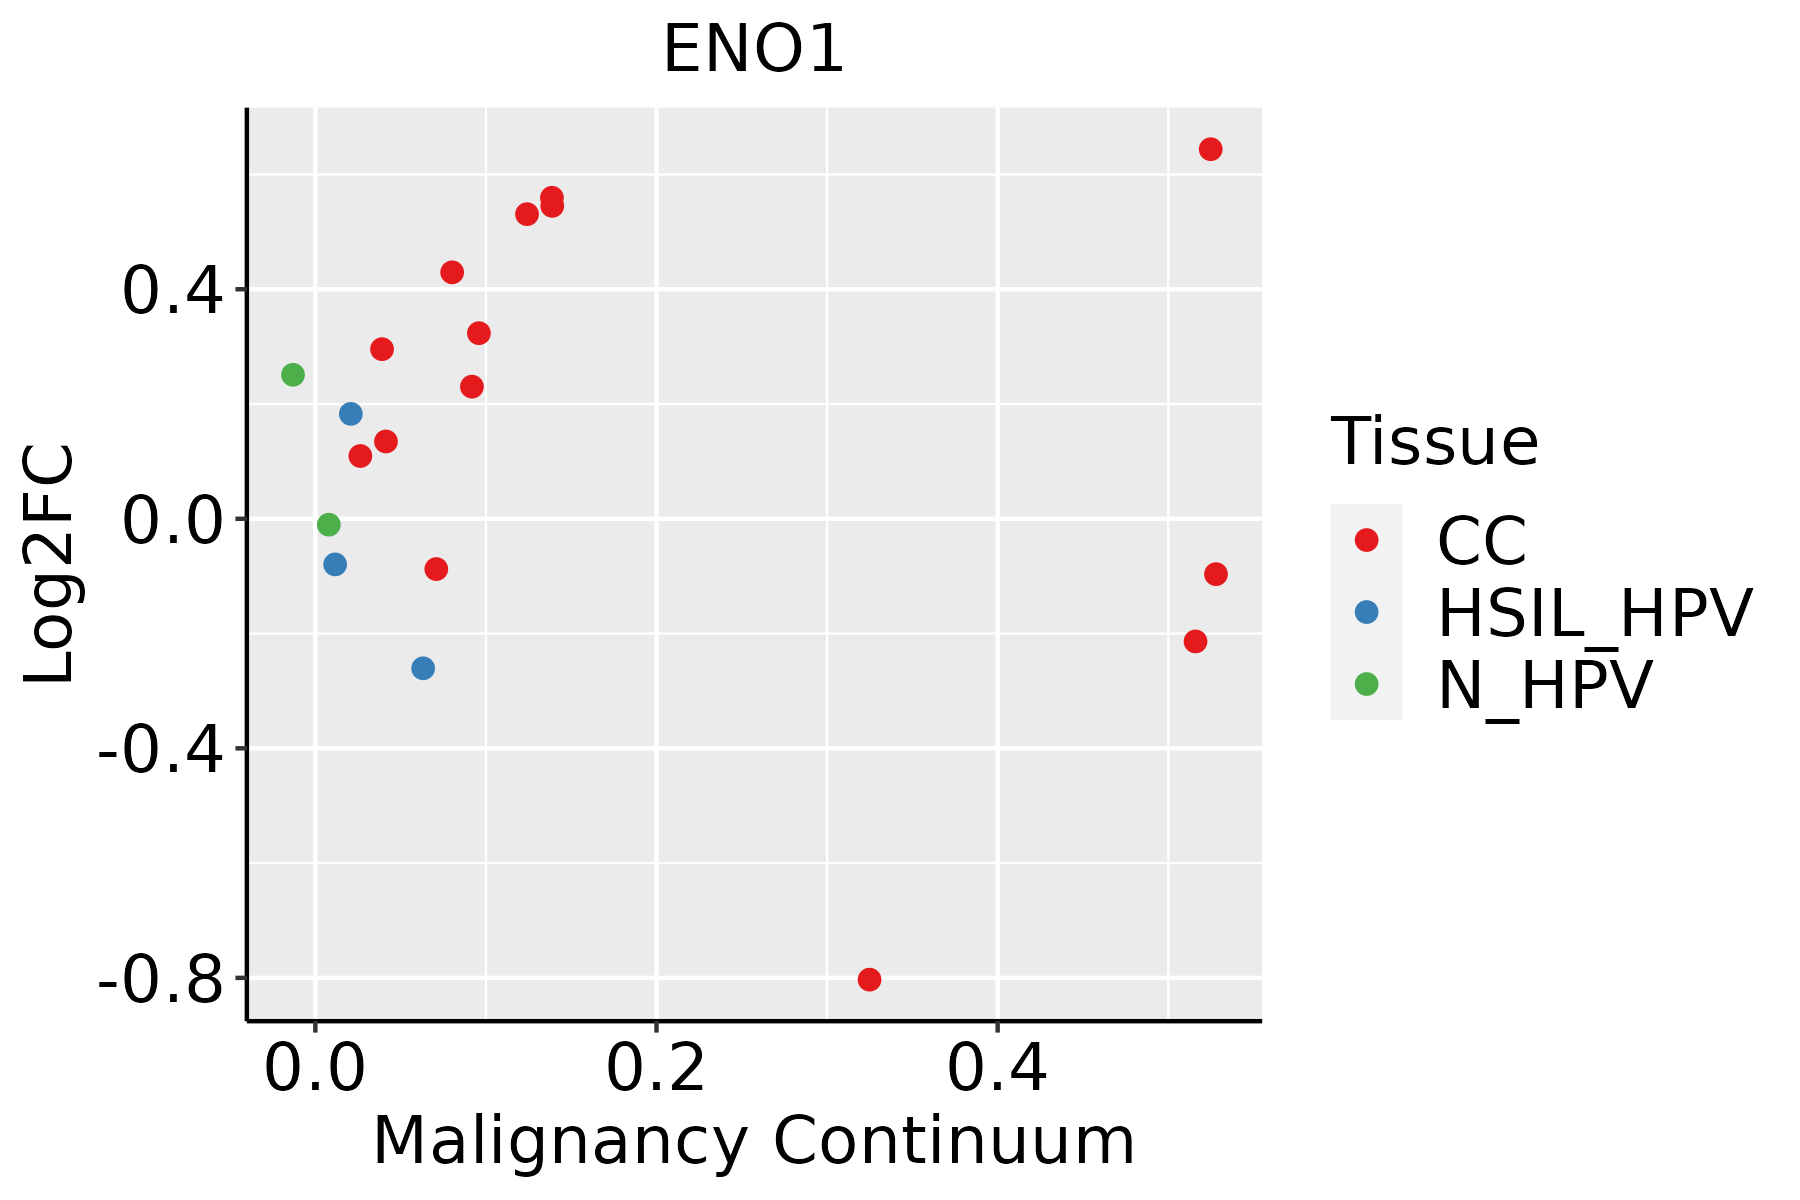 | CC: Cervix cancer |
| HSIL_HPV: HPV-infected high-grade squamous intraepithelial lesions | ||
| N_HPV: HPV-infected normal cervix | ||
| Colorectum (GSE201348) | 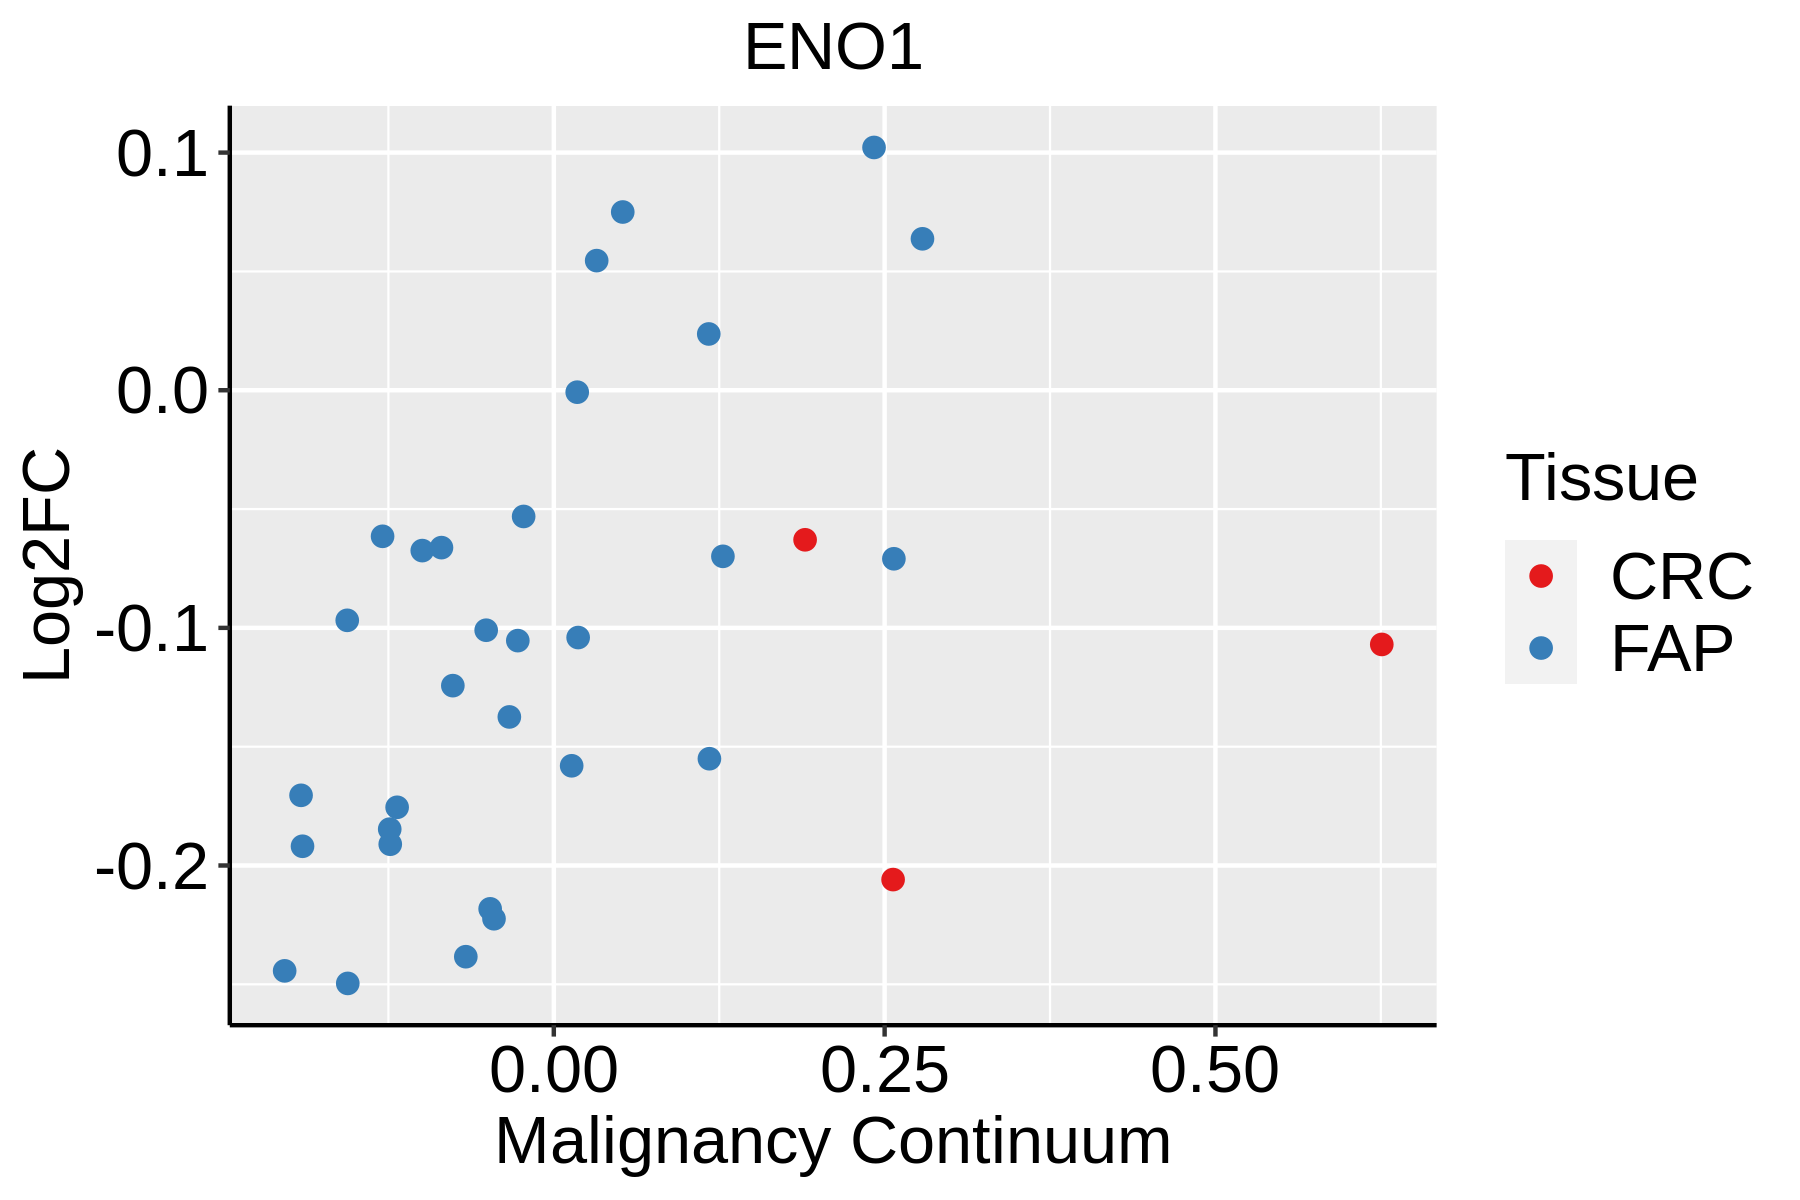 | FAP: Familial adenomatous polyposis |
| CRC: Colorectal cancer | ||
| Colorectum (HTA11) |  | AD: Adenomas |
| SER: Sessile serrated lesions | ||
| MSI-H: Microsatellite-high colorectal cancer | ||
| MSS: Microsatellite stable colorectal cancer | ||
| Endometrium | 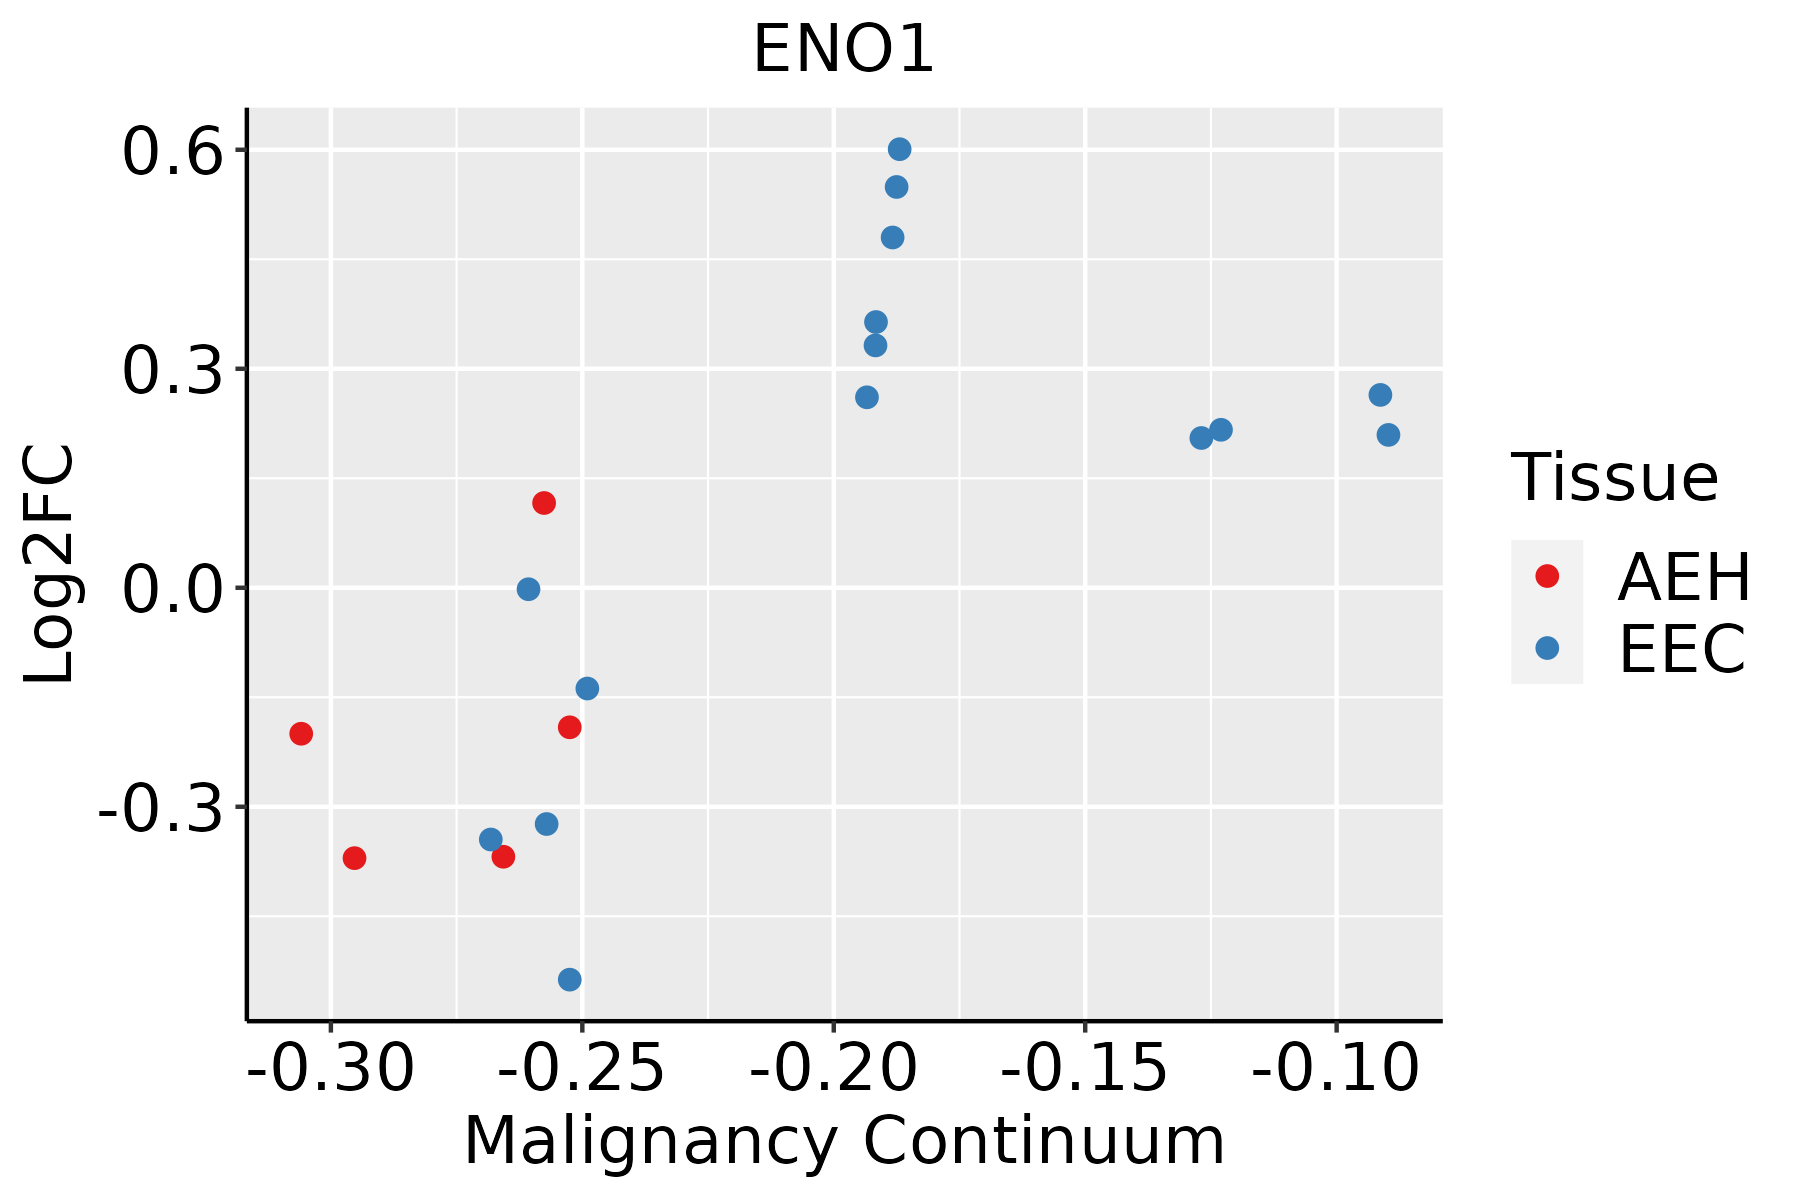 | AEH: Atypical endometrial hyperplasia |
| EEC: Endometrioid Cancer | ||
| Esophagus |  | ESCC: Esophageal squamous cell carcinoma |
| HGIN: High-grade intraepithelial neoplasias | ||
| LGIN: Low-grade intraepithelial neoplasias | ||
| GC | 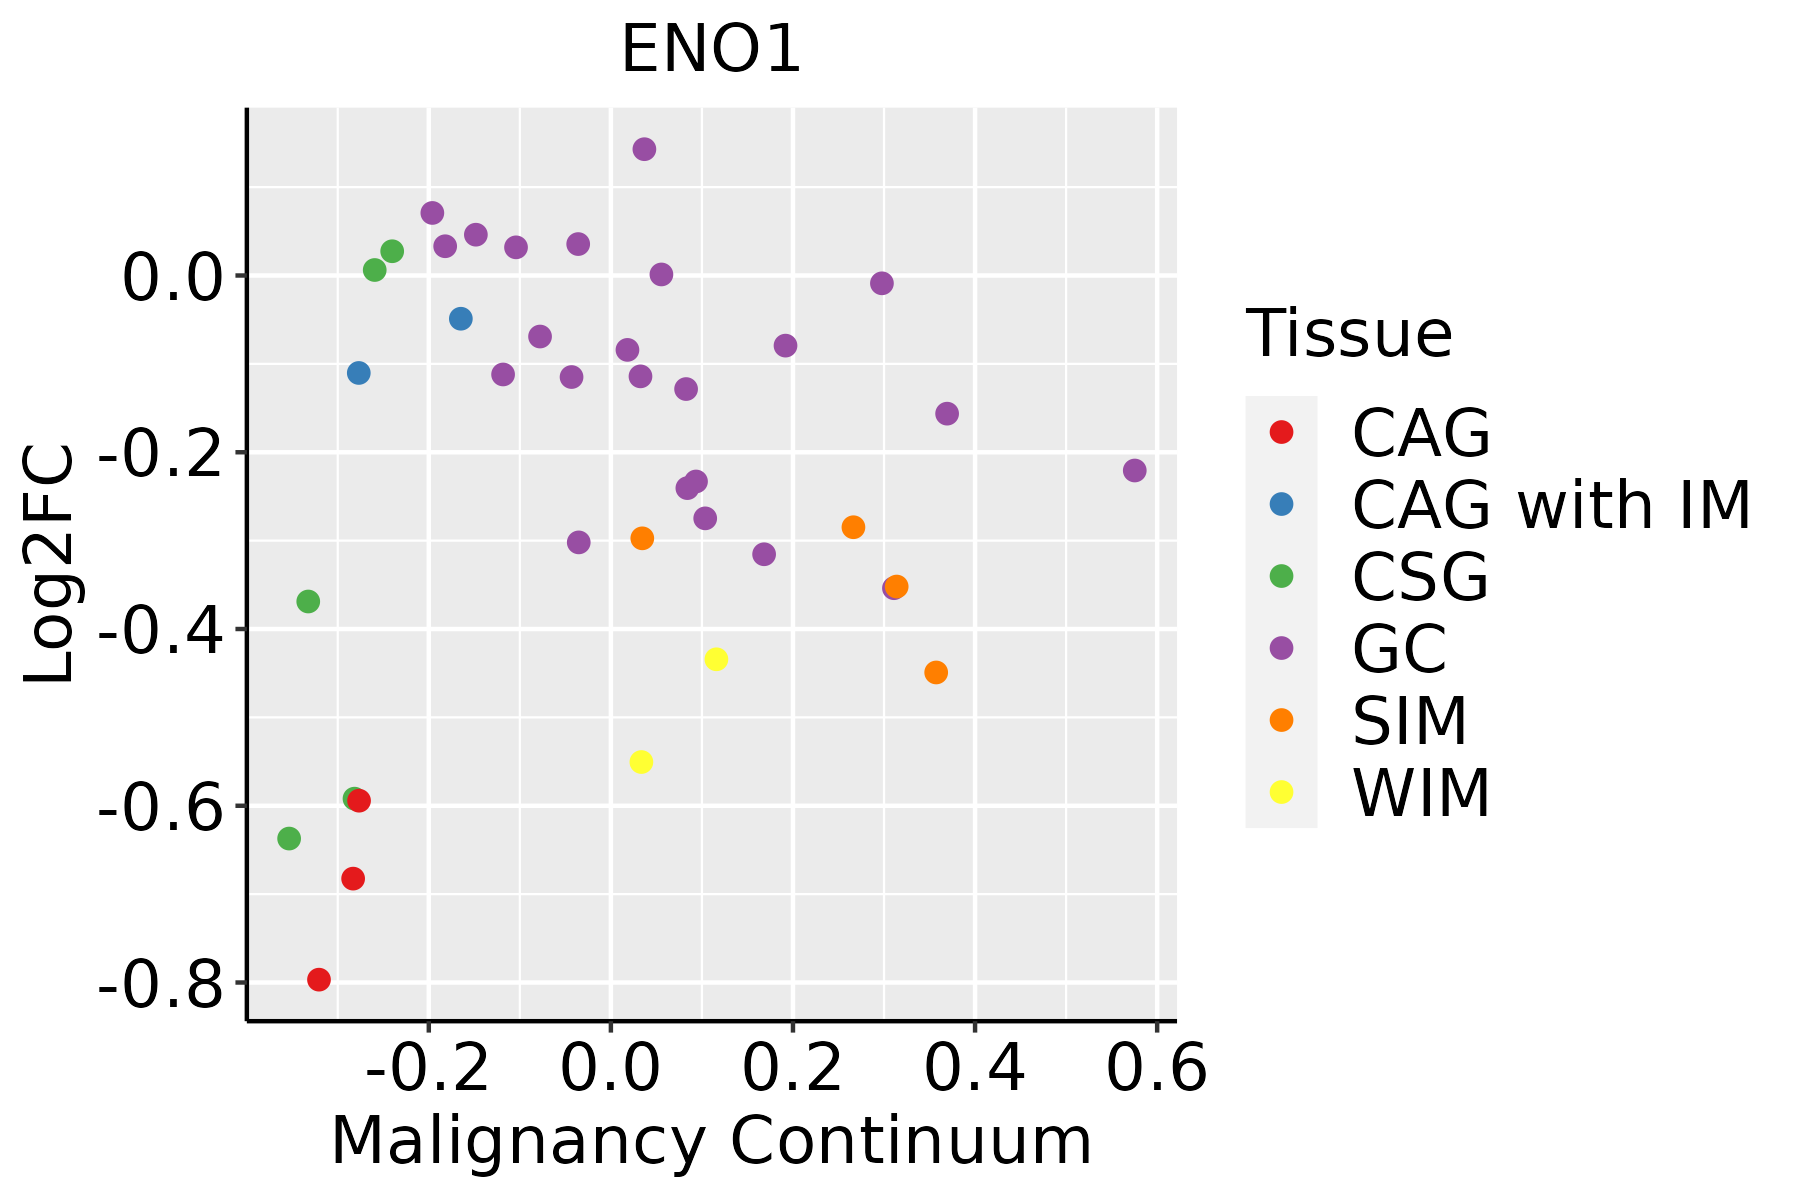 | CAG: Chronic atrophic gastritis |
| CAG with IM: Chronic atrophic gastritis with intestinal metaplasia | ||
| CSG: Chronic superficial gastritis | ||
| GC: Gastric cancer | ||
| SIM: Severe intestinal metaplasia | ||
| WIM: Wild intestinal metaplasia | ||
| Liver | 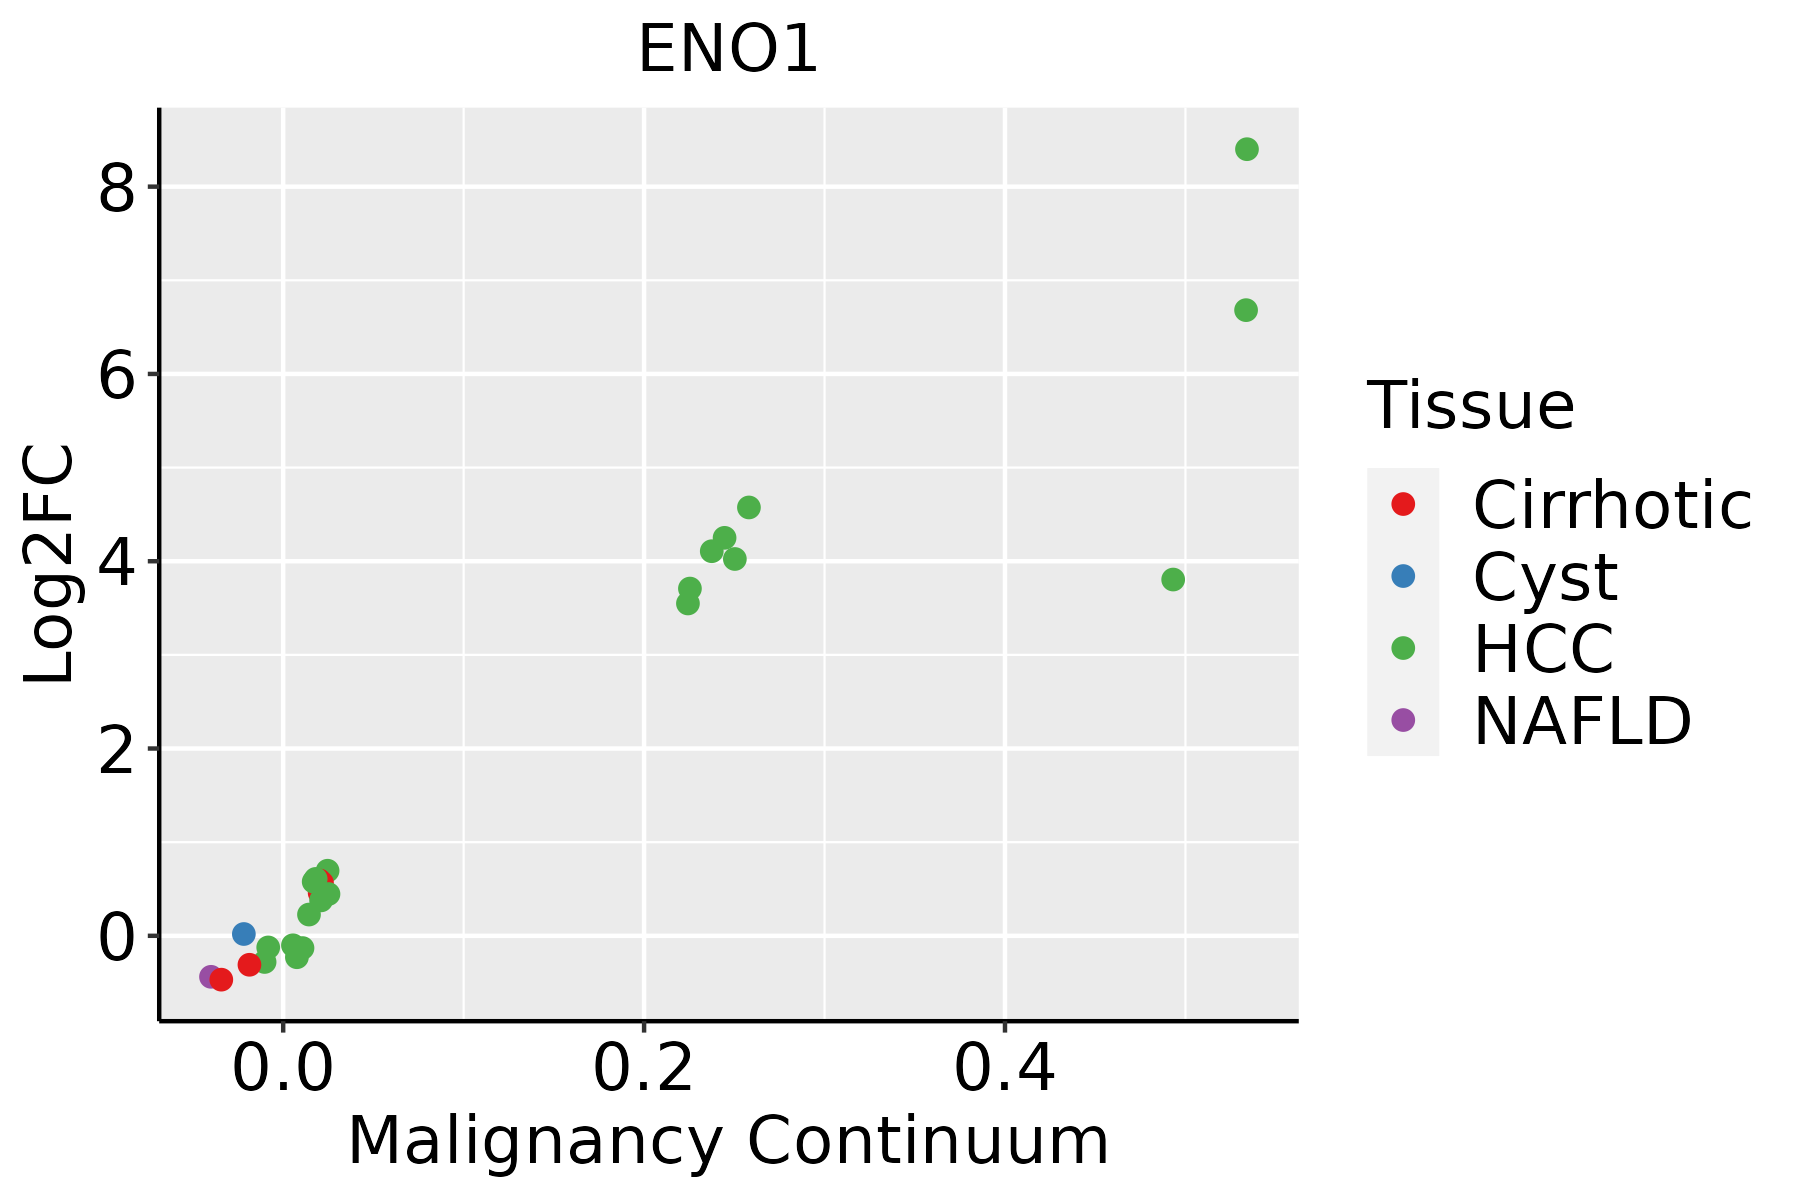 | HCC: Hepatocellular carcinoma |
| NAFLD: Non-alcoholic fatty liver disease | ||
| Lung |  | AAH: Atypical adenomatous hyperplasia |
| AIS: Adenocarcinoma in situ | ||
| IAC: Invasive lung adenocarcinoma | ||
| MIA: Minimally invasive adenocarcinoma | ||
| Oral Cavity | 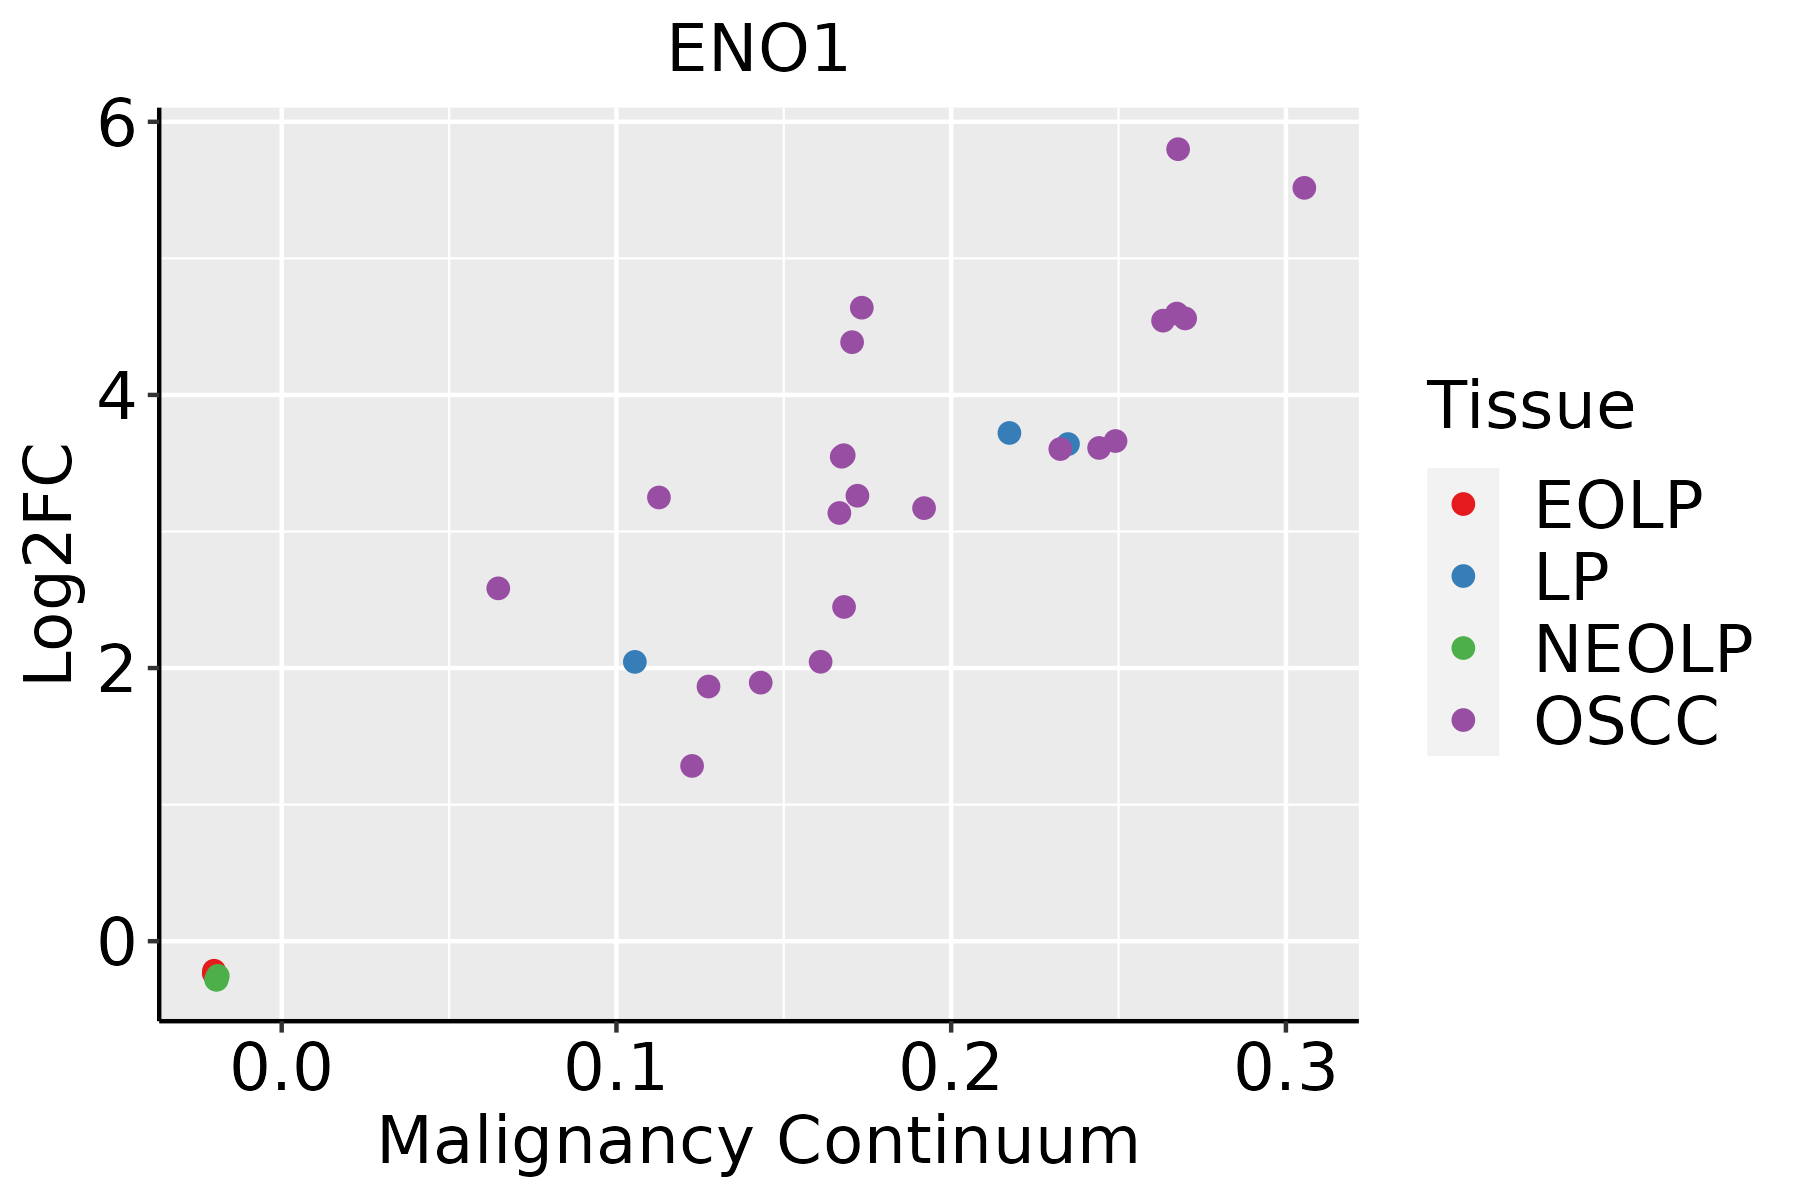 | EOLP: Erosive Oral lichen planus |
| LP: leukoplakia | ||
| NEOLP: Non-erosive oral lichen planus | ||
| OSCC: Oral squamous cell carcinoma | ||
| Prostate | 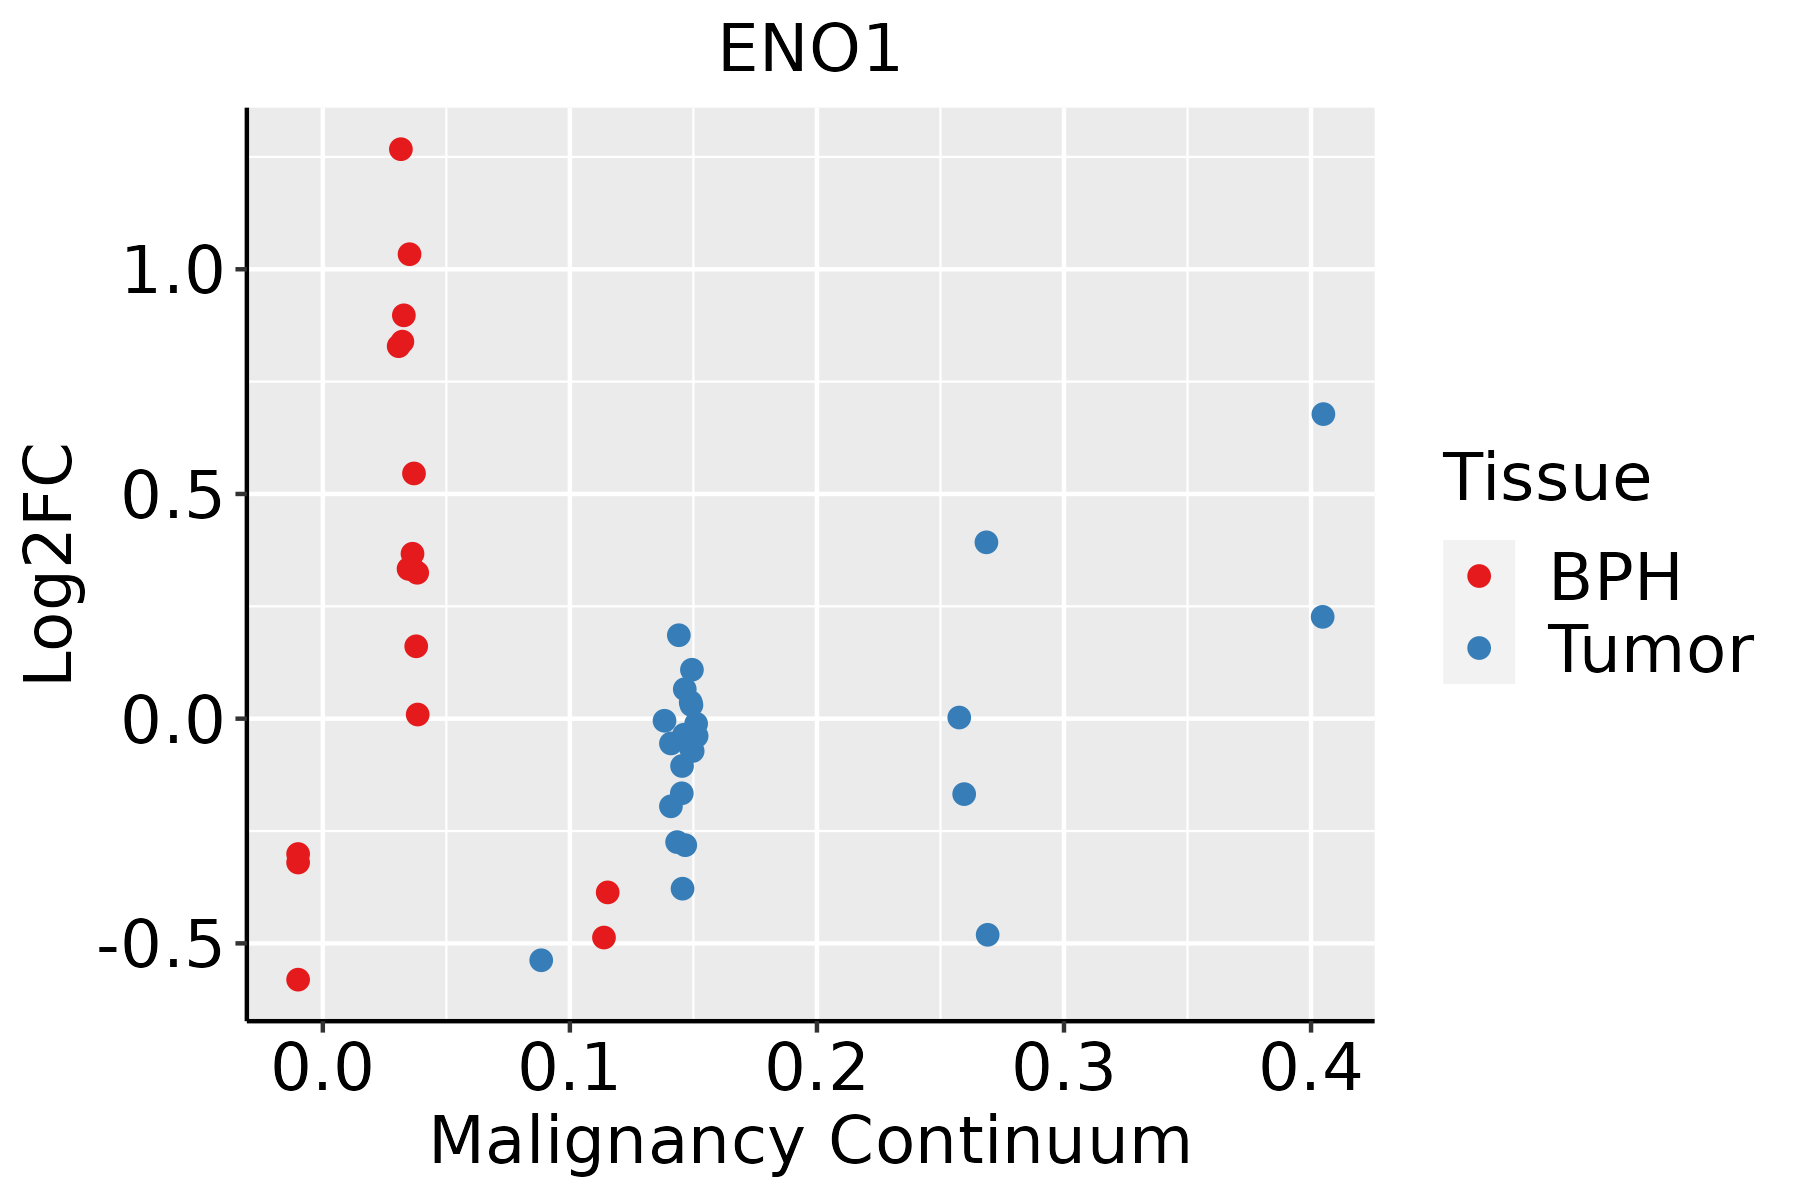 | BPH: Benign Prostatic Hyperplasia |
| Skin |  | AK: Actinic keratosis |
| cSCC: Cutaneous squamous cell carcinoma | ||
| SCCIS:squamous cell carcinoma in situ | ||
| Thyroid | 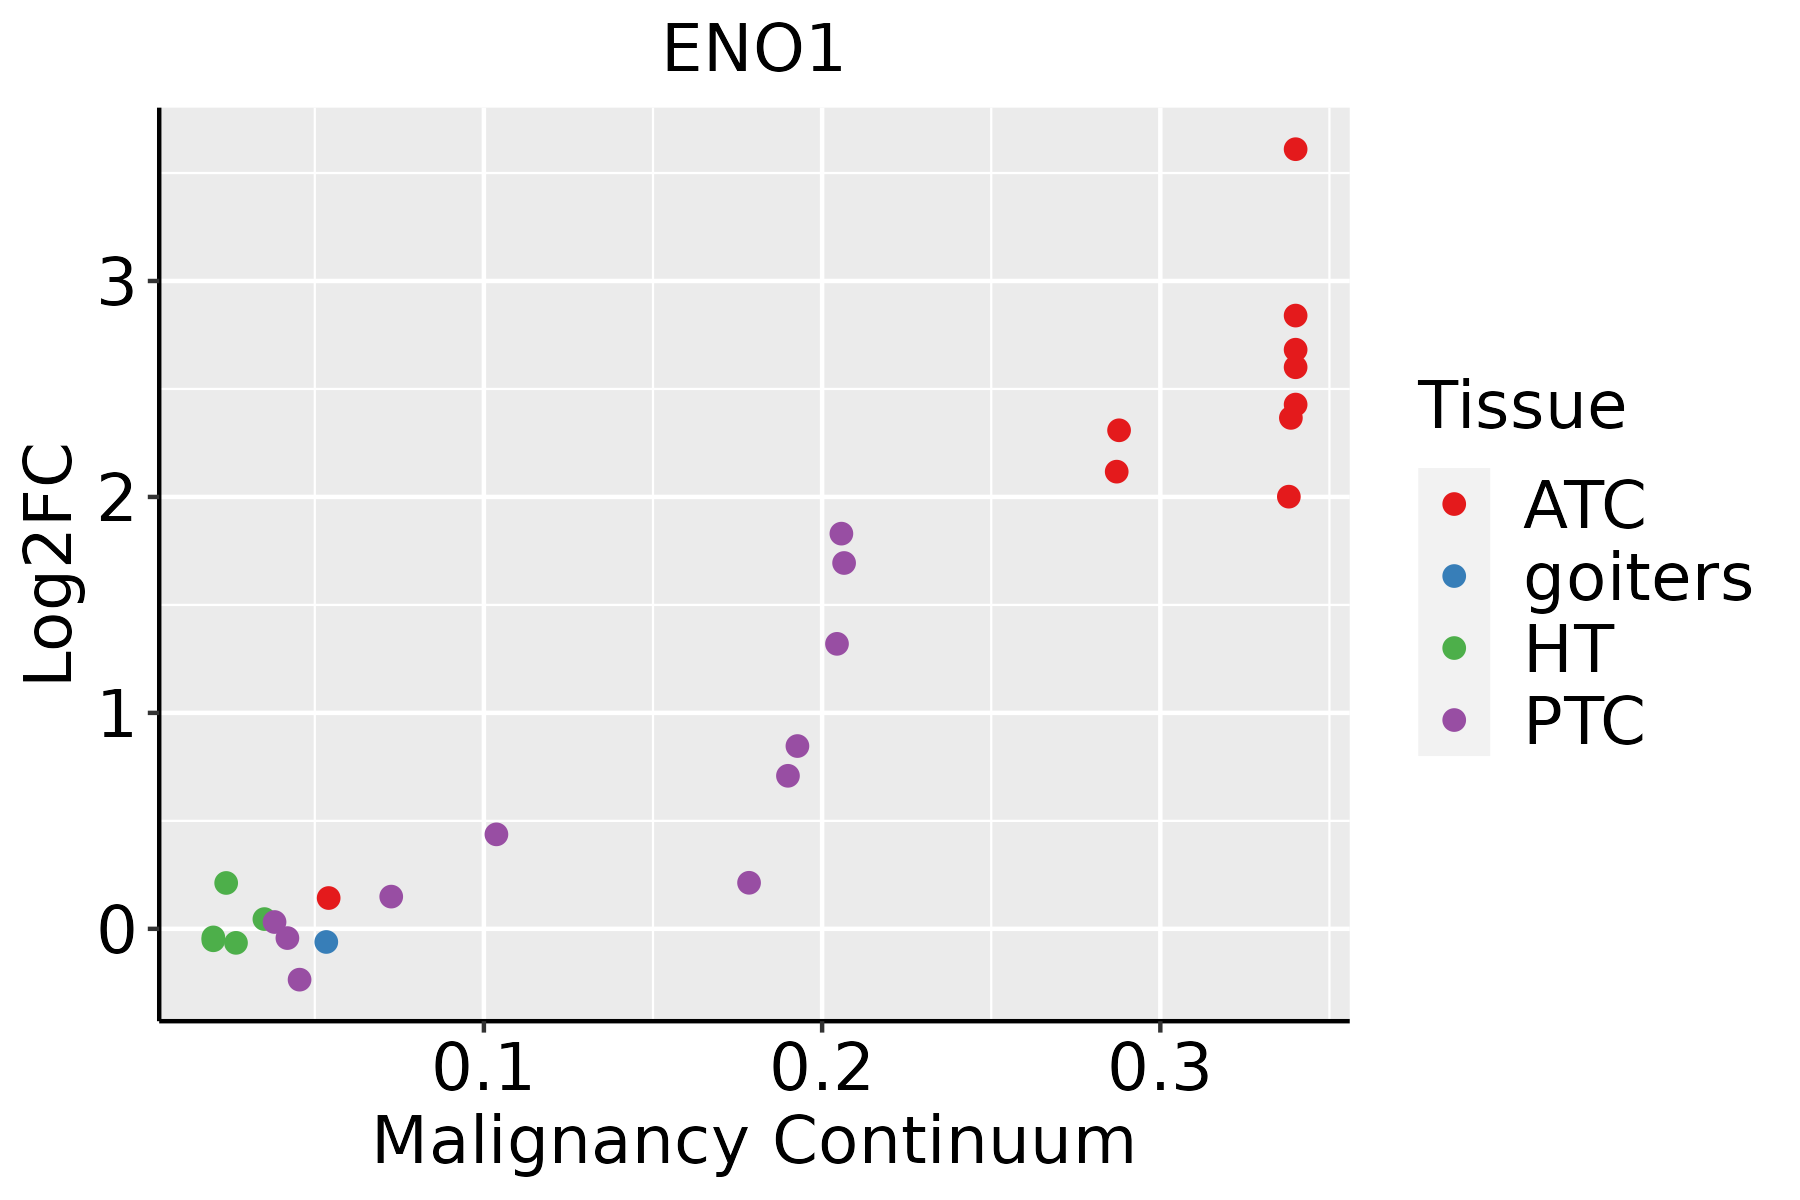 | ATC: Anaplastic thyroid cancer |
| HT: Hashimoto's thyroiditis | ||
| PTC: Papillary thyroid cancer |
| ∗log2FC in expression of this searched gene in stem-like cells from each diseased tissue sample relative to stem-like cells in normal samples in each tissue plotted against the malignancy continuum. Samples are colored based on if they are from different disease stage. |
Top |
Malignant transformation related pathway analysis |
| Find out the enriched GO biological processes and KEGG pathways involved in transition from healthy to precancer to cancer |
| Tissue | Disease Stage | Enriched GO biological Processes |
| Colorectum | AD |  |
| Colorectum | SER |  |
| Colorectum | MSS |  |
| Colorectum | MSI-H |  |
| Colorectum | FAP |  |
| ∗Top 15 enriched GO BP terms are showed in the bar plot of each disease state in each tissue. Each row represents a significant GO biological process which is colored according to the -log10(p.adjust). |
| Page: 1 2 3 4 5 6 7 8 9 |
| GO ID | Tissue | Disease Stage | Description | Gene Ratio | Bg Ratio | pvalue | p.adjust | Count |
| GO:00460349 | Breast | Precancer | ATP metabolic process | 82/1080 | 277/18723 | 1.94e-36 | 5.19e-33 | 82 |
| GO:00060918 | Breast | Precancer | generation of precursor metabolites and energy | 94/1080 | 490/18723 | 1.54e-25 | 1.64e-22 | 94 |
| GO:00971939 | Breast | Precancer | intrinsic apoptotic signaling pathway | 59/1080 | 288/18723 | 8.07e-18 | 3.60e-15 | 59 |
| GO:20012339 | Breast | Precancer | regulation of apoptotic signaling pathway | 65/1080 | 356/18723 | 7.70e-17 | 3.17e-14 | 65 |
| GO:20012429 | Breast | Precancer | regulation of intrinsic apoptotic signaling pathway | 41/1080 | 164/18723 | 6.48e-16 | 2.31e-13 | 41 |
| GO:00067547 | Breast | Precancer | ATP biosynthetic process | 21/1080 | 57/18723 | 2.31e-12 | 4.26e-10 | 21 |
| GO:00362939 | Breast | Precancer | response to decreased oxygen levels | 53/1080 | 322/18723 | 4.09e-12 | 6.84e-10 | 53 |
| GO:00016669 | Breast | Precancer | response to hypoxia | 51/1080 | 307/18723 | 7.33e-12 | 1.11e-09 | 51 |
| GO:00704829 | Breast | Precancer | response to oxygen levels | 55/1080 | 347/18723 | 7.47e-12 | 1.11e-09 | 55 |
| GO:00092067 | Breast | Precancer | purine ribonucleoside triphosphate biosynthetic process | 22/1080 | 68/18723 | 1.41e-11 | 1.88e-09 | 22 |
| GO:00091457 | Breast | Precancer | purine nucleoside triphosphate biosynthetic process | 22/1080 | 69/18723 | 1.95e-11 | 2.43e-09 | 22 |
| GO:00092017 | Breast | Precancer | ribonucleoside triphosphate biosynthetic process | 22/1080 | 74/18723 | 9.18e-11 | 1.00e-08 | 22 |
| GO:00091448 | Breast | Precancer | purine nucleoside triphosphate metabolic process | 24/1080 | 88/18723 | 9.66e-11 | 1.03e-08 | 24 |
| GO:00092057 | Breast | Precancer | purine ribonucleoside triphosphate metabolic process | 23/1080 | 82/18723 | 1.27e-10 | 1.34e-08 | 23 |
| GO:00091427 | Breast | Precancer | nucleoside triphosphate biosynthetic process | 23/1080 | 85/18723 | 2.82e-10 | 2.69e-08 | 23 |
| GO:20012349 | Breast | Precancer | negative regulation of apoptotic signaling pathway | 39/1080 | 224/18723 | 5.35e-10 | 4.77e-08 | 39 |
| GO:00091997 | Breast | Precancer | ribonucleoside triphosphate metabolic process | 23/1080 | 89/18723 | 7.65e-10 | 6.66e-08 | 23 |
| GO:00091418 | Breast | Precancer | nucleoside triphosphate metabolic process | 26/1080 | 112/18723 | 7.72e-10 | 6.66e-08 | 26 |
| GO:00362948 | Breast | Precancer | cellular response to decreased oxygen levels | 31/1080 | 161/18723 | 2.61e-09 | 2.11e-07 | 31 |
| GO:20012439 | Breast | Precancer | negative regulation of intrinsic apoptotic signaling pathway | 23/1080 | 98/18723 | 5.82e-09 | 4.45e-07 | 23 |
| Page: 1 2 3 4 5 6 7 8 9 10 11 12 13 14 15 16 17 18 19 20 21 22 23 24 25 26 27 28 29 30 31 32 33 34 35 36 37 38 39 40 41 42 43 44 45 46 47 48 49 50 51 52 53 54 55 56 57 58 59 60 61 62 63 64 65 66 67 68 69 70 71 72 73 74 75 76 77 78 79 80 81 82 83 84 85 86 87 88 89 90 |
| Pathway ID | Tissue | Disease Stage | Description | Gene Ratio | Bg Ratio | pvalue | p.adjust | qvalue | Count |
| hsa0406616 | Breast | Precancer | HIF-1 signaling pathway | 23/684 | 109/8465 | 1.51e-05 | 1.59e-04 | 1.22e-04 | 23 |
| hsa0001010 | Breast | Precancer | Glycolysis / Gluconeogenesis | 13/684 | 67/8465 | 2.39e-03 | 1.51e-02 | 1.16e-02 | 13 |
| hsa030186 | Breast | Precancer | RNA degradation | 14/684 | 79/8465 | 3.97e-03 | 2.37e-02 | 1.81e-02 | 14 |
| hsa0120012 | Breast | Precancer | Carbon metabolism | 18/684 | 115/8465 | 4.79e-03 | 2.75e-02 | 2.11e-02 | 18 |
| hsa0406617 | Breast | Precancer | HIF-1 signaling pathway | 23/684 | 109/8465 | 1.51e-05 | 1.59e-04 | 1.22e-04 | 23 |
| hsa0001013 | Breast | Precancer | Glycolysis / Gluconeogenesis | 13/684 | 67/8465 | 2.39e-03 | 1.51e-02 | 1.16e-02 | 13 |
| hsa0301811 | Breast | Precancer | RNA degradation | 14/684 | 79/8465 | 3.97e-03 | 2.37e-02 | 1.81e-02 | 14 |
| hsa0120013 | Breast | Precancer | Carbon metabolism | 18/684 | 115/8465 | 4.79e-03 | 2.75e-02 | 2.11e-02 | 18 |
| hsa0406623 | Breast | IDC | HIF-1 signaling pathway | 22/867 | 109/8465 | 1.36e-03 | 1.00e-02 | 7.50e-03 | 22 |
| hsa0301821 | Breast | IDC | RNA degradation | 16/867 | 79/8465 | 5.65e-03 | 3.13e-02 | 2.34e-02 | 16 |
| hsa0406633 | Breast | IDC | HIF-1 signaling pathway | 22/867 | 109/8465 | 1.36e-03 | 1.00e-02 | 7.50e-03 | 22 |
| hsa0301831 | Breast | IDC | RNA degradation | 16/867 | 79/8465 | 5.65e-03 | 3.13e-02 | 2.34e-02 | 16 |
| hsa0406642 | Breast | DCIS | HIF-1 signaling pathway | 22/846 | 109/8465 | 9.83e-04 | 7.05e-03 | 5.20e-03 | 22 |
| hsa030184 | Breast | DCIS | RNA degradation | 16/846 | 79/8465 | 4.45e-03 | 2.46e-02 | 1.82e-02 | 16 |
| hsa0406652 | Breast | DCIS | HIF-1 signaling pathway | 22/846 | 109/8465 | 9.83e-04 | 7.05e-03 | 5.20e-03 | 22 |
| hsa030185 | Breast | DCIS | RNA degradation | 16/846 | 79/8465 | 4.45e-03 | 2.46e-02 | 1.82e-02 | 16 |
| hsa0406618 | Cervix | CC | HIF-1 signaling pathway | 27/1267 | 109/8465 | 4.72e-03 | 1.64e-02 | 9.72e-03 | 27 |
| hsa0406619 | Cervix | CC | HIF-1 signaling pathway | 27/1267 | 109/8465 | 4.72e-03 | 1.64e-02 | 9.72e-03 | 27 |
| hsa01200 | Colorectum | AD | Carbon metabolism | 55/2092 | 115/8465 | 5.53e-08 | 8.42e-07 | 5.37e-07 | 55 |
| hsa00010 | Colorectum | AD | Glycolysis / Gluconeogenesis | 34/2092 | 67/8465 | 3.63e-06 | 4.34e-05 | 2.77e-05 | 34 |
| Page: 1 2 3 4 5 6 7 |
Top |
Cell-cell communication analysis |
| Identification of potential cell-cell interactions between two cell types and their ligand-receptor pairs for different disease states |
| Ligand | Receptor | LRpair | Pathway | Tissue | Disease Stage |
| Page: 1 |
Top |
Single-cell gene regulatory network inference analysis |
| Find out the significant the regulons (TFs) and the target genes of each regulon across cell types for different disease states |
| TF | Cell Type | Tissue | Disease Stage | Target Gene | RSS | Regulon Activity |
| ENO1 | ICAF | Cervix | CC | CTSL,TPI1,PPP1R14B, etc. | 2.69e-01 |  |
| ENO1 | FIB | Cervix | HSIL_HPV | CTSL,TPI1,PPP1R14B, etc. | 3.17e-02 |  |
| ENO1 | ICAF | Cervix | N_HPV | CTSL,TPI1,PPP1R14B, etc. | 1.29e-01 |  |
| ENO1 | SURF | Endometrium | EEC | PKM,PGK1,MYDGF, etc. | 3.60e-01 |  |
| ENO1 | STM | Prostate | Healthy | EIF4A1,PKM,RAN, etc. | 4.60e-01 |  |
| ∗The dot plots of a searched regulon are shown for all cell subpopulations in each disease state of each tissue based on the regulon specific score inferred using pySCENIC and by calculating the average expression. |
| Page: 1 |
Top |
Somatic mutation of malignant transformation related genes |
| Annotation of somatic variants for genes involved in malignant transformation |
| Hugo Symbol | Variant Class | Variant Classification | dbSNP RS | HGVSc | HGVSp | HGVSp Short | SWISSPROT | BIOTYPE | SIFT | PolyPhen | Tumor Sample Barcode | Tissue | Histology | Sex | Age | Stage | Therapy Types | Drugs | Outcome |
| ENO1 | SNV | Missense_Mutation | c.689C>A | p.Ala230Asp | p.A230D | P06733 | protein_coding | deleterious_low_confidence(0) | probably_damaging(0.988) | TCGA-A7-A0DB-01 | Breast | breast invasive carcinoma | Female | <65 | I/II | Hormone Therapy | arimidex | SD | |
| ENO1 | SNV | Missense_Mutation | rs750183904 | c.466N>A | p.Gly156Ser | p.G156S | P06733 | protein_coding | deleterious_low_confidence(0.05) | possibly_damaging(0.594) | TCGA-E9-A22H-01 | Breast | breast invasive carcinoma | Female | <65 | I/II | Chemotherapy | doxorubicin | SD |
| ENO1 | insertion | Nonsense_Mutation | novel | c.945_946insATTTTATTTTTATTTTTTTGAGAGGGATCTCACTC | p.Val316IlefsTer7 | p.V316Ifs*7 | P06733 | protein_coding | TCGA-AO-A0JB-01 | Breast | breast invasive carcinoma | Female | <65 | III/IV | Chemotherapy | cyclophosphamide | SD | ||
| ENO1 | SNV | Missense_Mutation | c.1240G>A | p.Glu414Lys | p.E414K | P06733 | protein_coding | deleterious_low_confidence(0.01) | probably_damaging(0.984) | TCGA-C5-A7CH-01 | Cervix | cervical & endocervical cancer | Female | <65 | I/II | Unspecific | SD | ||
| ENO1 | SNV | Missense_Mutation | rs527568599 | c.452N>G | p.Asn151Ser | p.N151S | P06733 | protein_coding | deleterious_low_confidence(0.05) | benign(0.083) | TCGA-EX-A1H6-01 | Cervix | cervical & endocervical cancer | Female | <65 | I/II | Unknown | Unknown | SD |
| ENO1 | SNV | Missense_Mutation | novel | c.628N>A | p.Glu210Lys | p.E210K | P06733 | protein_coding | deleterious_low_confidence(0) | possibly_damaging(0.796) | TCGA-MA-AA41-01 | Cervix | cervical & endocervical cancer | Female | <65 | I/II | Unknown | Unknown | SD |
| ENO1 | insertion | Frame_Shift_Ins | novel | c.1081dupC | p.Gln361ProfsTer17 | p.Q361Pfs*17 | P06733 | protein_coding | TCGA-C5-A1M7-01 | Cervix | cervical & endocervical cancer | Female | <65 | I/II | Unknown | Unknown | SD | ||
| ENO1 | SNV | Missense_Mutation | novel | c.97G>C | p.Ala33Pro | p.A33P | P06733 | protein_coding | deleterious_low_confidence(0) | probably_damaging(0.998) | TCGA-AA-A01D-01 | Colorectum | colon adenocarcinoma | Female | <65 | III/IV | Chemotherapy | capecitabine | PD |
| ENO1 | SNV | Missense_Mutation | c.223C>G | p.Pro75Ala | p.P75A | P06733 | protein_coding | deleterious_low_confidence(0.03) | benign(0.046) | TCGA-AD-6965-01 | Colorectum | colon adenocarcinoma | Male | <65 | III/IV | Chemotherapy | oxaliplatin | PD | |
| ENO1 | SNV | Missense_Mutation | c.1286G>A | p.Arg429Lys | p.R429K | P06733 | protein_coding | deleterious_low_confidence(0.03) | possibly_damaging(0.861) | TCGA-CK-4951-01 | Colorectum | colon adenocarcinoma | Female | >=65 | I/II | Unknown | Unknown | PD |
| Page: 1 2 3 4 5 |
Top |
Related drugs of malignant transformation related genes |
| Identification of chemicals and drugs interact with genes involved in malignant transfromation |
| (DGIdb 4.0) |
| Entrez ID | Symbol | Category | Interaction Types | Drug Claim Name | Drug Name | PMIDs |
| Page: 1 |

Copyright 2023-Present -The University of Texas Health Science Center at Houston |