
|
|||||
|
 | |
| |
| |
| |
| |
| |
|
Gene: ENGASE |
Gene summary for ENGASE |
| Gene information | Species | Human | Gene symbol | ENGASE | Gene ID | 64772 |
| Gene name | endo-beta-N-acetylglucosaminidase | |
| Gene Alias | ENGASE | |
| Cytomap | 17q25.3 | |
| Gene Type | protein-coding | GO ID | GO:0006457 | UniProtAcc | Q8NFI3 |
Top |
Malignant transformation analysis |
| Identification of the aberrant gene expression in precancerous and cancerous lesions by comparing the gene expression of stem-like cells in diseased tissues with normal stem cells |
| Entrez ID | Symbol | Replicates | Species | Organ | Tissue | Adj P-value | Log2FC | Malignancy |
| 64772 | ENGASE | HTA11_3410_2000001011 | Human | Colorectum | AD | 9.91e-03 | 1.51e-01 | 0.0155 |
| 64772 | ENGASE | HTA11_866_3004761011 | Human | Colorectum | AD | 5.44e-07 | 3.42e-01 | 0.096 |
| 64772 | ENGASE | HTA11_7696_3000711011 | Human | Colorectum | AD | 1.30e-02 | 2.23e-01 | 0.0674 |
| 64772 | ENGASE | HTA11_99999971662_82457 | Human | Colorectum | MSS | 1.14e-08 | 5.50e-01 | 0.3859 |
| 64772 | ENGASE | HTA11_99999974143_84620 | Human | Colorectum | MSS | 9.04e-10 | 5.71e-01 | 0.3005 |
| 64772 | ENGASE | A015-C-203 | Human | Colorectum | FAP | 1.38e-07 | 3.43e-01 | -0.1294 |
| 64772 | ENGASE | A002-C-201 | Human | Colorectum | FAP | 1.12e-08 | 5.54e-01 | 0.0324 |
| 64772 | ENGASE | A002-C-203 | Human | Colorectum | FAP | 1.21e-03 | 3.82e-01 | 0.2786 |
| 64772 | ENGASE | A002-C-021 | Human | Colorectum | FAP | 6.84e-06 | 3.61e-01 | 0.1171 |
| 64772 | ENGASE | A002-C-205 | Human | Colorectum | FAP | 1.19e-02 | 2.55e-01 | -0.1236 |
| 64772 | ENGASE | A002-C-114 | Human | Colorectum | FAP | 4.53e-04 | 3.67e-01 | -0.1561 |
| 64772 | ENGASE | A015-C-104 | Human | Colorectum | FAP | 5.24e-03 | 2.22e-01 | -0.1899 |
| 64772 | ENGASE | A015-C-202 | Human | Colorectum | FAP | 7.51e-05 | 3.80e-01 | -0.0849 |
| 64772 | ENGASE | A002-C-116 | Human | Colorectum | FAP | 3.81e-03 | 3.23e-02 | -0.0452 |
| 64772 | ENGASE | A014-C-008 | Human | Colorectum | FAP | 2.34e-04 | 4.36e-01 | -0.191 |
| 64772 | ENGASE | CRC-1-8810 | Human | Colorectum | CRC | 2.11e-06 | 5.34e-01 | 0.6257 |
| 64772 | ENGASE | CRC-3-11773 | Human | Colorectum | CRC | 5.11e-11 | 5.34e-01 | 0.2564 |
| 64772 | ENGASE | LZE24T | Human | Esophagus | ESCC | 1.88e-05 | 1.07e-01 | 0.0596 |
| 64772 | ENGASE | P1T-E | Human | Esophagus | ESCC | 1.89e-02 | 1.29e-01 | 0.0875 |
| 64772 | ENGASE | P2T-E | Human | Esophagus | ESCC | 9.38e-09 | 1.45e-01 | 0.1177 |
| Page: 1 2 3 |
| Tissue | Expression Dynamics | Abbreviation |
| Colorectum (GSE201348) | 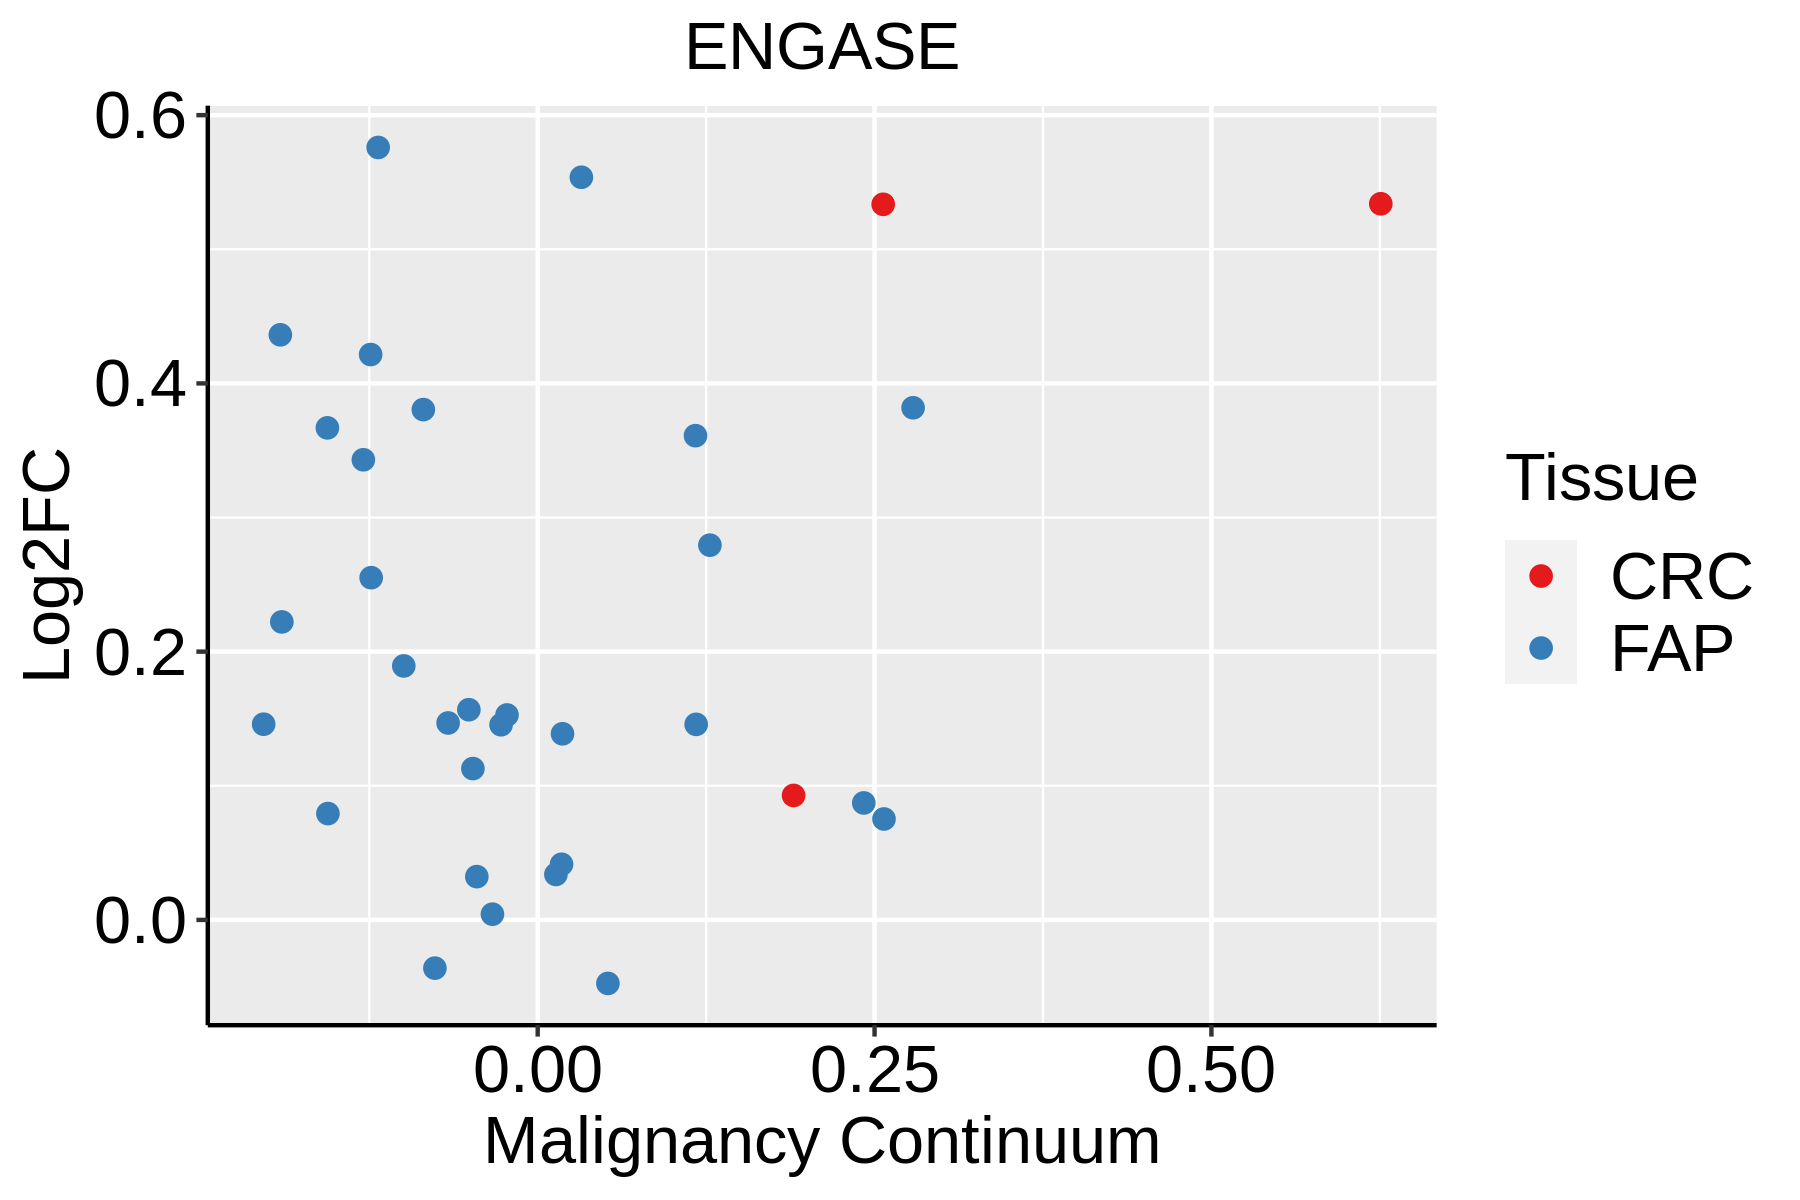 | FAP: Familial adenomatous polyposis |
| CRC: Colorectal cancer | ||
| Colorectum (HTA11) |  | AD: Adenomas |
| SER: Sessile serrated lesions | ||
| MSI-H: Microsatellite-high colorectal cancer | ||
| MSS: Microsatellite stable colorectal cancer | ||
| Esophagus | 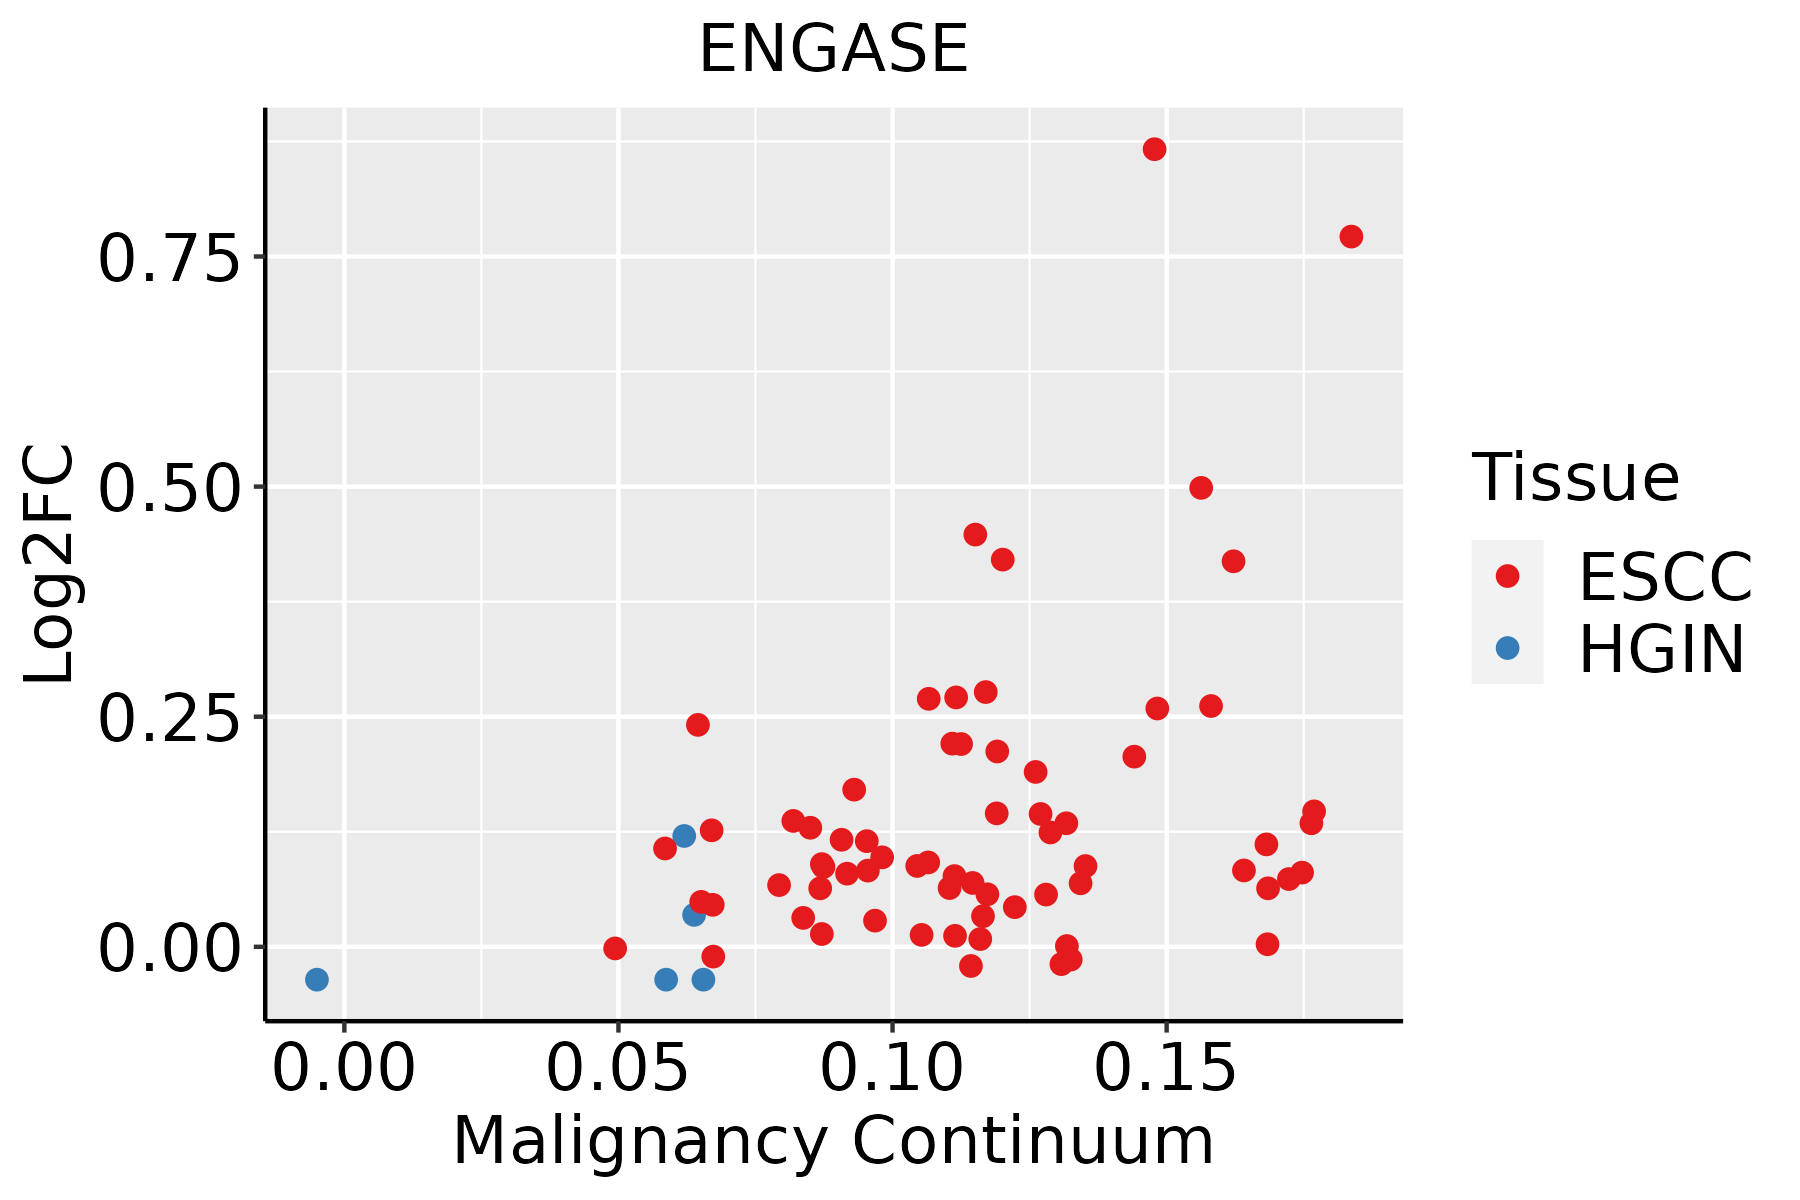 | ESCC: Esophageal squamous cell carcinoma |
| HGIN: High-grade intraepithelial neoplasias | ||
| LGIN: Low-grade intraepithelial neoplasias |
| ∗log2FC in expression of this searched gene in stem-like cells from each diseased tissue sample relative to stem-like cells in normal samples in each tissue plotted against the malignancy continuum. Samples are colored based on if they are from different disease stage. |
Top |
Malignant transformation related pathway analysis |
| Find out the enriched GO biological processes and KEGG pathways involved in transition from healthy to precancer to cancer |
| Tissue | Disease Stage | Enriched GO biological Processes |
| Colorectum | AD |  |
| Colorectum | SER |  |
| Colorectum | MSS |  |
| Colorectum | MSI-H |  |
| Colorectum | FAP |  |
| ∗Top 15 enriched GO BP terms are showed in the bar plot of each disease state in each tissue. Each row represents a significant GO biological process which is colored according to the -log10(p.adjust). |
| Page: 1 2 3 4 5 6 7 8 9 |
| GO ID | Tissue | Disease Stage | Description | Gene Ratio | Bg Ratio | pvalue | p.adjust | Count |
| GO:0006457 | Colorectum | AD | protein folding | 73/3918 | 212/18723 | 3.24e-06 | 9.10e-05 | 73 |
| GO:00064572 | Colorectum | MSS | protein folding | 71/3467 | 212/18723 | 1.25e-07 | 5.91e-06 | 71 |
| GO:00064574 | Colorectum | FAP | protein folding | 44/2622 | 212/18723 | 4.36e-03 | 2.98e-02 | 44 |
| GO:0006457110 | Esophagus | ESCC | protein folding | 163/8552 | 212/18723 | 1.13e-20 | 1.74e-18 | 163 |
| GO:00091002 | Esophagus | ESCC | glycoprotein metabolic process | 226/8552 | 387/18723 | 2.64e-07 | 3.94e-06 | 226 |
| GO:00065173 | Esophagus | ESCC | protein deglycosylation | 19/8552 | 26/18723 | 4.31e-03 | 1.71e-02 | 19 |
| Page: 1 |
| Pathway ID | Tissue | Disease Stage | Description | Gene Ratio | Bg Ratio | pvalue | p.adjust | qvalue | Count |
| Page: 1 |
Top |
Cell-cell communication analysis |
| Identification of potential cell-cell interactions between two cell types and their ligand-receptor pairs for different disease states |
| Ligand | Receptor | LRpair | Pathway | Tissue | Disease Stage |
| Page: 1 |
Top |
Single-cell gene regulatory network inference analysis |
| Find out the significant the regulons (TFs) and the target genes of each regulon across cell types for different disease states |
| TF | Cell Type | Tissue | Disease Stage | Target Gene | RSS | Regulon Activity |
| ∗The dot plots of a searched regulon are shown for all cell subpopulations in each disease state of each tissue based on the regulon specific score inferred using pySCENIC and by calculating the average expression. |
| Page: 1 |
Top |
Somatic mutation of malignant transformation related genes |
| Annotation of somatic variants for genes involved in malignant transformation |
| Hugo Symbol | Variant Class | Variant Classification | dbSNP RS | HGVSc | HGVSp | HGVSp Short | SWISSPROT | BIOTYPE | SIFT | PolyPhen | Tumor Sample Barcode | Tissue | Histology | Sex | Age | Stage | Therapy Types | Drugs | Outcome |
| ENGASE | SNV | Missense_Mutation | c.1040C>T | p.Ser347Leu | p.S347L | Q8NFI3 | protein_coding | deleterious(0) | probably_damaging(0.918) | TCGA-AO-A03O-01 | Breast | breast invasive carcinoma | Female | >=65 | I/II | Chemotherapy | doxorubicin | SD | |
| ENGASE | SNV | Missense_Mutation | rs200087247 | c.1882N>T | p.Arg628Cys | p.R628C | Q8NFI3 | protein_coding | tolerated(0.19) | benign(0.003) | TCGA-AR-A1AP-01 | Breast | breast invasive carcinoma | Female | >=65 | I/II | Hormone Therapy | anastrozole | SD |
| ENGASE | SNV | Missense_Mutation | c.628N>C | p.Glu210Gln | p.E210Q | Q8NFI3 | protein_coding | tolerated(0.05) | benign(0.338) | TCGA-C8-A26Y-01 | Breast | breast invasive carcinoma | Female | >=65 | I/II | Unknown | Unknown | SD | |
| ENGASE | insertion | Nonsense_Mutation | novel | c.743_744insATGCAATAACTTTTTAATATAA | p.Met248IlefsTer8 | p.M248Ifs*8 | Q8NFI3 | protein_coding | TCGA-A8-A0A1-01 | Breast | breast invasive carcinoma | Female | >=65 | I/II | Hormone Therapy | tamoxiphen | SD | ||
| ENGASE | insertion | Nonsense_Mutation | novel | c.1468_1469insTTCACTAA | p.Pro490LeufsTer3 | p.P490Lfs*3 | Q8NFI3 | protein_coding | TCGA-A8-A0A1-01 | Breast | breast invasive carcinoma | Female | >=65 | I/II | Hormone Therapy | tamoxiphen | SD | ||
| ENGASE | insertion | Frame_Shift_Ins | novel | c.486_487insTT | p.Tyr163PhefsTer72 | p.Y163Ffs*72 | Q8NFI3 | protein_coding | TCGA-AQ-A04J-01 | Breast | breast invasive carcinoma | Female | <65 | I/II | Chemotherapy | cytoxan | SD | ||
| ENGASE | insertion | Nonsense_Mutation | novel | c.488_489insGATGAAACTGGTCCATTTGCTTCTAAGTGTT | p.Tyr163Ter | p.Y163* | Q8NFI3 | protein_coding | TCGA-AQ-A04J-01 | Breast | breast invasive carcinoma | Female | <65 | I/II | Chemotherapy | cytoxan | SD | ||
| ENGASE | deletion | Frame_Shift_Del | novel | c.693delN | p.Trp232GlyfsTer2 | p.W232Gfs*2 | Q8NFI3 | protein_coding | TCGA-D8-A27V-01 | Breast | breast invasive carcinoma | Female | <65 | I/II | Hormone Therapy | tamoxiphen | SD | ||
| ENGASE | SNV | Missense_Mutation | rs200445672 | c.757N>T | p.Arg253Trp | p.R253W | Q8NFI3 | protein_coding | deleterious(0.01) | benign(0.062) | TCGA-C5-A1BK-01 | Cervix | cervical & endocervical cancer | Female | <65 | I/II | Unknown | Unknown | SD |
| ENGASE | SNV | Missense_Mutation | rs758339425 | c.632N>A | p.Arg211His | p.R211H | Q8NFI3 | protein_coding | tolerated(0.12) | benign(0.01) | TCGA-VS-A94Z-01 | Cervix | cervical & endocervical cancer | Female | <65 | I/II | Chemotherapy | cisplatin | CR |
| Page: 1 2 3 4 5 6 7 8 9 |
Top |
Related drugs of malignant transformation related genes |
| Identification of chemicals and drugs interact with genes involved in malignant transfromation |
| (DGIdb 4.0) |
| Entrez ID | Symbol | Category | Interaction Types | Drug Claim Name | Drug Name | PMIDs |
| Page: 1 |

Copyright 2023-Present -The University of Texas Health Science Center at Houston |