
|
|||||
|
 | |
| |
| |
| |
| |
| |
|
Gene: ENDOG |
Gene summary for ENDOG |
| Gene information | Species | Human | Gene symbol | ENDOG | Gene ID | 2021 |
| Gene name | endonuclease G | |
| Gene Alias | ENDOG | |
| Cytomap | 9q34.11 | |
| Gene Type | protein-coding | GO ID | GO:0000302 | UniProtAcc | E5KNL5 |
Top |
Malignant transformation analysis |
| Identification of the aberrant gene expression in precancerous and cancerous lesions by comparing the gene expression of stem-like cells in diseased tissues with normal stem cells |
| Entrez ID | Symbol | Replicates | Species | Organ | Tissue | Adj P-value | Log2FC | Malignancy |
| 2021 | ENDOG | HCC1_Meng | Human | Liver | HCC | 7.23e-66 | 1.36e-01 | 0.0246 |
| 2021 | ENDOG | HCC2_Meng | Human | Liver | HCC | 7.46e-14 | 1.15e-01 | 0.0107 |
| 2021 | ENDOG | cirrhotic2 | Human | Liver | Cirrhotic | 4.99e-05 | 1.48e-01 | 0.0201 |
| 2021 | ENDOG | cirrhotic3 | Human | Liver | Cirrhotic | 2.22e-02 | 1.19e-01 | 0.0215 |
| 2021 | ENDOG | HCC2 | Human | Liver | HCC | 1.37e-02 | 2.60e+00 | 0.5341 |
| 2021 | ENDOG | S014 | Human | Liver | HCC | 1.34e-06 | 4.07e-01 | 0.2254 |
| 2021 | ENDOG | S015 | Human | Liver | HCC | 1.06e-04 | 2.67e-01 | 0.2375 |
| 2021 | ENDOG | S016 | Human | Liver | HCC | 2.45e-07 | 3.18e-01 | 0.2243 |
| 2021 | ENDOG | S027 | Human | Liver | HCC | 1.61e-12 | 7.97e-01 | 0.2446 |
| 2021 | ENDOG | S028 | Human | Liver | HCC | 2.85e-19 | 7.50e-01 | 0.2503 |
| 2021 | ENDOG | S029 | Human | Liver | HCC | 1.73e-16 | 8.40e-01 | 0.2581 |
| 2021 | ENDOG | C04 | Human | Oral cavity | OSCC | 1.37e-02 | 2.80e-01 | 0.2633 |
| 2021 | ENDOG | C21 | Human | Oral cavity | OSCC | 7.14e-17 | 6.14e-01 | 0.2678 |
| 2021 | ENDOG | C30 | Human | Oral cavity | OSCC | 1.15e-28 | 1.13e+00 | 0.3055 |
| 2021 | ENDOG | C38 | Human | Oral cavity | OSCC | 1.01e-05 | 9.75e-01 | 0.172 |
| 2021 | ENDOG | C43 | Human | Oral cavity | OSCC | 1.50e-05 | 5.49e-02 | 0.1704 |
| 2021 | ENDOG | C51 | Human | Oral cavity | OSCC | 4.91e-10 | 5.89e-01 | 0.2674 |
| 2021 | ENDOG | C57 | Human | Oral cavity | OSCC | 1.78e-02 | 2.96e-01 | 0.1679 |
| 2021 | ENDOG | C08 | Human | Oral cavity | OSCC | 4.95e-26 | 6.12e-01 | 0.1919 |
| 2021 | ENDOG | SYSMH1 | Human | Oral cavity | OSCC | 1.48e-15 | 4.11e-01 | 0.1127 |
| Page: 1 2 3 |
| Tissue | Expression Dynamics | Abbreviation |
| Liver |  | HCC: Hepatocellular carcinoma |
| NAFLD: Non-alcoholic fatty liver disease | ||
| Oral Cavity |  | EOLP: Erosive Oral lichen planus |
| LP: leukoplakia | ||
| NEOLP: Non-erosive oral lichen planus | ||
| OSCC: Oral squamous cell carcinoma | ||
| Skin | 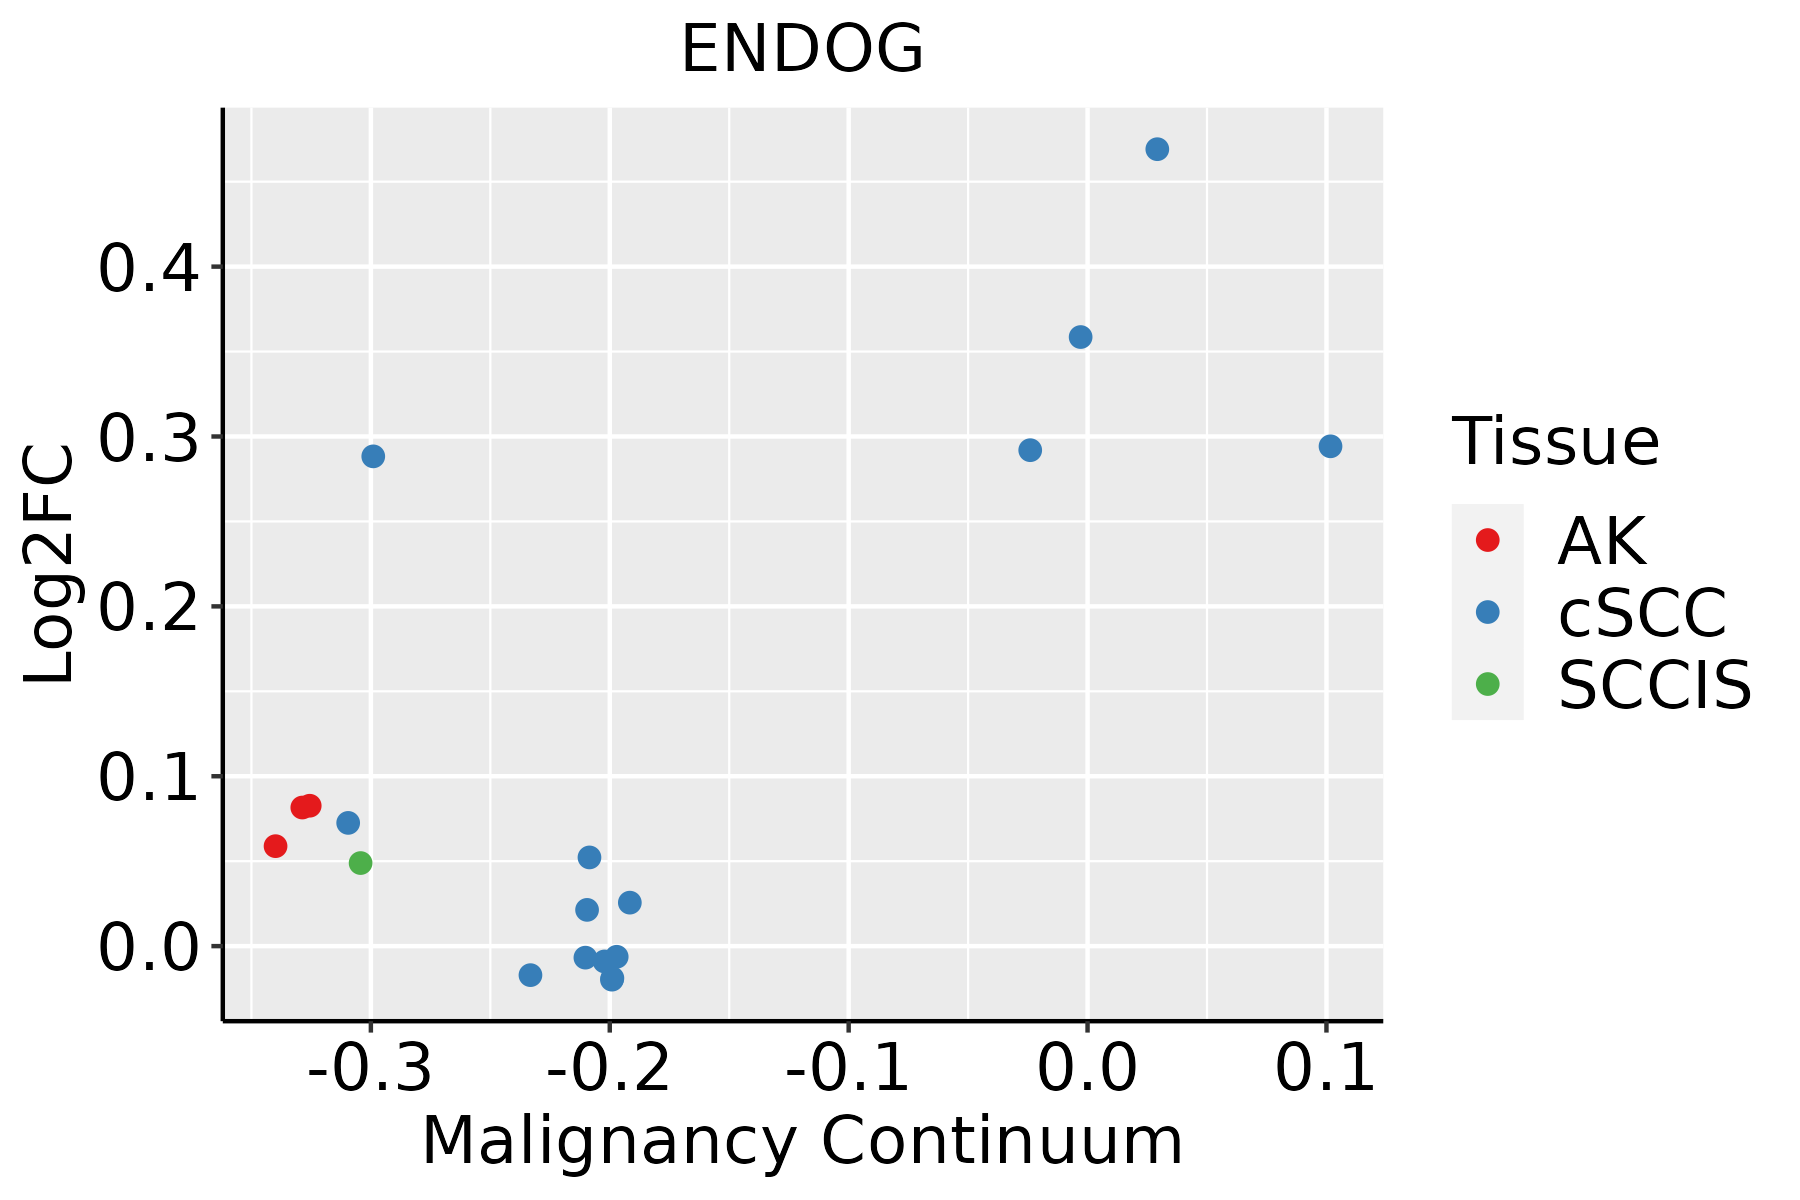 | AK: Actinic keratosis |
| cSCC: Cutaneous squamous cell carcinoma | ||
| SCCIS:squamous cell carcinoma in situ | ||
| Thyroid | 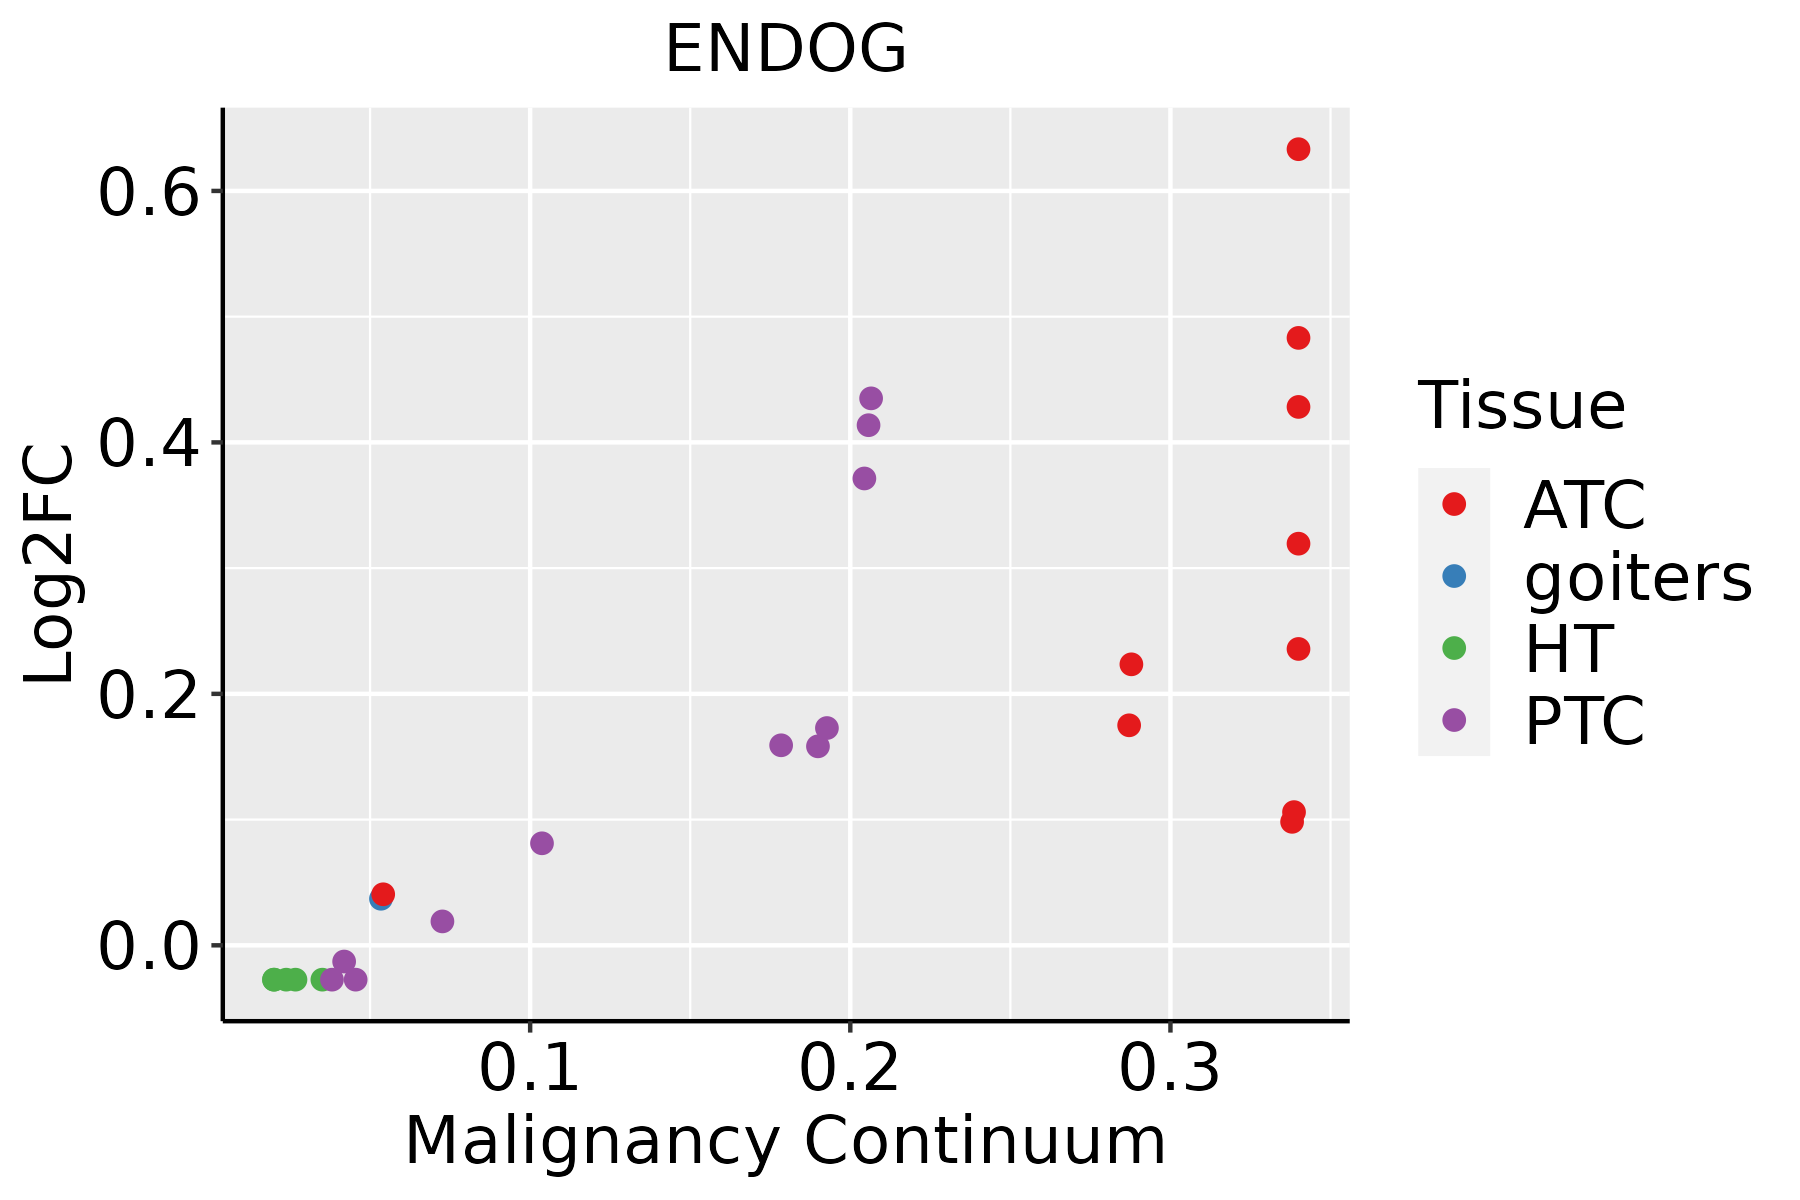 | ATC: Anaplastic thyroid cancer |
| HT: Hashimoto's thyroiditis | ||
| PTC: Papillary thyroid cancer |
| ∗log2FC in expression of this searched gene in stem-like cells from each diseased tissue sample relative to stem-like cells in normal samples in each tissue plotted against the malignancy continuum. Samples are colored based on if they are from different disease stage. |
Top |
Malignant transformation related pathway analysis |
| Find out the enriched GO biological processes and KEGG pathways involved in transition from healthy to precancer to cancer |
| Tissue | Disease Stage | Enriched GO biological Processes |
| Colorectum | AD |  |
| Colorectum | SER |  |
| Colorectum | MSS |  |
| Colorectum | MSI-H |  |
| Colorectum | FAP |  |
| ∗Top 15 enriched GO BP terms are showed in the bar plot of each disease state in each tissue. Each row represents a significant GO biological process which is colored according to the -log10(p.adjust). |
| Page: 1 2 3 4 5 6 7 8 9 |
| GO ID | Tissue | Disease Stage | Description | Gene Ratio | Bg Ratio | pvalue | p.adjust | Count |
| GO:000989612 | Liver | Cirrhotic | positive regulation of catabolic process | 215/4634 | 492/18723 | 1.13e-20 | 3.56e-18 | 215 |
| GO:190136111 | Liver | Cirrhotic | organic cyclic compound catabolic process | 213/4634 | 495/18723 | 1.58e-19 | 3.67e-17 | 213 |
| GO:003133112 | Liver | Cirrhotic | positive regulation of cellular catabolic process | 190/4634 | 427/18723 | 1.94e-19 | 4.18e-17 | 190 |
| GO:000697912 | Liver | Cirrhotic | response to oxidative stress | 196/4634 | 446/18723 | 2.80e-19 | 5.86e-17 | 196 |
| GO:001943911 | Liver | Cirrhotic | aromatic compound catabolic process | 202/4634 | 467/18723 | 6.93e-19 | 1.28e-16 | 202 |
| GO:004427011 | Liver | Cirrhotic | cellular nitrogen compound catabolic process | 195/4634 | 451/18723 | 2.99e-18 | 4.94e-16 | 195 |
| GO:004670011 | Liver | Cirrhotic | heterocycle catabolic process | 192/4634 | 445/18723 | 7.17e-18 | 1.12e-15 | 192 |
| GO:003465511 | Liver | Cirrhotic | nucleobase-containing compound catabolic process | 171/4634 | 407/18723 | 9.07e-15 | 9.33e-13 | 171 |
| GO:00224117 | Liver | Cirrhotic | cellular component disassembly | 182/4634 | 443/18723 | 1.59e-14 | 1.54e-12 | 182 |
| GO:006219712 | Liver | Cirrhotic | cellular response to chemical stress | 147/4634 | 337/18723 | 1.84e-14 | 1.72e-12 | 147 |
| GO:003459912 | Liver | Cirrhotic | cellular response to oxidative stress | 127/4634 | 288/18723 | 4.29e-13 | 3.32e-11 | 127 |
| GO:001003812 | Liver | Cirrhotic | response to metal ion | 150/4634 | 373/18723 | 2.27e-11 | 1.37e-09 | 150 |
| GO:000030212 | Liver | Cirrhotic | response to reactive oxygen species | 100/4634 | 222/18723 | 2.92e-11 | 1.73e-09 | 100 |
| GO:004254212 | Liver | Cirrhotic | response to hydrogen peroxide | 71/4634 | 146/18723 | 3.40e-10 | 1.63e-08 | 71 |
| GO:007099712 | Liver | Cirrhotic | neuron death | 141/4634 | 361/18723 | 9.56e-10 | 4.38e-08 | 141 |
| GO:00346147 | Liver | Cirrhotic | cellular response to reactive oxygen species | 70/4634 | 155/18723 | 2.27e-08 | 7.91e-07 | 70 |
| GO:000974312 | Liver | Cirrhotic | response to carbohydrate | 101/4634 | 253/18723 | 6.24e-08 | 1.92e-06 | 101 |
| GO:00017015 | Liver | Cirrhotic | in utero embryonic development | 134/4634 | 367/18723 | 2.78e-07 | 6.86e-06 | 134 |
| GO:003428412 | Liver | Cirrhotic | response to monosaccharide | 90/4634 | 225/18723 | 2.87e-07 | 7.01e-06 | 90 |
| GO:000974612 | Liver | Cirrhotic | response to hexose | 86/4634 | 219/18723 | 1.30e-06 | 2.59e-05 | 86 |
| Page: 1 2 3 4 5 6 7 8 9 10 11 12 13 14 15 16 |
| Pathway ID | Tissue | Disease Stage | Description | Gene Ratio | Bg Ratio | pvalue | p.adjust | qvalue | Count |
| hsa042106 | Liver | Cirrhotic | Apoptosis | 58/2530 | 136/8465 | 9.84e-04 | 5.55e-03 | 3.42e-03 | 58 |
| hsa0421011 | Liver | Cirrhotic | Apoptosis | 58/2530 | 136/8465 | 9.84e-04 | 5.55e-03 | 3.42e-03 | 58 |
| hsa042102 | Liver | HCC | Apoptosis | 83/4020 | 136/8465 | 9.51e-04 | 3.58e-03 | 1.99e-03 | 83 |
| hsa042103 | Liver | HCC | Apoptosis | 83/4020 | 136/8465 | 9.51e-04 | 3.58e-03 | 1.99e-03 | 83 |
| hsa0421018 | Oral cavity | OSCC | Apoptosis | 101/3704 | 136/8465 | 3.34e-13 | 7.00e-12 | 3.56e-12 | 101 |
| hsa0421019 | Oral cavity | OSCC | Apoptosis | 101/3704 | 136/8465 | 3.34e-13 | 7.00e-12 | 3.56e-12 | 101 |
| Page: 1 |
Top |
Cell-cell communication analysis |
| Identification of potential cell-cell interactions between two cell types and their ligand-receptor pairs for different disease states |
| Ligand | Receptor | LRpair | Pathway | Tissue | Disease Stage |
| Page: 1 |
Top |
Single-cell gene regulatory network inference analysis |
| Find out the significant the regulons (TFs) and the target genes of each regulon across cell types for different disease states |
| TF | Cell Type | Tissue | Disease Stage | Target Gene | RSS | Regulon Activity |
| ∗The dot plots of a searched regulon are shown for all cell subpopulations in each disease state of each tissue based on the regulon specific score inferred using pySCENIC and by calculating the average expression. |
| Page: 1 |
Top |
Somatic mutation of malignant transformation related genes |
| Annotation of somatic variants for genes involved in malignant transformation |
| Hugo Symbol | Variant Class | Variant Classification | dbSNP RS | HGVSc | HGVSp | HGVSp Short | SWISSPROT | BIOTYPE | SIFT | PolyPhen | Tumor Sample Barcode | Tissue | Histology | Sex | Age | Stage | Therapy Types | Drugs | Outcome |
| ENDOG | SNV | Missense_Mutation | c.880N>A | p.Ala294Thr | p.A294T | Q14249 | protein_coding | deleterious_low_confidence(0.01) | benign(0.001) | TCGA-2W-A8YY-01 | Cervix | cervical & endocervical cancer | Female | <65 | I/II | Chemotherapy | cisplatin | CR | |
| ENDOG | SNV | Missense_Mutation | c.754G>A | p.Ala252Thr | p.A252T | Q14249 | protein_coding | tolerated(0.46) | benign(0.063) | TCGA-AZ-4313-01 | Colorectum | colon adenocarcinoma | Female | <65 | I/II | Unknown | Unknown | SD | |
| ENDOG | SNV | Missense_Mutation | c.854N>T | p.Arg285Leu | p.R285L | Q14249 | protein_coding | deleterious(0.01) | possibly_damaging(0.903) | TCGA-CM-5861-01 | Colorectum | colon adenocarcinoma | Female | <65 | I/II | Unknown | Unknown | PD | |
| ENDOG | SNV | Missense_Mutation | c.857N>T | p.Ala286Val | p.A286V | Q14249 | protein_coding | tolerated(0.07) | benign(0.014) | TCGA-G4-6628-01 | Colorectum | colon adenocarcinoma | Male | >=65 | I/II | Unknown | Unknown | SD | |
| ENDOG | SNV | Missense_Mutation | novel | c.521N>G | p.Asn174Ser | p.N174S | Q14249 | protein_coding | deleterious(0.05) | benign(0.105) | TCGA-A5-A1OF-01 | Endometrium | uterine corpus endometrioid carcinoma | Female | <65 | I/II | Unknown | Unknown | SD |
| ENDOG | SNV | Missense_Mutation | rs776376143 | c.802N>A | p.Glu268Lys | p.E268K | Q14249 | protein_coding | deleterious(0) | possibly_damaging(0.646) | TCGA-B5-A11N-01 | Endometrium | uterine corpus endometrioid carcinoma | Female | >=65 | I/II | Unknown | Unknown | SD |
| ENDOG | SNV | Missense_Mutation | rs767328963 | c.853C>T | p.Arg285Trp | p.R285W | Q14249 | protein_coding | deleterious(0) | probably_damaging(0.983) | TCGA-B5-A3FA-01 | Endometrium | uterine corpus endometrioid carcinoma | Female | >=65 | I/II | Unknown | Unknown | SD |
| ENDOG | SNV | Missense_Mutation | c.866T>G | p.Leu289Arg | p.L289R | Q14249 | protein_coding | deleterious_low_confidence(0.04) | benign(0.01) | TCGA-G3-A7M9-01 | Liver | liver hepatocellular carcinoma | Male | >=65 | III/IV | Unknown | Unknown | SD | |
| ENDOG | SNV | Missense_Mutation | novel | c.653N>C | p.Ile218Thr | p.I218T | Q14249 | protein_coding | deleterious(0) | probably_damaging(1) | TCGA-77-8139-01 | Lung | lung squamous cell carcinoma | Male | >=65 | I/II | Unknown | Unknown | SD |
| ENDOG | SNV | Missense_Mutation | c.325N>T | p.Asp109Tyr | p.D109Y | Q14249 | protein_coding | deleterious(0) | probably_damaging(0.972) | TCGA-G9-6342-01 | Prostate | prostate adenocarcinoma | Male | <65 | 6 | Unknown | Unknown | SD |
| Page: 1 2 |
Top |
Related drugs of malignant transformation related genes |
| Identification of chemicals and drugs interact with genes involved in malignant transfromation |
| (DGIdb 4.0) |
| Entrez ID | Symbol | Category | Interaction Types | Drug Claim Name | Drug Name | PMIDs |
| Page: 1 |

Copyright 2023-Present -The University of Texas Health Science Center at Houston |