Schematic overview of the cellular and molecular mechanisms involved in the cancer progression, including the proposed cellular and molecular mechanisms in cancer cells trajectory. AT1: alveolar type 1 cells; AT2: alveolar type 2 cells; AAH: atypical adenomatous hyperplasia; AIS: adenocarcinoma in situ; MIA: minimally invasive adenocarcinoma; IA: invasive adenocarcinoma; EMT: epithelial-mesenchymal transition

Home

Download

Statistics

Help

Contact

Center for Computational Systems Medicine
leaf

Gene summary

leaf

Malignant transformation analysis

leaf

Malignant transformation related pathway analysis

leaf

Cell-cell communication analysis

leaf

Single-cell gene regulatory network inference analysis

leaf

Somatic mutation of malignant transformation related genes

leaf

Related drugs of malignant transformation related genes

Gene: ENC1

Gene summary for ENC1

check button Gene summary.

Gene informationSpeciesHuman
Gene symbol

ENC1

Gene ID

8507

Gene nameectodermal-neural cortex 1
Gene AliasCCL28
Cytomap5q13.3
Gene Typeprotein-coding
GO ID

GO:0006412

UniProtAcc

O14682


Top

Malignant transformation analysis

check button Identification of the aberrant gene expression in precancerous and cancerous lesions by comparing the gene expression of stem-like cells in diseased tissues with normal stem cells
check button Malignant transformation involving gene list.
Entrez IDSymbolReplicatesSpeciesOrganTissueAdj P-valueLog2FCMalignancy
8507ENC1HTA11_99999965104_69814HumanColorectumMSS2.74e-117.33e-010.281
8507ENC1F007HumanColorectumFAP4.95e-066.38e-010.1176
8507ENC1A002-C-010HumanColorectumFAP1.67e-033.26e-010.242
8507ENC1A001-C-207HumanColorectumFAP1.79e-076.09e-010.1278
8507ENC1A015-C-203HumanColorectumFAP8.36e-358.76e-01-0.1294
8507ENC1A015-C-204HumanColorectumFAP2.51e-127.00e-01-0.0228
8507ENC1A014-C-040HumanColorectumFAP2.34e-046.43e-01-0.1184
8507ENC1A002-C-201HumanColorectumFAP9.78e-166.55e-010.0324
8507ENC1A002-C-203HumanColorectumFAP9.09e-105.88e-010.2786
8507ENC1A001-C-108HumanColorectumFAP1.97e-186.47e-01-0.0272
8507ENC1A002-C-021HumanColorectumFAP2.29e-084.05e-010.1171
8507ENC1A002-C-205HumanColorectumFAP2.58e-145.19e-01-0.1236
8507ENC1A001-C-104HumanColorectumFAP1.92e-146.19e-010.0184
8507ENC1A015-C-005HumanColorectumFAP4.09e-044.67e-01-0.0336
8507ENC1A015-C-006HumanColorectumFAP3.06e-156.83e-01-0.0994
8507ENC1A015-C-106HumanColorectumFAP2.67e-227.69e-01-0.0511
8507ENC1A002-C-114HumanColorectumFAP1.87e-042.00e-01-0.1561
8507ENC1A015-C-104HumanColorectumFAP5.02e-317.96e-01-0.1899
8507ENC1A001-C-014HumanColorectumFAP1.63e-136.56e-010.0135
8507ENC1A002-C-016HumanColorectumFAP1.29e-063.47e-010.0521
Page: 1 2 3 4 5 

check button Transcriptomic changes along malignancy continuum.
TissueExpression DynamicsAbbreviation
Colorectum (GSE201348)The image shows the transcriptomic changes along malignancy continuum.log2FC in expression of this searched gene in stem-like cells from each diseased tissue sample relative to stem-like cells in normal samples in each tissue plotted against the malignancy continuum. Samples are colored based on if they are from different disease stage.FAP: Familial adenomatous polyposis
CRC: Colorectal cancer
Colorectum (HTA11)The image shows the transcriptomic changes along malignancy continuum.log2FC in expression of this searched gene in stem-like cells from each diseased tissue sample relative to stem-like cells in normal samples in each tissue plotted against the malignancy continuum. Samples are colored based on if they are from different disease stage.AD: Adenomas
SER: Sessile serrated lesions
MSI-H: Microsatellite-high colorectal cancer
MSS: Microsatellite stable colorectal cancer
EsophagusThe image shows the transcriptomic changes along malignancy continuum.log2FC in expression of this searched gene in stem-like cells from each diseased tissue sample relative to stem-like cells in normal samples in each tissue plotted against the malignancy continuum. Samples are colored based on if they are from different disease stage.
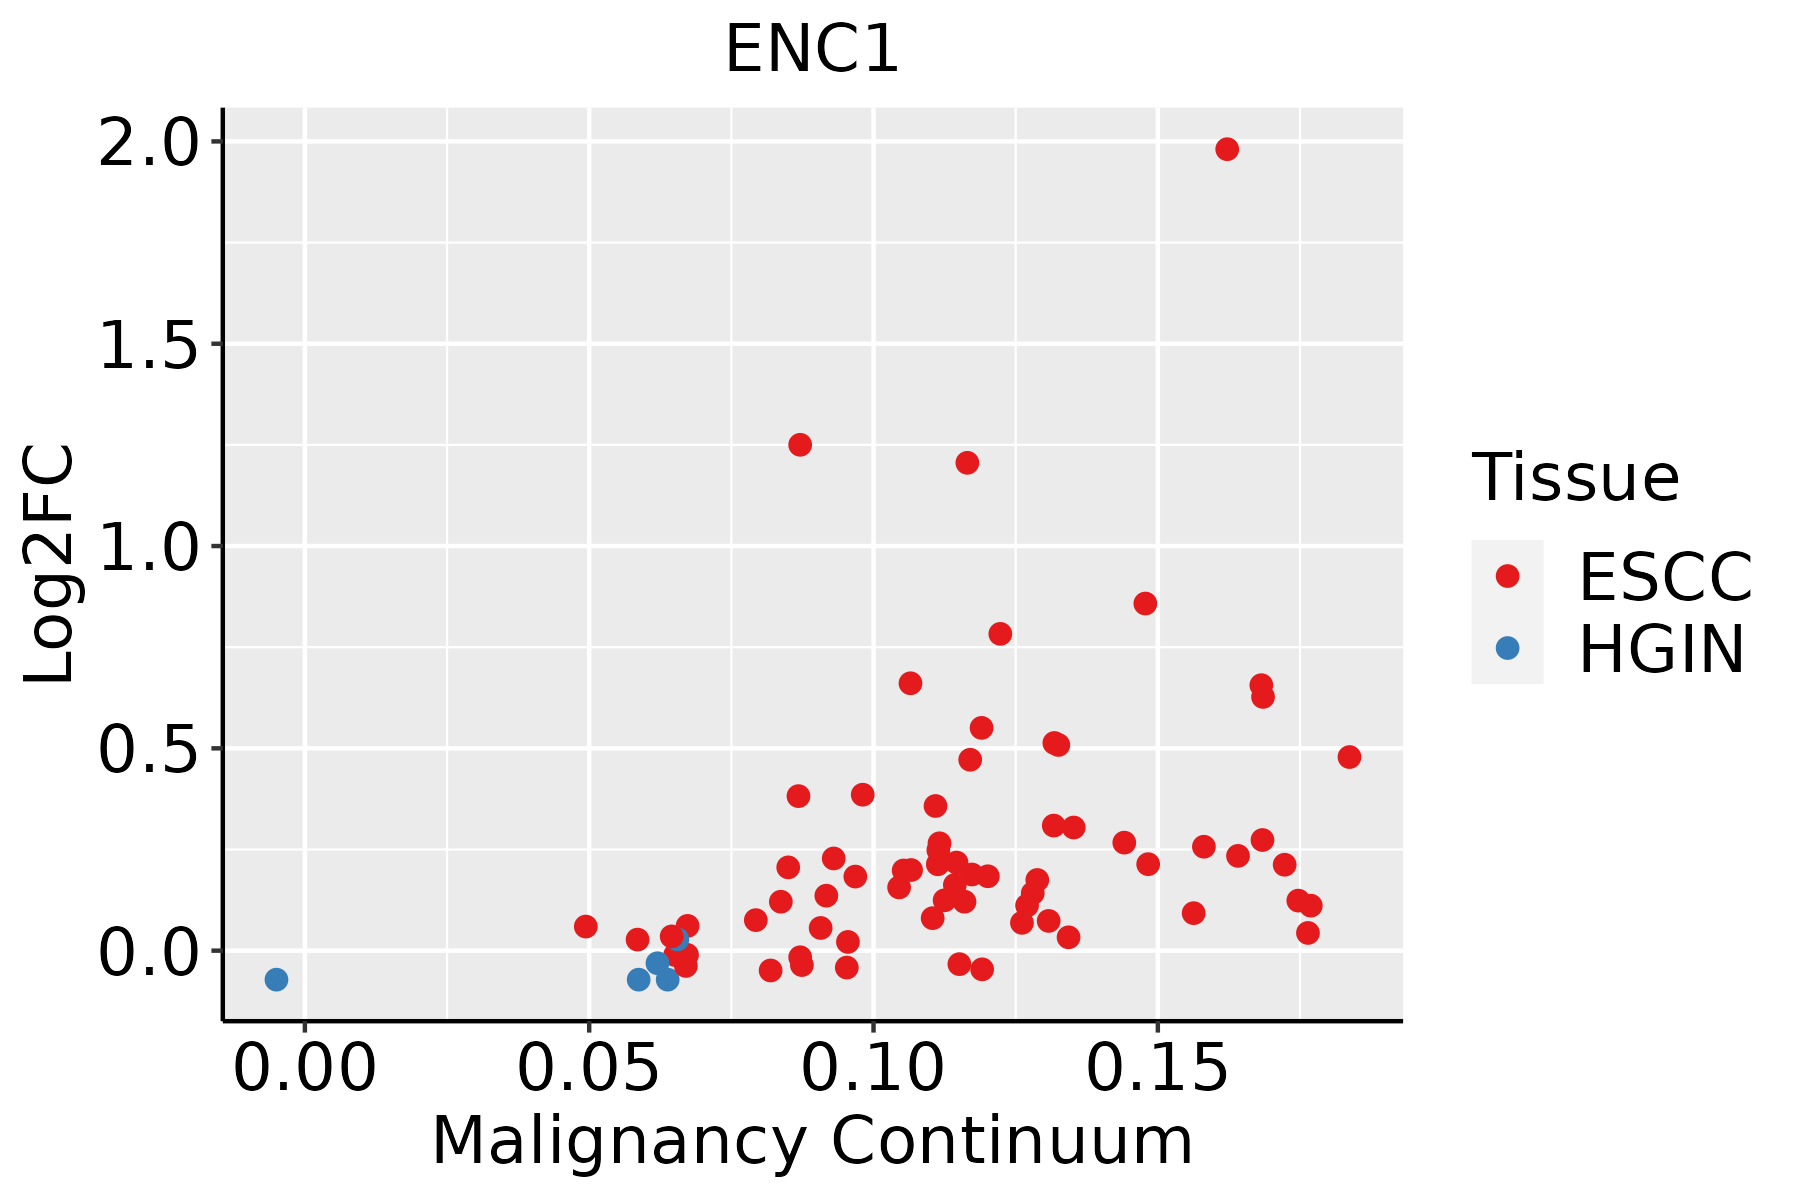
ESCC: Esophageal squamous cell carcinoma
HGIN: High-grade intraepithelial neoplasias
LGIN: Low-grade intraepithelial neoplasias
LiverThe image shows the transcriptomic changes along malignancy continuum.log2FC in expression of this searched gene in stem-like cells from each diseased tissue sample relative to stem-like cells in normal samples in each tissue plotted against the malignancy continuum. Samples are colored based on if they are from different disease stage.
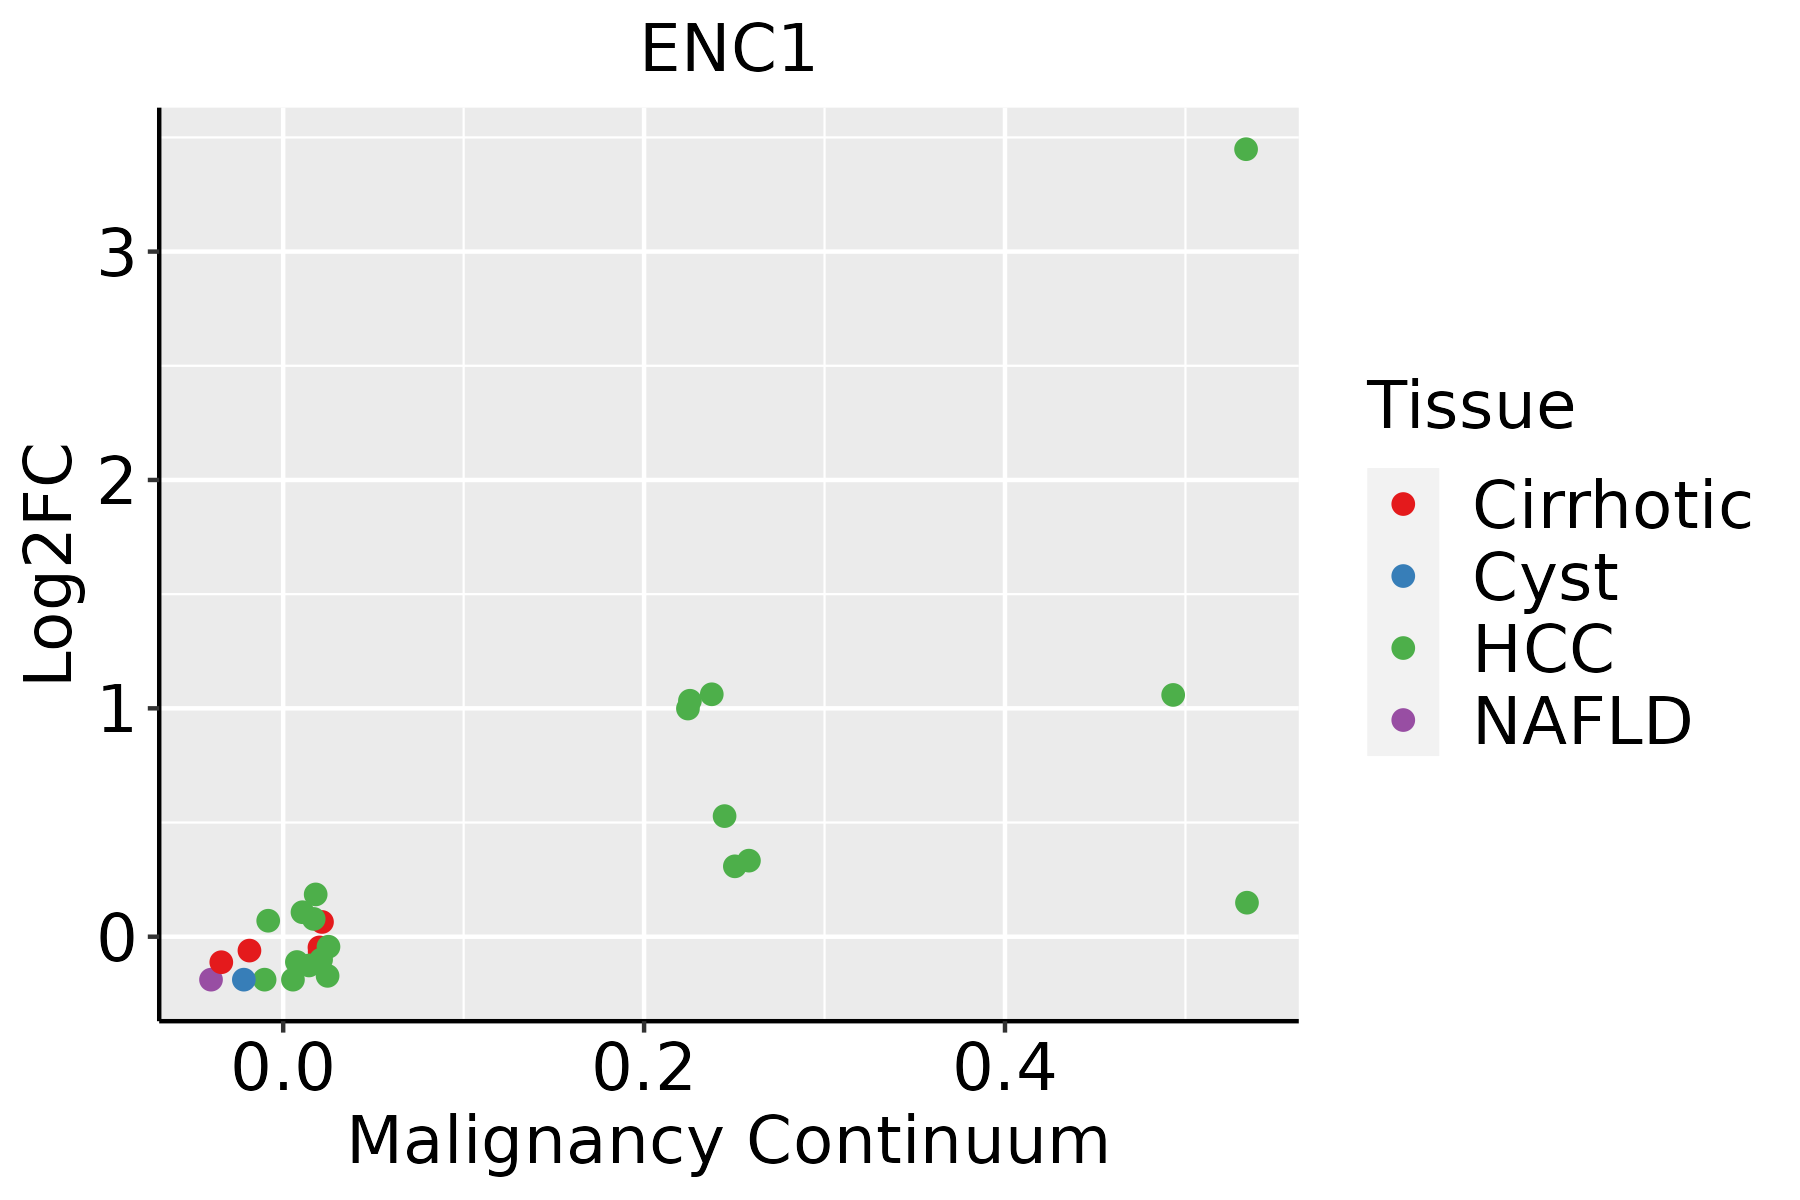
HCC: Hepatocellular carcinoma
NAFLD: Non-alcoholic fatty liver disease
ProstateThe image shows the transcriptomic changes along malignancy continuum.log2FC in expression of this searched gene in stem-like cells from each diseased tissue sample relative to stem-like cells in normal samples in each tissue plotted against the malignancy continuum. Samples are colored based on if they are from different disease stage.
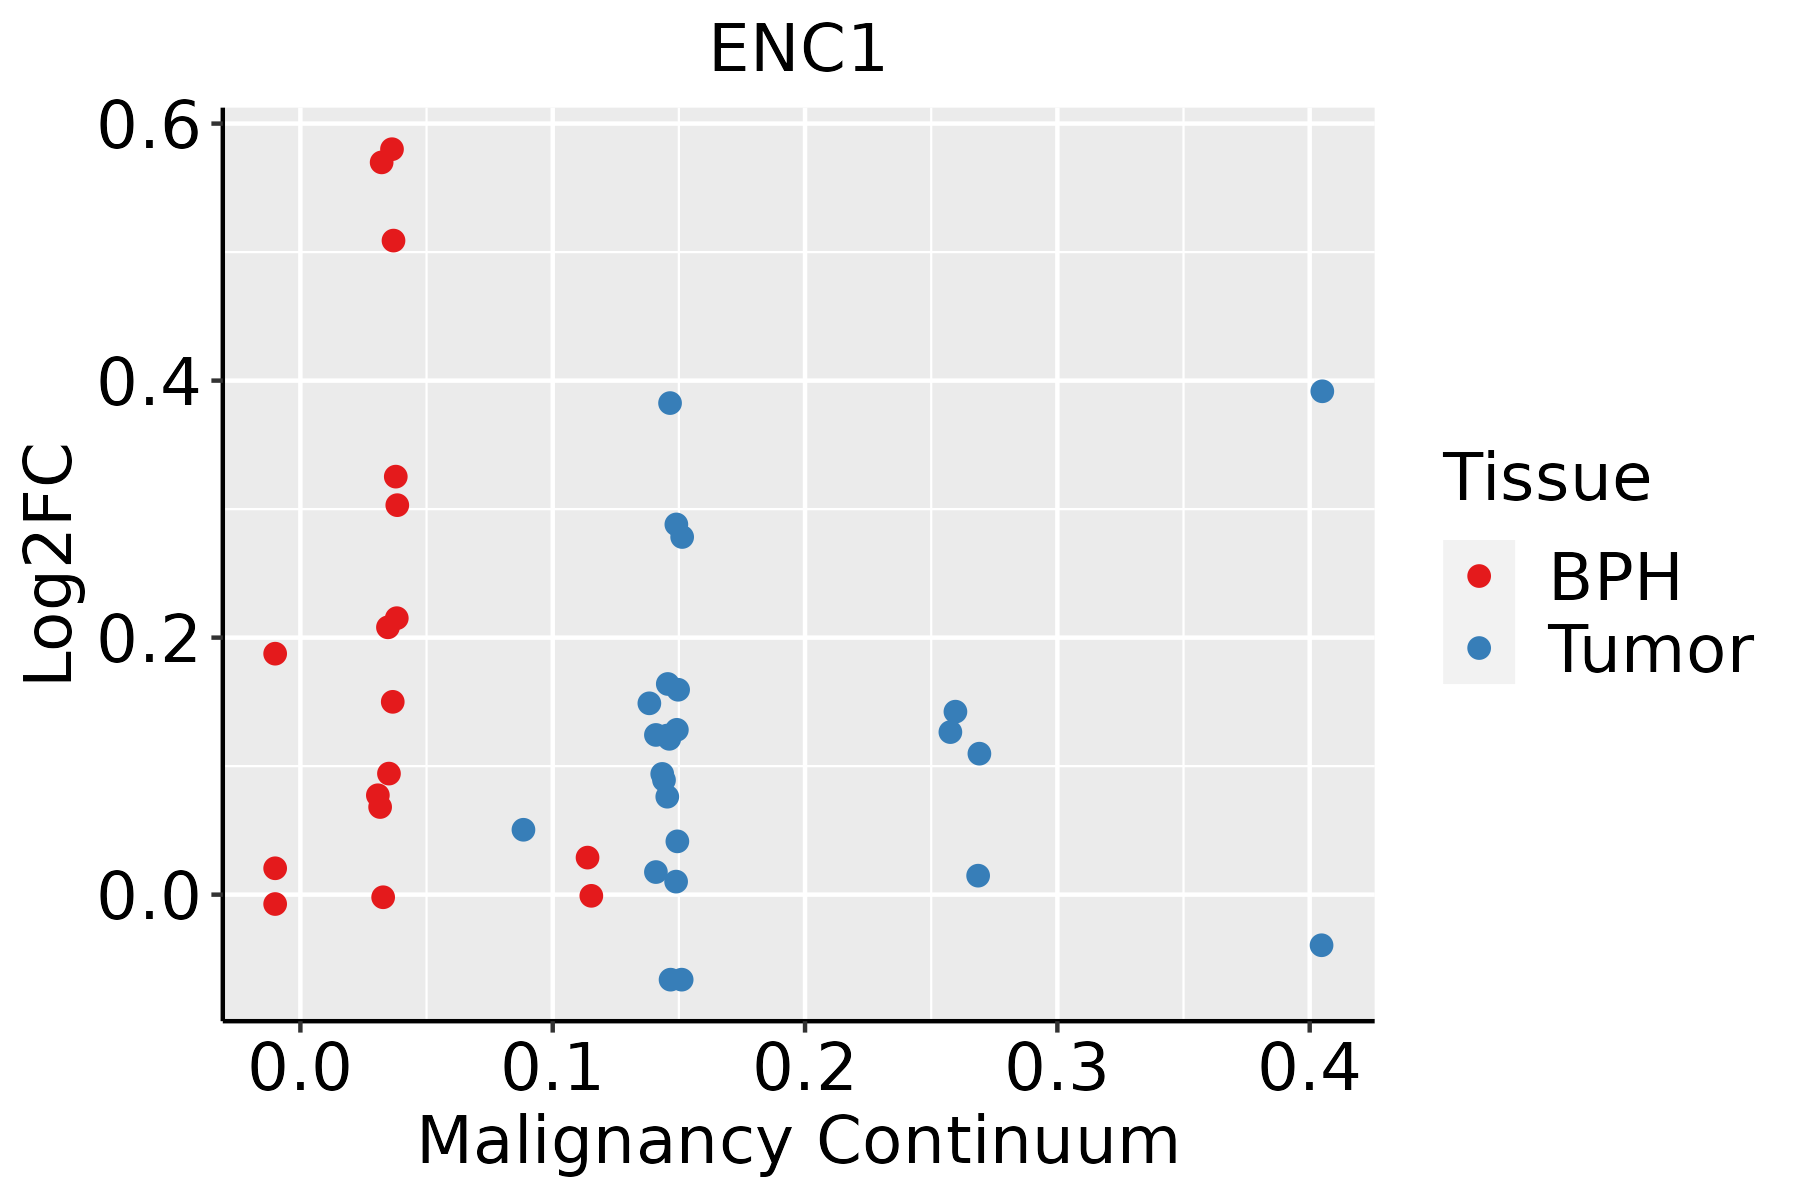
BPH: Benign Prostatic Hyperplasia
ThyroidThe image shows the transcriptomic changes along malignancy continuum.log2FC in expression of this searched gene in stem-like cells from each diseased tissue sample relative to stem-like cells in normal samples in each tissue plotted against the malignancy continuum. Samples are colored based on if they are from different disease stage.
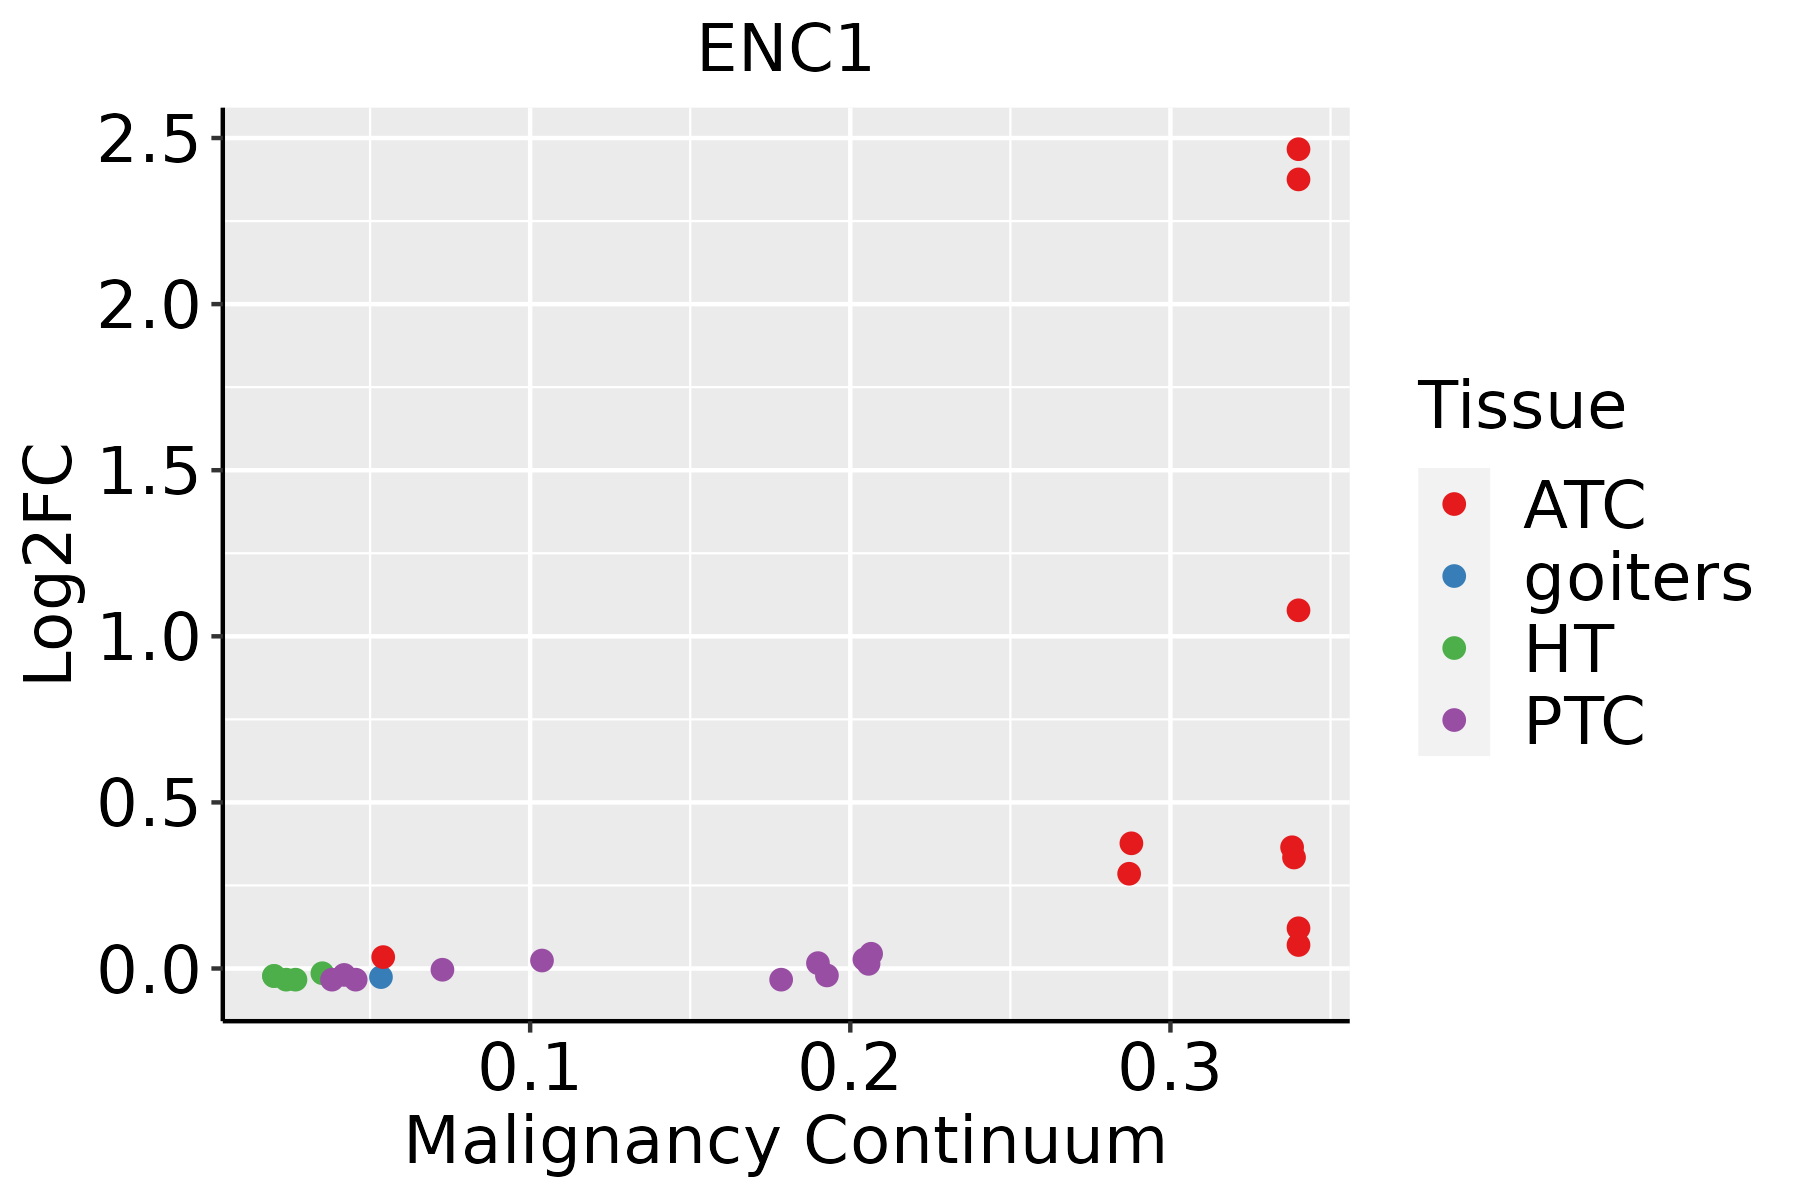
ATC: Anaplastic thyroid cancer
HT: Hashimoto's thyroiditis
PTC: Papillary thyroid cancer
∗log2FC in expression of this searched gene in stem-like cells from each diseased tissue sample relative to stem-like cells in normal samples in each tissue plotted against the malignancy continuum. Samples are colored based on if they are from different disease stage.

Top

Malignant transformation related pathway analysis

check buttonFind out the enriched GO biological processes and KEGG pathways involved in transition from healthy to precancer to cancer
check button Figure of enriched GO biological processes.
TissueDisease StageEnriched GO biological Processes
ColorectumADGO analysis - Figure of enriched GO biological processes: Top 15 enriched GO BP terms are showed in the bar plot of each disease state in each tissue. Each row represents a significant GO biological process which is colored according to the -log10(p.adjust).
ColorectumSERGO analysis - Figure of enriched GO biological processes: Top 15 enriched GO BP terms are showed in the bar plot of each disease state in each tissue. Each row represents a significant GO biological process which is colored according to the -log10(p.adjust).
ColorectumMSSGO analysis - Figure of enriched GO biological processes: Top 15 enriched GO BP terms are showed in the bar plot of each disease state in each tissue. Each row represents a significant GO biological process which is colored according to the -log10(p.adjust).
ColorectumMSI-HGO analysis - Figure of enriched GO biological processes: Top 15 enriched GO BP terms are showed in the bar plot of each disease state in each tissue. Each row represents a significant GO biological process which is colored according to the -log10(p.adjust).
ColorectumFAPGO analysis - Figure of enriched GO biological processes: Top 15 enriched GO BP terms are showed in the bar plot of each disease state in each tissue. Each row represents a significant GO biological process which is colored according to the -log10(p.adjust).
∗Top 15 enriched GO BP terms are showed in the bar plot of each disease state in each tissue. Each row represents a significant GO biological process which is colored according to the -log10(p.adjust).
Page: 1 2 3 4 5 6 7 8 9 

check button Enriched GO biological processes.
GO IDTissueDisease StageDescriptionGene RatioBg Ratiopvaluep.adjustCount
GO:00104982ColorectumMSSproteasomal protein catabolic process157/3467490/187232.39e-135.25e-11157
GO:00064172ColorectumMSSregulation of translation134/3467468/187234.43e-082.38e-06134
GO:00313462ColorectumMSSpositive regulation of cell projection organization96/3467353/187233.44e-056.70e-0496
GO:00109752ColorectumMSSregulation of neuron projection development115/3467445/187236.91e-051.20e-03115
GO:0017148ColorectumMSSnegative regulation of translation64/3467245/187231.94e-031.67e-0264
GO:0034249ColorectumMSSnegative regulation of cellular amide metabolic process70/3467273/187232.07e-031.76e-0270
GO:00064174ColorectumFAPregulation of translation111/2622468/187238.47e-091.13e-06111
GO:00109753ColorectumFAPregulation of neuron projection development102/2622445/187232.04e-071.24e-05102
GO:00104984ColorectumFAPproteasomal protein catabolic process110/2622490/187232.12e-071.26e-05110
GO:00313463ColorectumFAPpositive regulation of cell projection organization82/2622353/187231.78e-067.35e-0582
GO:00171481ColorectumFAPnegative regulation of translation50/2622245/187233.57e-032.57e-0250
GO:00342491ColorectumFAPnegative regulation of cellular amide metabolic process54/2622273/187235.00e-033.33e-0254
GO:00109754ColorectumCRCregulation of neuron projection development82/2078445/187232.51e-061.19e-0482
GO:00313464ColorectumCRCpositive regulation of cell projection organization67/2078353/187237.45e-062.72e-0467
GO:00064175ColorectumCRCregulation of translation82/2078468/187231.79e-055.40e-0482
GO:00104985ColorectumCRCproteasomal protein catabolic process77/2078490/187231.03e-031.21e-0277
GO:00342492ColorectumCRCnegative regulation of cellular amide metabolic process45/2078273/187234.35e-033.47e-0245
GO:00171482ColorectumCRCnegative regulation of translation41/2078245/187234.82e-033.72e-0241
GO:0010498111EsophagusESCCproteasomal protein catabolic process369/8552490/187231.13e-411.80e-38369
GO:0006417111EsophagusESCCregulation of translation304/8552468/187231.53e-171.33e-15304
Page: 1 2 3 

check button Enriched KEGG pathways.
Pathway IDTissueDisease StageDescriptionGene RatioBg Ratiopvaluep.adjustqvalueCount
Page: 1 

Top

Cell-cell communication analysis

check buttonIdentification of potential cell-cell interactions between two cell types and their ligand-receptor pairs for different disease states
LigandReceptorLRpairPathwayTissueDisease Stage
Page: 1 

Top

Single-cell gene regulatory network inference analysis

check buttonFind out the significant the regulons (TFs) and the target genes of each regulon across cell types for different disease states
TFCell TypeTissueDisease StageTarget GeneRSSRegulon Activity
∗The dot plots of a searched regulon are shown for all cell subpopulations in each disease state of each tissue based on the regulon specific score inferred using pySCENIC and by calculating the average expression.
Page: 1 

Top

Somatic mutation of malignant transformation related genes

check buttonAnnotation of somatic variants for genes involved in malignant transformation
Hugo SymbolVariant ClassVariant ClassificationdbSNP RSHGVScHGVSpHGVSp ShortSWISSPROTBIOTYPESIFTPolyPhenTumor Sample BarcodeTissueHistologySexAgeStageTherapy TypesDrugsOutcome
ENC1SNVMissense_Mutationnovelc.1040N>Tp.Gly347Valp.G347VO14682protein_codingdeleterious(0.04)probably_damaging(0.957)TCGA-A7-A4SE-01Breastbreast invasive carcinomaFemale<65I/IIChemotherapyadriamycinCR
ENC1SNVMissense_Mutationc.901G>Cp.Gly301Argp.G301RO14682protein_codingdeleterious(0)probably_damaging(0.997)TCGA-A8-A09A-01Breastbreast invasive carcinomaFemale<65I/IIHormone TherapytamoxiphenSD
ENC1SNVMissense_Mutationc.392N>Tp.Asp131Valp.D131VO14682protein_codingtolerated(0.25)possibly_damaging(0.794)TCGA-AO-A1KT-01Breastbreast invasive carcinomaFemale>=65I/IIChemotherapyfluorouracilSD
ENC1insertionFrame_Shift_Insnovelc.686_687insGAGCp.Pro230SerfsTer35p.P230Sfs*35O14682protein_codingTCGA-A2-A0CQ-01Breastbreast invasive carcinomaFemale<65I/IIChemotherapyadriamycinSD
ENC1insertionIn_Frame_Insnovelc.685_686insAGTGGACCAAAGTGGGAGATGTGACAGCAAAGCGCAp.Leu229delinsGlnTrpThrLysValGlyAspValThrAlaLysArgIlep.L229delinsQWTKVGDVTAKRIO14682protein_codingTCGA-A2-A0CQ-01Breastbreast invasive carcinomaFemale<65I/IIChemotherapyadriamycinSD
ENC1insertionIn_Frame_Insnovelc.229_230insAATp.Gly77delinsGluCysp.G77delinsECO14682protein_codingTCGA-A8-A08H-01Breastbreast invasive carcinomaFemale>=65I/IIUnknownUnknownSD
ENC1insertionIn_Frame_Insnovelc.228_229insAAGGCTGGCACTTCTGCCAGCCATCTATCTCATGGAp.Ser76_Gly77insLysAlaGlyThrSerAlaSerHisLeuSerHisGlyp.S76_G77insKAGTSASHLSHGO14682protein_codingTCGA-A8-A08H-01Breastbreast invasive carcinomaFemale>=65I/IIUnknownUnknownSD
ENC1insertionFrame_Shift_Insnovelc.290_291insTGGACTGCTACGATCCAACAp.Leu98GlyfsTer103p.L98Gfs*103O14682protein_codingTCGA-BH-A0EB-01Breastbreast invasive carcinomaFemale>=65I/IIHormone TherapyarimidexSD
ENC1SNVMissense_Mutationc.367N>Tp.Ala123Serp.A123SO14682protein_codingdeleterious(0.01)probably_damaging(0.99)TCGA-JW-A5VK-01Cervixcervical & endocervical cancerFemale<65I/IIUnknownUnknownSD
ENC1SNVMissense_Mutationnovelc.1726N>Cp.Ile576Leup.I576LO14682protein_codingdeleterious_low_confidence(0)possibly_damaging(0.626)TCGA-A6-5665-01Colorectumcolon adenocarcinomaFemale>=65I/IIUnknownUnknownPD
Page: 1 2 3 4 5 6 7 8 

Top

Related drugs of malignant transformation related genes

check buttonIdentification of chemicals and drugs interact with genes involved in malignant transfromation
(DGIdb 4.0)
Entrez IDSymbolCategoryInteraction TypesDrug Claim NameDrug NamePMIDs
Page: 1