
|
|||||
|
 | |
| |
| |
| |
| |
| |
|
Gene: EMX2 |
Gene summary for EMX2 |
| Gene information | Species | Human | Gene symbol | EMX2 | Gene ID | 2018 |
| Gene name | empty spiracles homeobox 2 | |
| Gene Alias | EMX2 | |
| Cytomap | 10q26.11 | |
| Gene Type | protein-coding | GO ID | GO:0001655 | UniProtAcc | Q04743 |
Top |
Malignant transformation analysis |
| Identification of the aberrant gene expression in precancerous and cancerous lesions by comparing the gene expression of stem-like cells in diseased tissues with normal stem cells |
| Entrez ID | Symbol | Replicates | Species | Organ | Tissue | Adj P-value | Log2FC | Malignancy |
| 2018 | EMX2 | AEH-subject2 | Human | Endometrium | AEH | 8.21e-13 | -3.91e-01 | -0.2525 |
| 2018 | EMX2 | AEH-subject3 | Human | Endometrium | AEH | 7.85e-13 | -3.67e-01 | -0.2576 |
| 2018 | EMX2 | AEH-subject4 | Human | Endometrium | AEH | 3.79e-14 | -5.15e-01 | -0.2657 |
| 2018 | EMX2 | AEH-subject5 | Human | Endometrium | AEH | 8.49e-09 | -3.77e-01 | -0.2953 |
| 2018 | EMX2 | EEC-subject1 | Human | Endometrium | EEC | 1.24e-12 | -3.25e-01 | -0.2682 |
| 2018 | EMX2 | EEC-subject2 | Human | Endometrium | EEC | 2.17e-05 | -2.13e-01 | -0.2607 |
| 2018 | EMX2 | EEC-subject3 | Human | Endometrium | EEC | 1.31e-33 | -3.24e-01 | -0.2525 |
| 2018 | EMX2 | EEC-subject4 | Human | Endometrium | EEC | 3.74e-36 | -6.22e-01 | -0.2571 |
| 2018 | EMX2 | EEC-subject5 | Human | Endometrium | EEC | 7.35e-53 | -7.19e-01 | -0.249 |
| 2018 | EMX2 | GSM5276934 | Human | Endometrium | EEC | 1.81e-41 | -6.52e-01 | -0.0913 |
| 2018 | EMX2 | GSM5276937 | Human | Endometrium | EEC | 8.09e-21 | -5.63e-01 | -0.0897 |
| 2018 | EMX2 | GSM6177620_NYU_UCEC1_lib1_lib1 | Human | Endometrium | EEC | 1.49e-20 | -1.14e-01 | -0.1869 |
| 2018 | EMX2 | GSM6177620_NYU_UCEC1_lib2_lib2 | Human | Endometrium | EEC | 1.35e-18 | -2.52e-01 | -0.1875 |
| 2018 | EMX2 | GSM6177620_NYU_UCEC1_lib3_lib3 | Human | Endometrium | EEC | 2.25e-23 | -2.53e-01 | -0.1883 |
| 2018 | EMX2 | GSM6177621_NYU_UCEC2_lib1_lib1 | Human | Endometrium | EEC | 1.12e-29 | -9.73e-02 | -0.1934 |
| 2018 | EMX2 | GSM6177622_NYU_UCEC3_lib1_lib1 | Human | Endometrium | EEC | 1.54e-48 | -1.93e-01 | -0.1917 |
| 2018 | EMX2 | GSM6177622_NYU_UCEC3_lib2_lib2 | Human | Endometrium | EEC | 1.58e-36 | -3.34e-01 | -0.1916 |
| 2018 | EMX2 | GSM6177623_NYU_UCEC3_Vis | Human | Endometrium | EEC | 8.60e-07 | -3.12e-01 | -0.1269 |
| Page: 1 |
| Tissue | Expression Dynamics | Abbreviation |
| Endometrium | 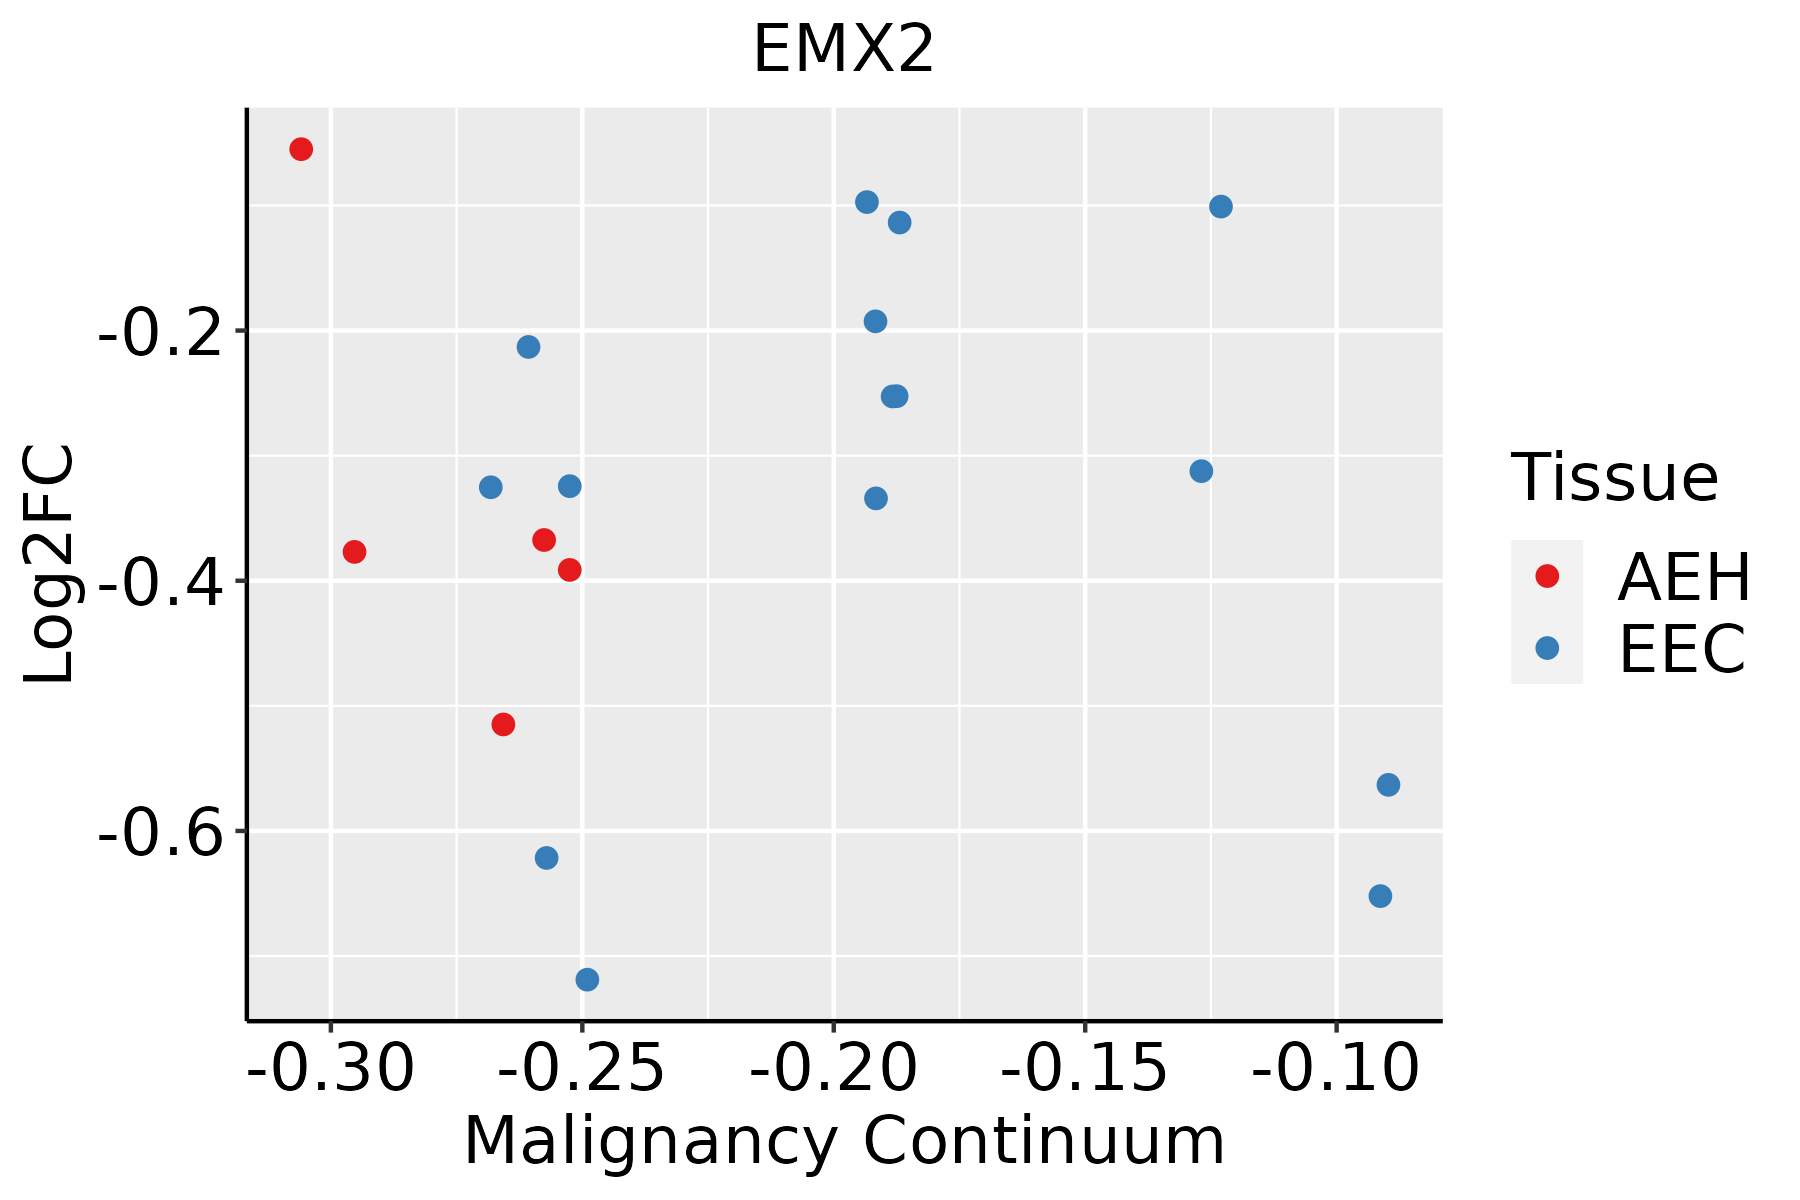 | AEH: Atypical endometrial hyperplasia |
| EEC: Endometrioid Cancer |
| ∗log2FC in expression of this searched gene in stem-like cells from each diseased tissue sample relative to stem-like cells in normal samples in each tissue plotted against the malignancy continuum. Samples are colored based on if they are from different disease stage. |
Top |
Malignant transformation related pathway analysis |
| Find out the enriched GO biological processes and KEGG pathways involved in transition from healthy to precancer to cancer |
| Tissue | Disease Stage | Enriched GO biological Processes |
| Colorectum | AD |  |
| Colorectum | SER |  |
| Colorectum | MSS |  |
| Colorectum | MSI-H |  |
| Colorectum | FAP |  |
| ∗Top 15 enriched GO BP terms are showed in the bar plot of each disease state in each tissue. Each row represents a significant GO biological process which is colored according to the -log10(p.adjust). |
| Page: 1 2 3 4 5 6 7 8 9 |
| GO ID | Tissue | Disease Stage | Description | Gene Ratio | Bg Ratio | pvalue | p.adjust | Count |
| GO:00016556 | Endometrium | AEH | urogenital system development | 67/2100 | 338/18723 | 2.30e-06 | 6.76e-05 | 67 |
| GO:00720015 | Endometrium | AEH | renal system development | 61/2100 | 302/18723 | 3.43e-06 | 9.24e-05 | 61 |
| GO:000941010 | Endometrium | AEH | response to xenobiotic stimulus | 71/2100 | 462/18723 | 3.66e-03 | 2.50e-02 | 71 |
| GO:000165512 | Endometrium | EEC | urogenital system development | 69/2168 | 338/18723 | 1.70e-06 | 5.18e-05 | 69 |
| GO:007200112 | Endometrium | EEC | renal system development | 63/2168 | 302/18723 | 2.24e-06 | 6.59e-05 | 63 |
| GO:00613511 | Endometrium | EEC | neural precursor cell proliferation | 29/2168 | 145/18723 | 2.24e-03 | 1.67e-02 | 29 |
| GO:000941015 | Endometrium | EEC | response to xenobiotic stimulus | 73/2168 | 462/18723 | 3.55e-03 | 2.38e-02 | 73 |
| GO:00219874 | Endometrium | EEC | cerebral cortex development | 23/2168 | 114/18723 | 5.41e-03 | 3.32e-02 | 23 |
| Page: 1 |
| Pathway ID | Tissue | Disease Stage | Description | Gene Ratio | Bg Ratio | pvalue | p.adjust | qvalue | Count |
| Page: 1 |
Top |
Cell-cell communication analysis |
| Identification of potential cell-cell interactions between two cell types and their ligand-receptor pairs for different disease states |
| Ligand | Receptor | LRpair | Pathway | Tissue | Disease Stage |
| Page: 1 |
Top |
Single-cell gene regulatory network inference analysis |
| Find out the significant the regulons (TFs) and the target genes of each regulon across cell types for different disease states |
| TF | Cell Type | Tissue | Disease Stage | Target Gene | RSS | Regulon Activity |
| EMX2 | COL | Cervix | HSIL_HPV | KRT8,TPM2,EPCAM, etc. | 2.99e-01 |  |
| EMX2 | GLAN | Endometrium | ADJ | EMX2OS,ZNF503,RAB11FIP2, etc. | 5.27e-01 |  |
| EMX2 | GLAN | Endometrium | Healthy | PBX1,ARHGAP6,SEMA3C, etc. | 6.18e-01 |  |
| EMX2 | NK | Esophagus | ADJ | RNF149,STIM1,RAB26, etc. | 1.52e-01 |  |
| EMX2 | ECM | Skin | cSCC | EMX2OS,HSPB7,EEF1AKMT2, etc. | 3.51e-02 |  |
| EMX2 | MYOFIB | Skin | SCCIS | EMX2OS,HSPB7,EEF1AKMT2, etc. | 1.17e-01 |  |
| ∗The dot plots of a searched regulon are shown for all cell subpopulations in each disease state of each tissue based on the regulon specific score inferred using pySCENIC and by calculating the average expression. |
| Page: 1 |
Top |
Somatic mutation of malignant transformation related genes |
| Annotation of somatic variants for genes involved in malignant transformation |
| Hugo Symbol | Variant Class | Variant Classification | dbSNP RS | HGVSc | HGVSp | HGVSp Short | SWISSPROT | BIOTYPE | SIFT | PolyPhen | Tumor Sample Barcode | Tissue | Histology | Sex | Age | Stage | Therapy Types | Drugs | Outcome |
| EMX2 | SNV | Missense_Mutation | c.644N>G | p.Glu215Gly | p.E215G | Q04743 | protein_coding | deleterious(0.04) | benign(0.168) | TCGA-A8-A08R-01 | Breast | breast invasive carcinoma | Female | <65 | I/II | Unknown | Unknown | SD | |
| EMX2 | SNV | Missense_Mutation | c.6C>A | p.Phe2Leu | p.F2L | Q04743 | protein_coding | deleterious(0) | probably_damaging(0.989) | TCGA-VS-A959-01 | Cervix | cervical & endocervical cancer | Female | >=65 | I/II | Unknown | Unknown | SD | |
| EMX2 | SNV | Missense_Mutation | c.754N>T | p.Asp252Tyr | p.D252Y | Q04743 | protein_coding | deleterious(0) | probably_damaging(0.99) | TCGA-A6-6141-01 | Colorectum | colon adenocarcinoma | Male | <65 | I/II | Chemotherapy | 5-fu | SD | |
| EMX2 | SNV | Missense_Mutation | novel | c.410N>G | p.Asn137Ser | p.N137S | Q04743 | protein_coding | tolerated(0.88) | benign(0.007) | TCGA-AA-3845-01 | Colorectum | colon adenocarcinoma | Female | >=65 | I/II | Unknown | Unknown | PD |
| EMX2 | SNV | Missense_Mutation | novel | c.593N>C | p.Val198Ala | p.V198A | Q04743 | protein_coding | deleterious(0) | probably_damaging(0.996) | TCGA-AA-A00N-01 | Colorectum | colon adenocarcinoma | Male | >=65 | I/II | Unknown | Unknown | PD |
| EMX2 | SNV | Missense_Mutation | c.473N>A | p.Arg158Gln | p.R158Q | Q04743 | protein_coding | deleterious(0) | probably_damaging(0.999) | TCGA-AA-A010-01 | Colorectum | colon adenocarcinoma | Female | <65 | I/II | Chemotherapy | folinic | CR | |
| EMX2 | SNV | Missense_Mutation | c.647A>G | p.Glu216Gly | p.E216G | Q04743 | protein_coding | deleterious(0.03) | benign(0.346) | TCGA-G4-6320-01 | Colorectum | colon adenocarcinoma | Male | >=65 | III/IV | Chemotherapy | oxaliplatin | SD | |
| EMX2 | SNV | Missense_Mutation | novel | c.426N>T | p.Glu142Asp | p.E142D | Q04743 | protein_coding | tolerated(0.4) | benign(0.003) | TCGA-AG-A002-01 | Colorectum | rectum adenocarcinoma | Male | <65 | I/II | Unknown | Unknown | SD |
| EMX2 | SNV | Missense_Mutation | c.547N>A | p.Glu183Lys | p.E183K | Q04743 | protein_coding | deleterious(0.02) | possibly_damaging(0.901) | TCGA-AG-A002-01 | Colorectum | rectum adenocarcinoma | Male | <65 | I/II | Unknown | Unknown | SD | |
| EMX2 | SNV | Missense_Mutation | c.478N>A | p.Ala160Thr | p.A160T | Q04743 | protein_coding | deleterious(0) | probably_damaging(0.919) | TCGA-EI-7002-01 | Colorectum | rectum adenocarcinoma | Male | <65 | III/IV | Chemotherapy | irinotecan+5-fluorouracilim | SD |
| Page: 1 2 3 4 |
Top |
Related drugs of malignant transformation related genes |
| Identification of chemicals and drugs interact with genes involved in malignant transfromation |
| (DGIdb 4.0) |
| Entrez ID | Symbol | Category | Interaction Types | Drug Claim Name | Drug Name | PMIDs |
| Page: 1 |

Copyright 2023-Present -The University of Texas Health Science Center at Houston |