
|
|||||
|
 | |
| |
| |
| |
| |
| |
|
Gene: EMP3 |
Gene summary for EMP3 |
| Gene information | Species | Human | Gene symbol | EMP3 | Gene ID | 2014 |
| Gene name | epithelial membrane protein 3 | |
| Gene Alias | YMP | |
| Cytomap | 19q13.33 | |
| Gene Type | protein-coding | GO ID | GO:0008150 | UniProtAcc | A0A024QZF8 |
Top |
Malignant transformation analysis |
| Identification of the aberrant gene expression in precancerous and cancerous lesions by comparing the gene expression of stem-like cells in diseased tissues with normal stem cells |
| Entrez ID | Symbol | Replicates | Species | Organ | Tissue | Adj P-value | Log2FC | Malignancy |
| 2014 | EMP3 | GSM4909281 | Human | Breast | IDC | 7.65e-05 | -2.70e-01 | 0.21 |
| 2014 | EMP3 | GSM4909282 | Human | Breast | IDC | 8.13e-05 | -2.71e-01 | -0.0288 |
| 2014 | EMP3 | GSM4909285 | Human | Breast | IDC | 2.80e-03 | -2.21e-01 | 0.21 |
| 2014 | EMP3 | GSM4909286 | Human | Breast | IDC | 1.48e-05 | -2.99e-01 | 0.1081 |
| 2014 | EMP3 | GSM4909290 | Human | Breast | IDC | 5.21e-05 | -2.87e-01 | 0.2096 |
| 2014 | EMP3 | GSM4909294 | Human | Breast | IDC | 5.24e-05 | -2.39e-01 | 0.2022 |
| 2014 | EMP3 | GSM4909296 | Human | Breast | IDC | 6.44e-08 | -2.92e-01 | 0.1524 |
| 2014 | EMP3 | GSM4909297 | Human | Breast | IDC | 9.79e-07 | -2.36e-01 | 0.1517 |
| 2014 | EMP3 | GSM4909298 | Human | Breast | IDC | 5.02e-04 | -2.74e-01 | 0.1551 |
| 2014 | EMP3 | GSM4909304 | Human | Breast | IDC | 2.10e-02 | -2.55e-01 | 0.1636 |
| 2014 | EMP3 | GSM4909307 | Human | Breast | IDC | 2.93e-02 | -2.55e-01 | 0.1569 |
| 2014 | EMP3 | GSM4909311 | Human | Breast | IDC | 9.70e-10 | -2.91e-01 | 0.1534 |
| 2014 | EMP3 | GSM4909312 | Human | Breast | IDC | 3.04e-13 | -3.13e-01 | 0.1552 |
| 2014 | EMP3 | GSM4909313 | Human | Breast | IDC | 2.68e-03 | -2.51e-01 | 0.0391 |
| 2014 | EMP3 | GSM4909315 | Human | Breast | IDC | 7.63e-04 | -2.88e-01 | 0.21 |
| 2014 | EMP3 | GSM4909319 | Human | Breast | IDC | 7.69e-10 | -2.26e-01 | 0.1563 |
| 2014 | EMP3 | GSM4909321 | Human | Breast | IDC | 5.74e-10 | -3.05e-01 | 0.1559 |
| 2014 | EMP3 | brca1 | Human | Breast | Precancer | 5.48e-13 | 5.72e-01 | -0.0338 |
| 2014 | EMP3 | brca2 | Human | Breast | Precancer | 2.45e-11 | 4.30e-01 | -0.024 |
| 2014 | EMP3 | brca3 | Human | Breast | Precancer | 1.82e-17 | 5.92e-01 | -0.0263 |
| Page: 1 2 3 4 5 6 7 8 9 10 |
| Tissue | Expression Dynamics | Abbreviation |
| Breast | 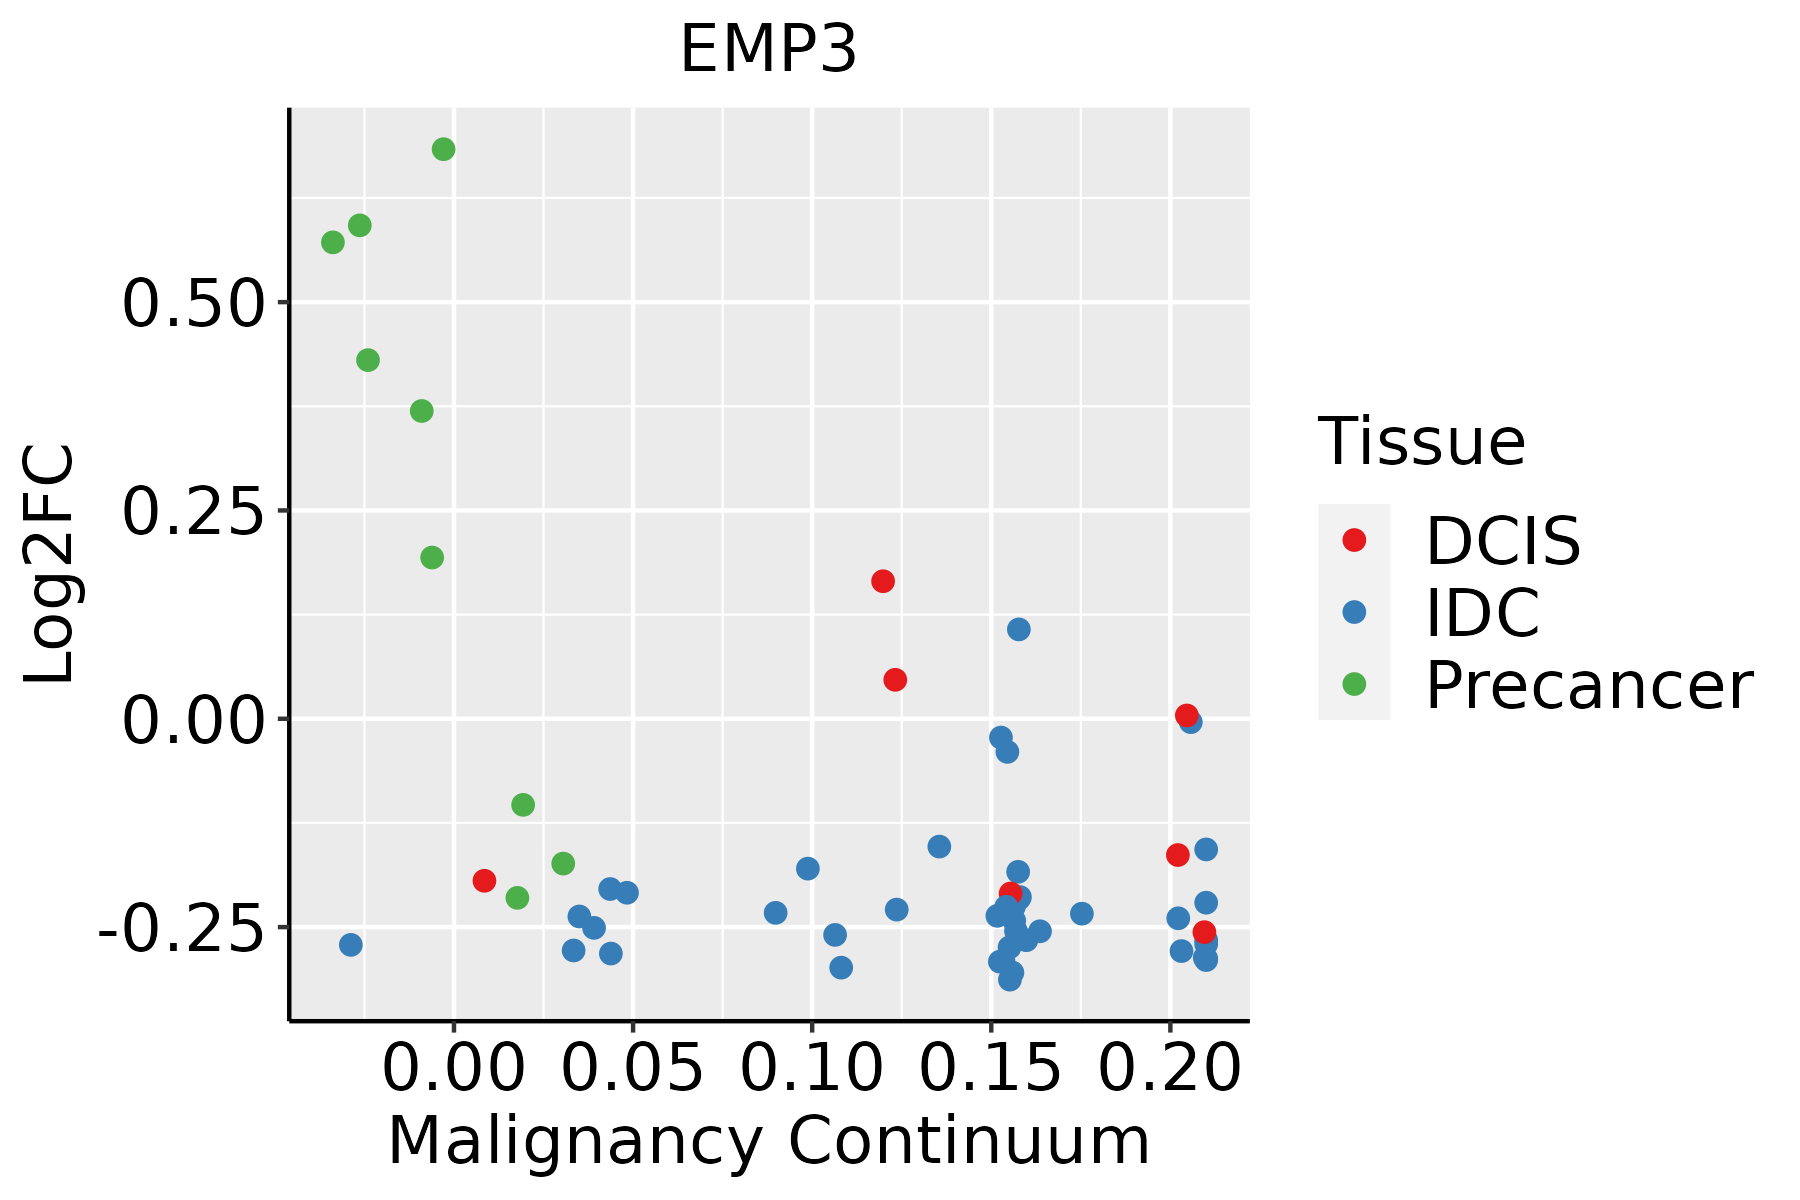 | IDC: Invasive ductal carcinoma |
| DCIS: Ductal carcinoma in situ | ||
| Precancer(BRCA1-mut): Precancerous lesion from BRCA1 mutation carriers | ||
| Cervix | 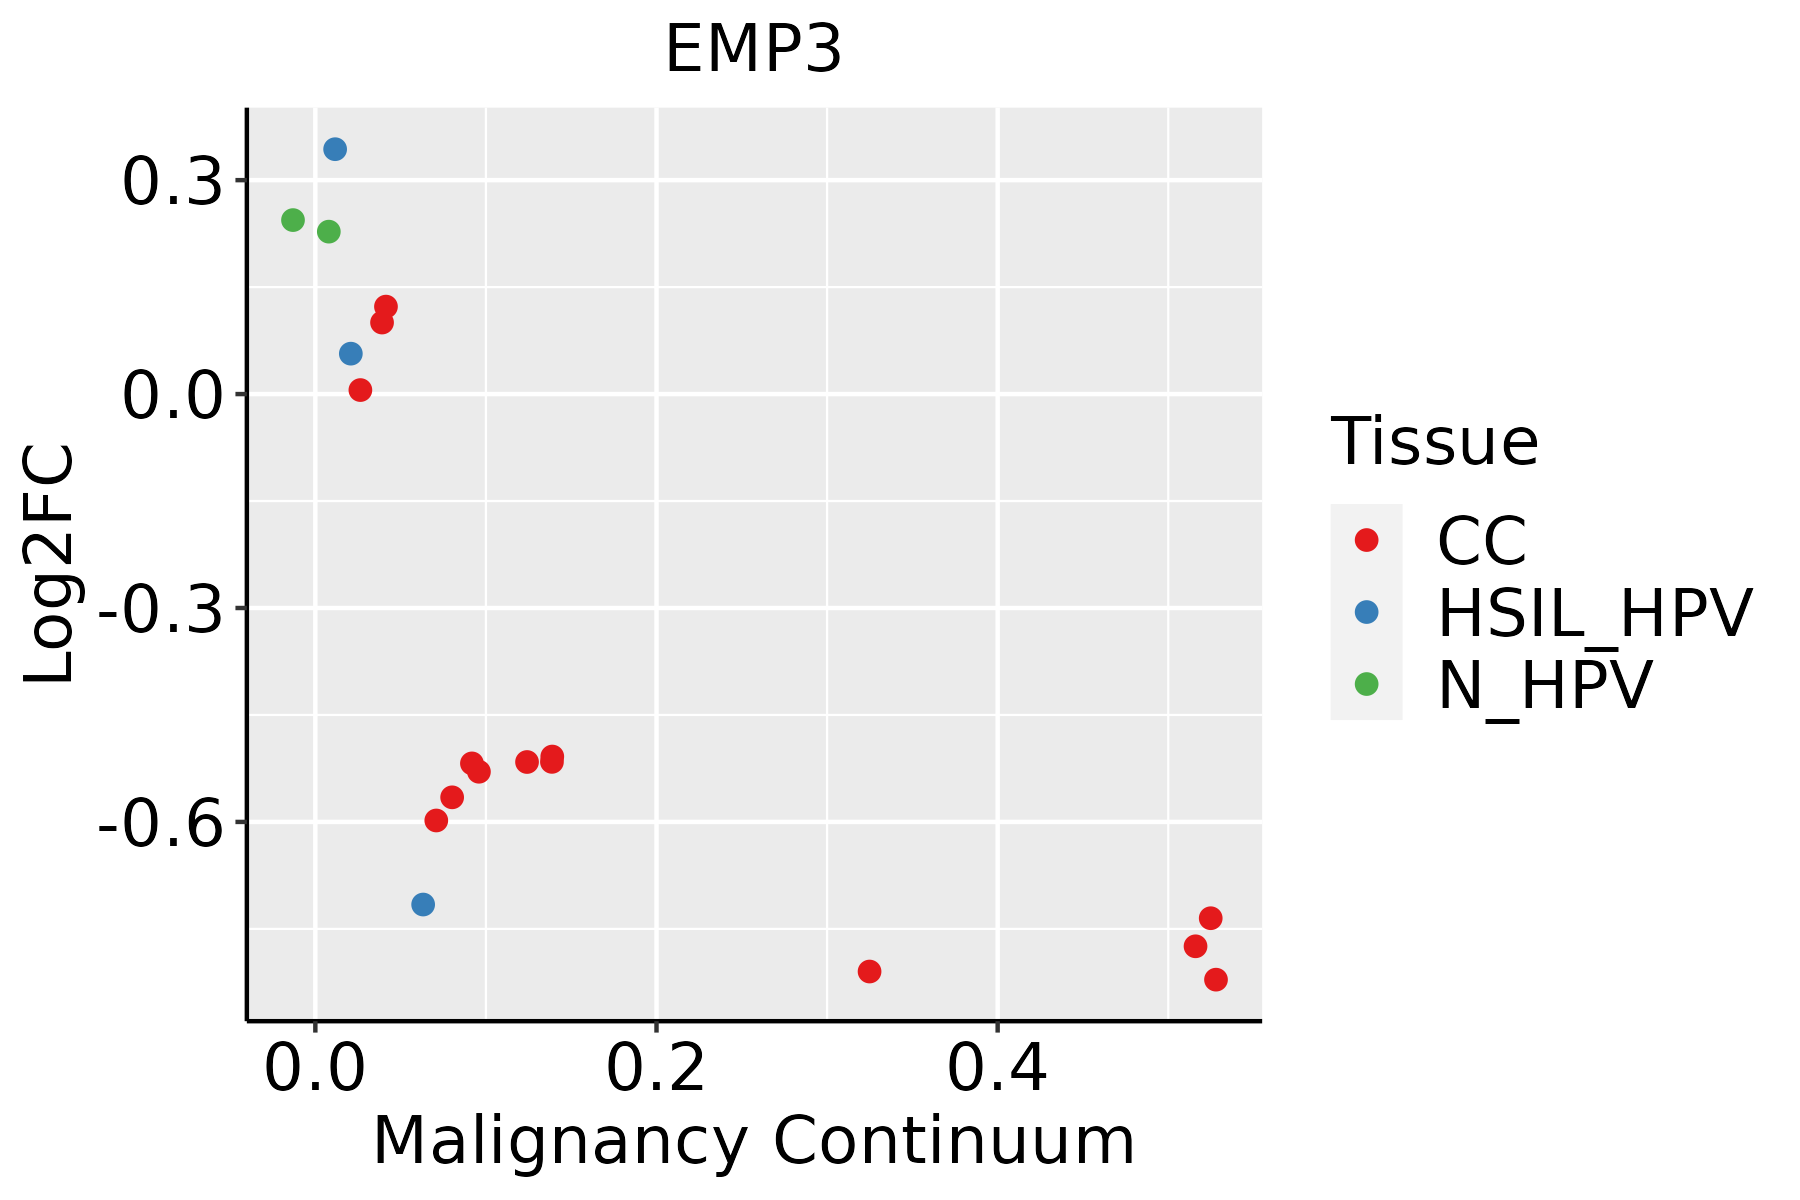 | CC: Cervix cancer |
| HSIL_HPV: HPV-infected high-grade squamous intraepithelial lesions | ||
| N_HPV: HPV-infected normal cervix | ||
| Endometrium |  | AEH: Atypical endometrial hyperplasia |
| EEC: Endometrioid Cancer | ||
| Esophagus |  | ESCC: Esophageal squamous cell carcinoma |
| HGIN: High-grade intraepithelial neoplasias | ||
| LGIN: Low-grade intraepithelial neoplasias | ||
| Liver | 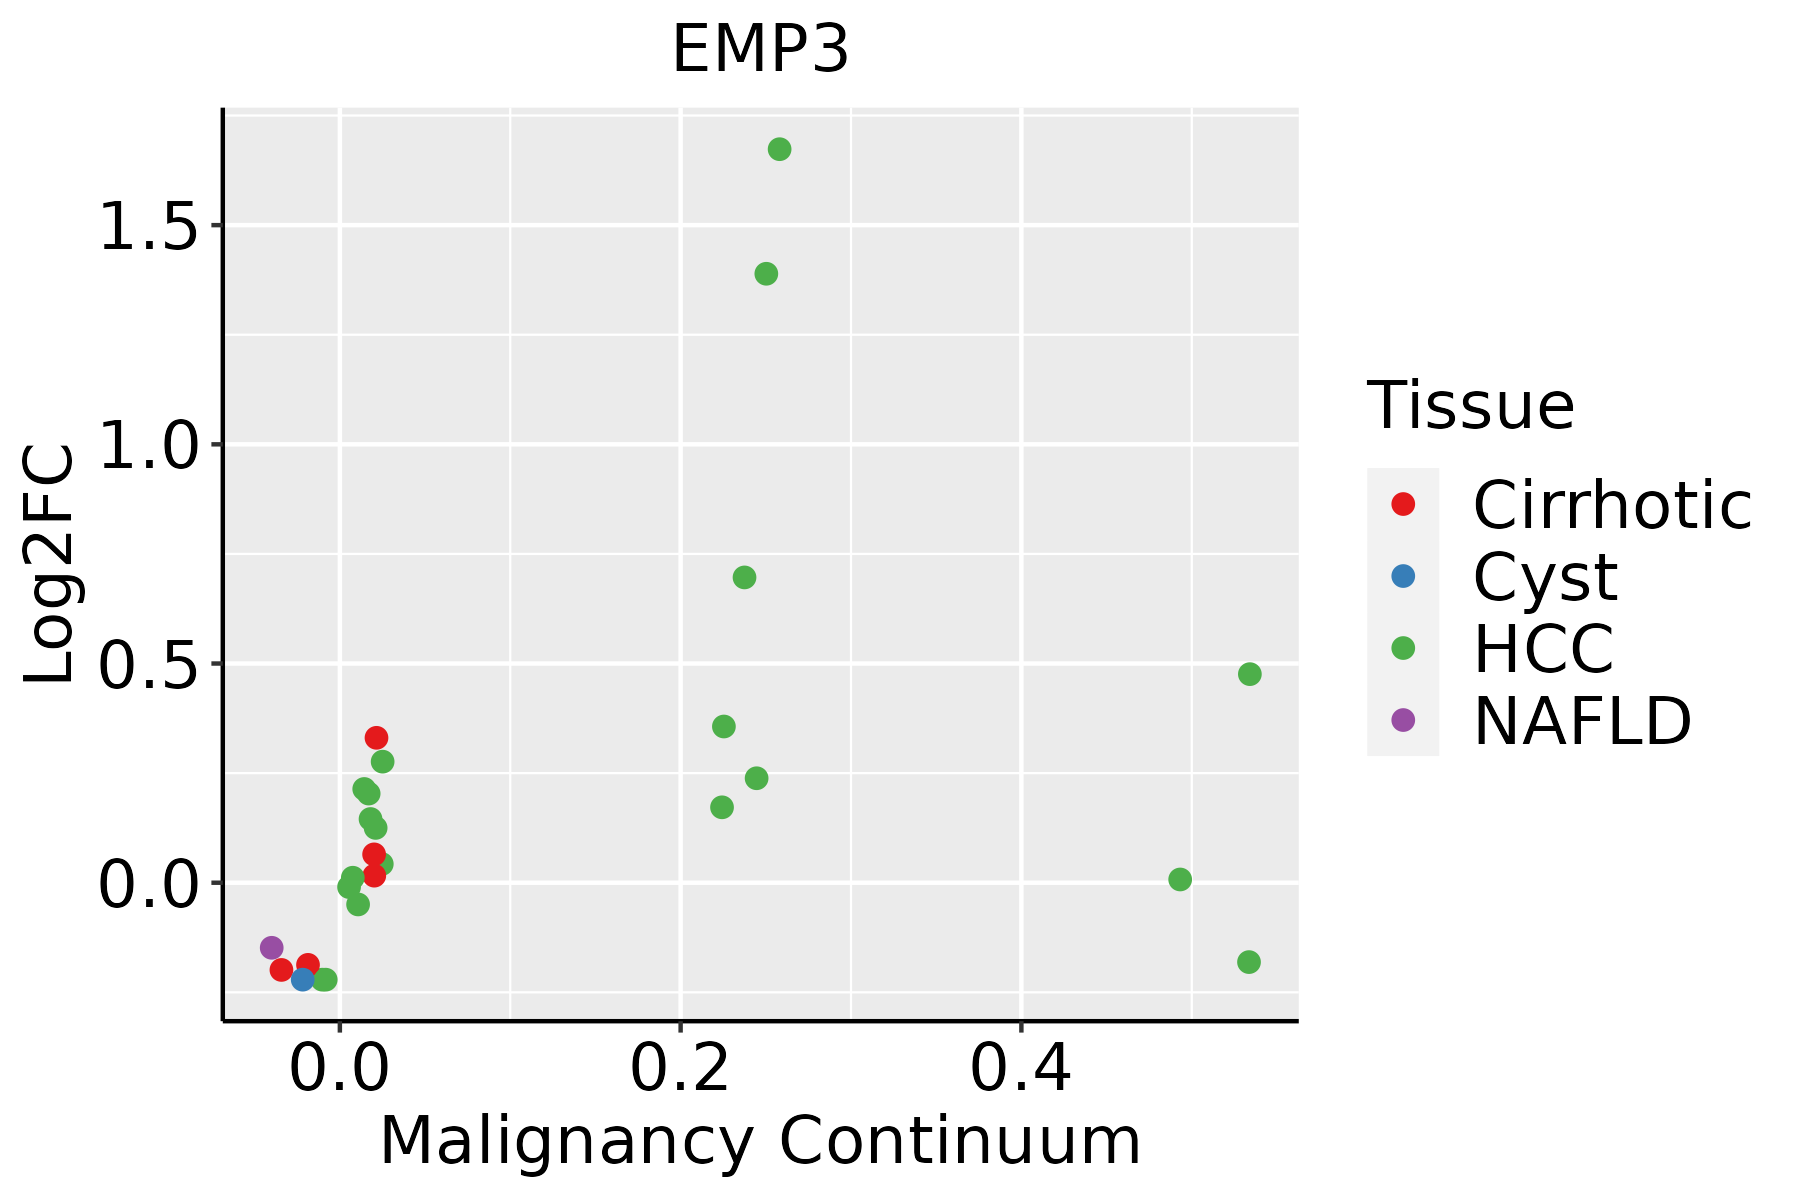 | HCC: Hepatocellular carcinoma |
| NAFLD: Non-alcoholic fatty liver disease | ||
| Oral Cavity | 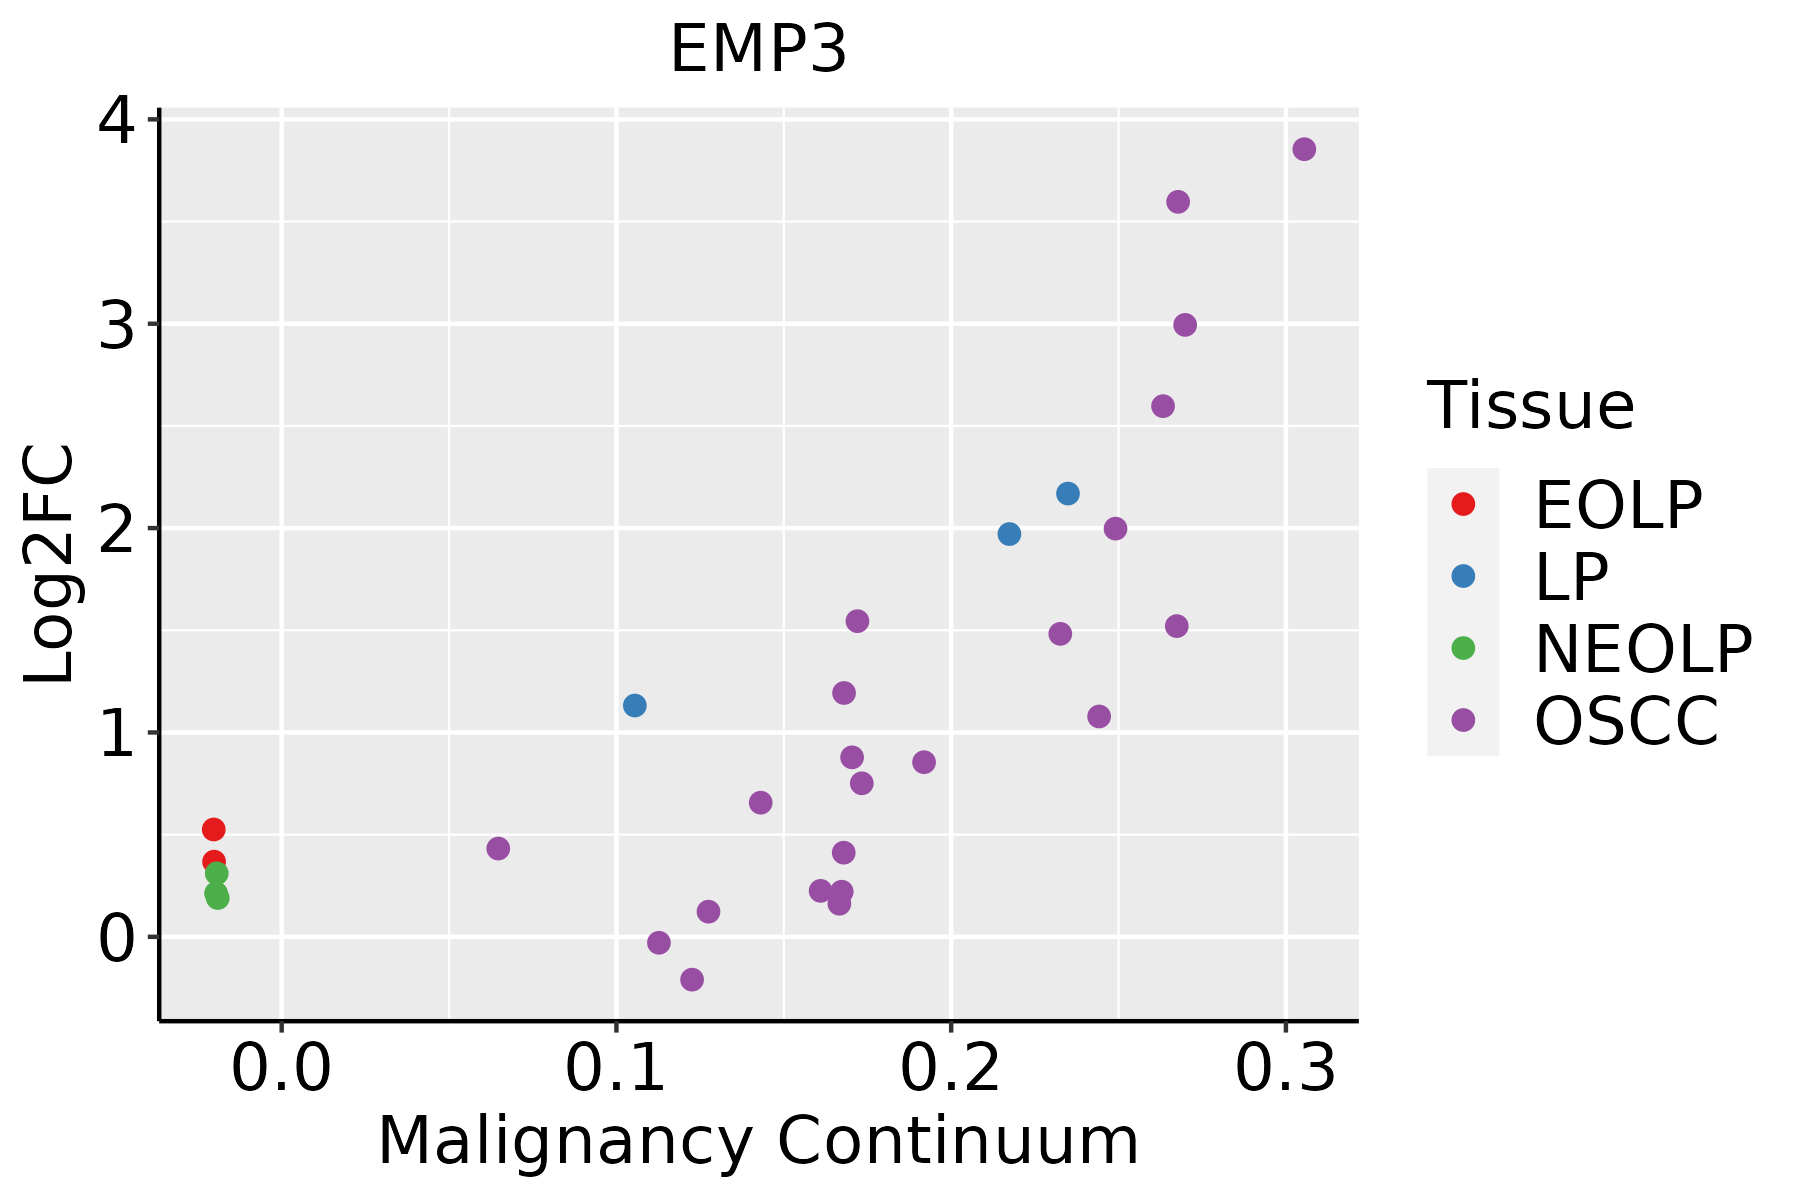 | EOLP: Erosive Oral lichen planus |
| LP: leukoplakia | ||
| NEOLP: Non-erosive oral lichen planus | ||
| OSCC: Oral squamous cell carcinoma | ||
| Prostate | 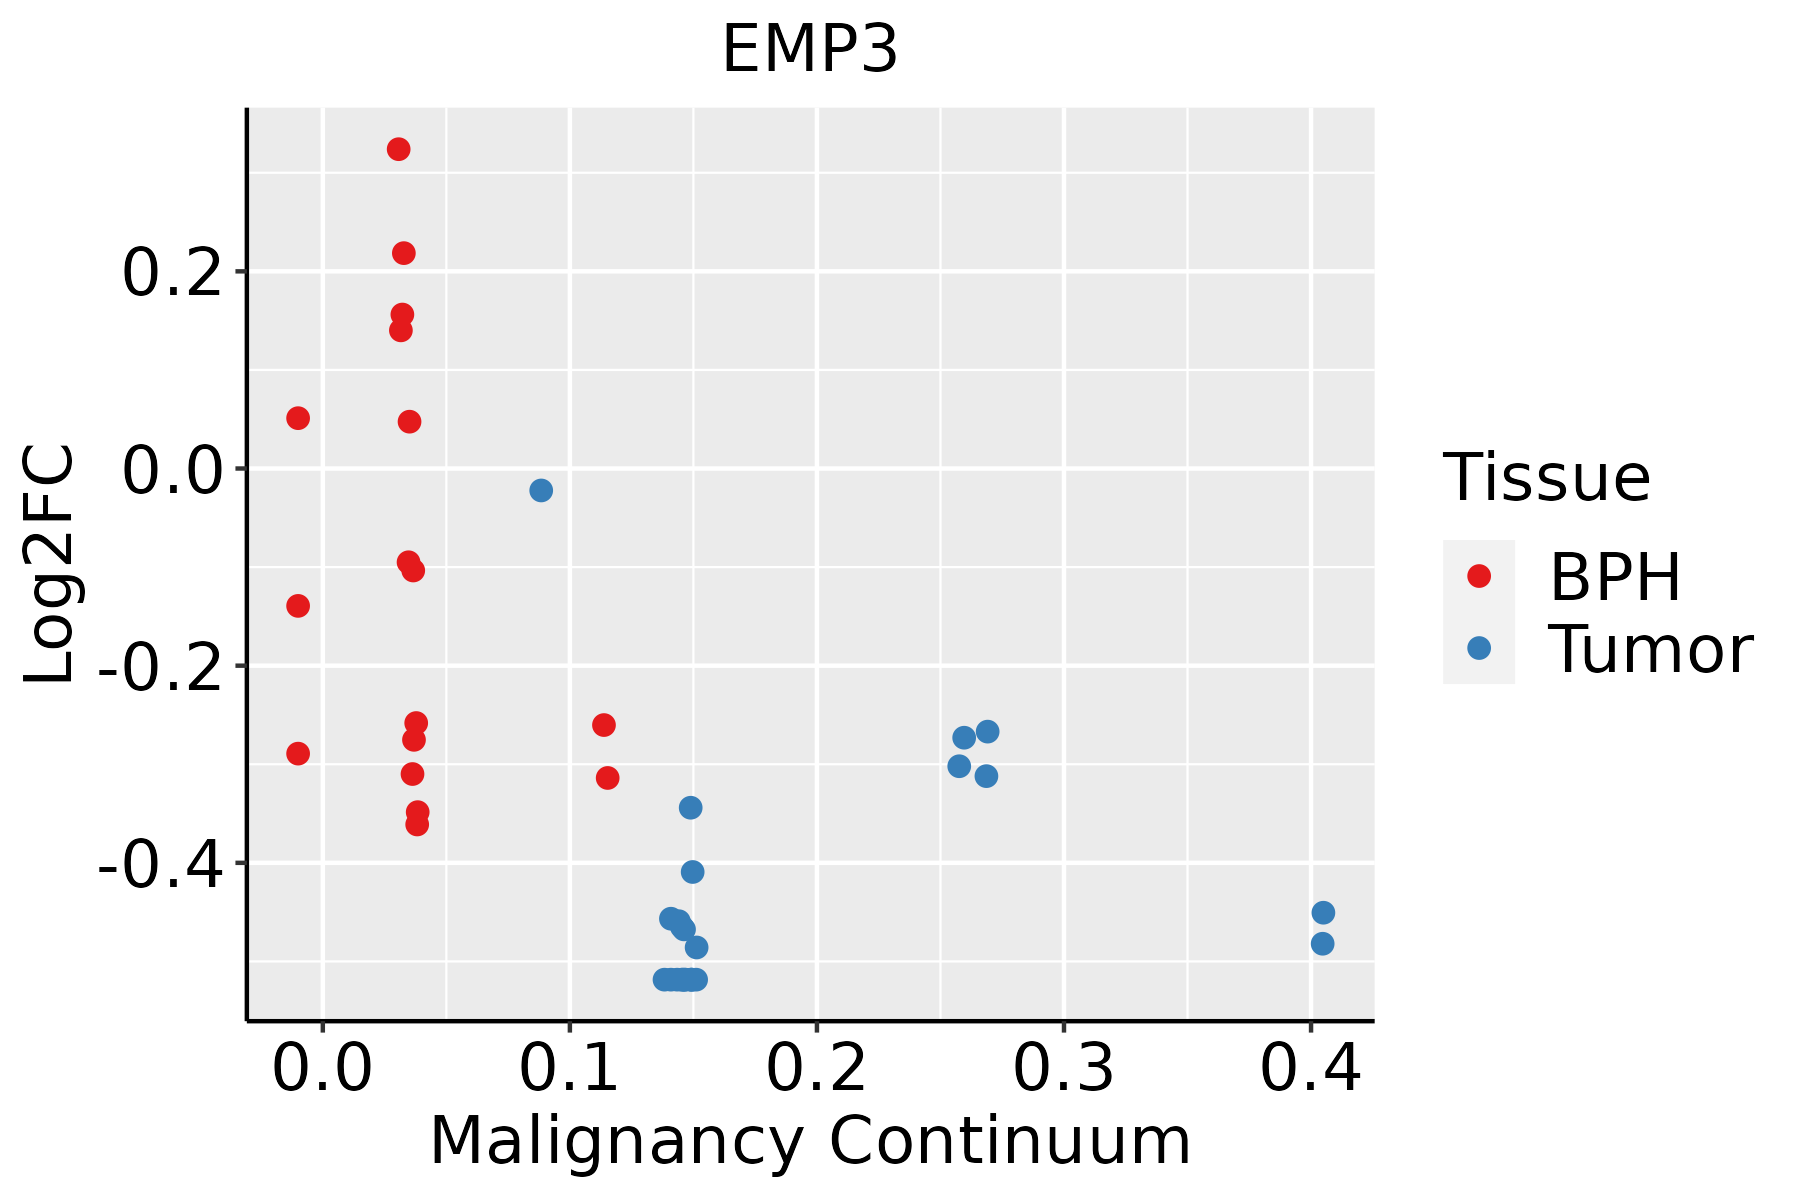 | BPH: Benign Prostatic Hyperplasia |
| Skin | 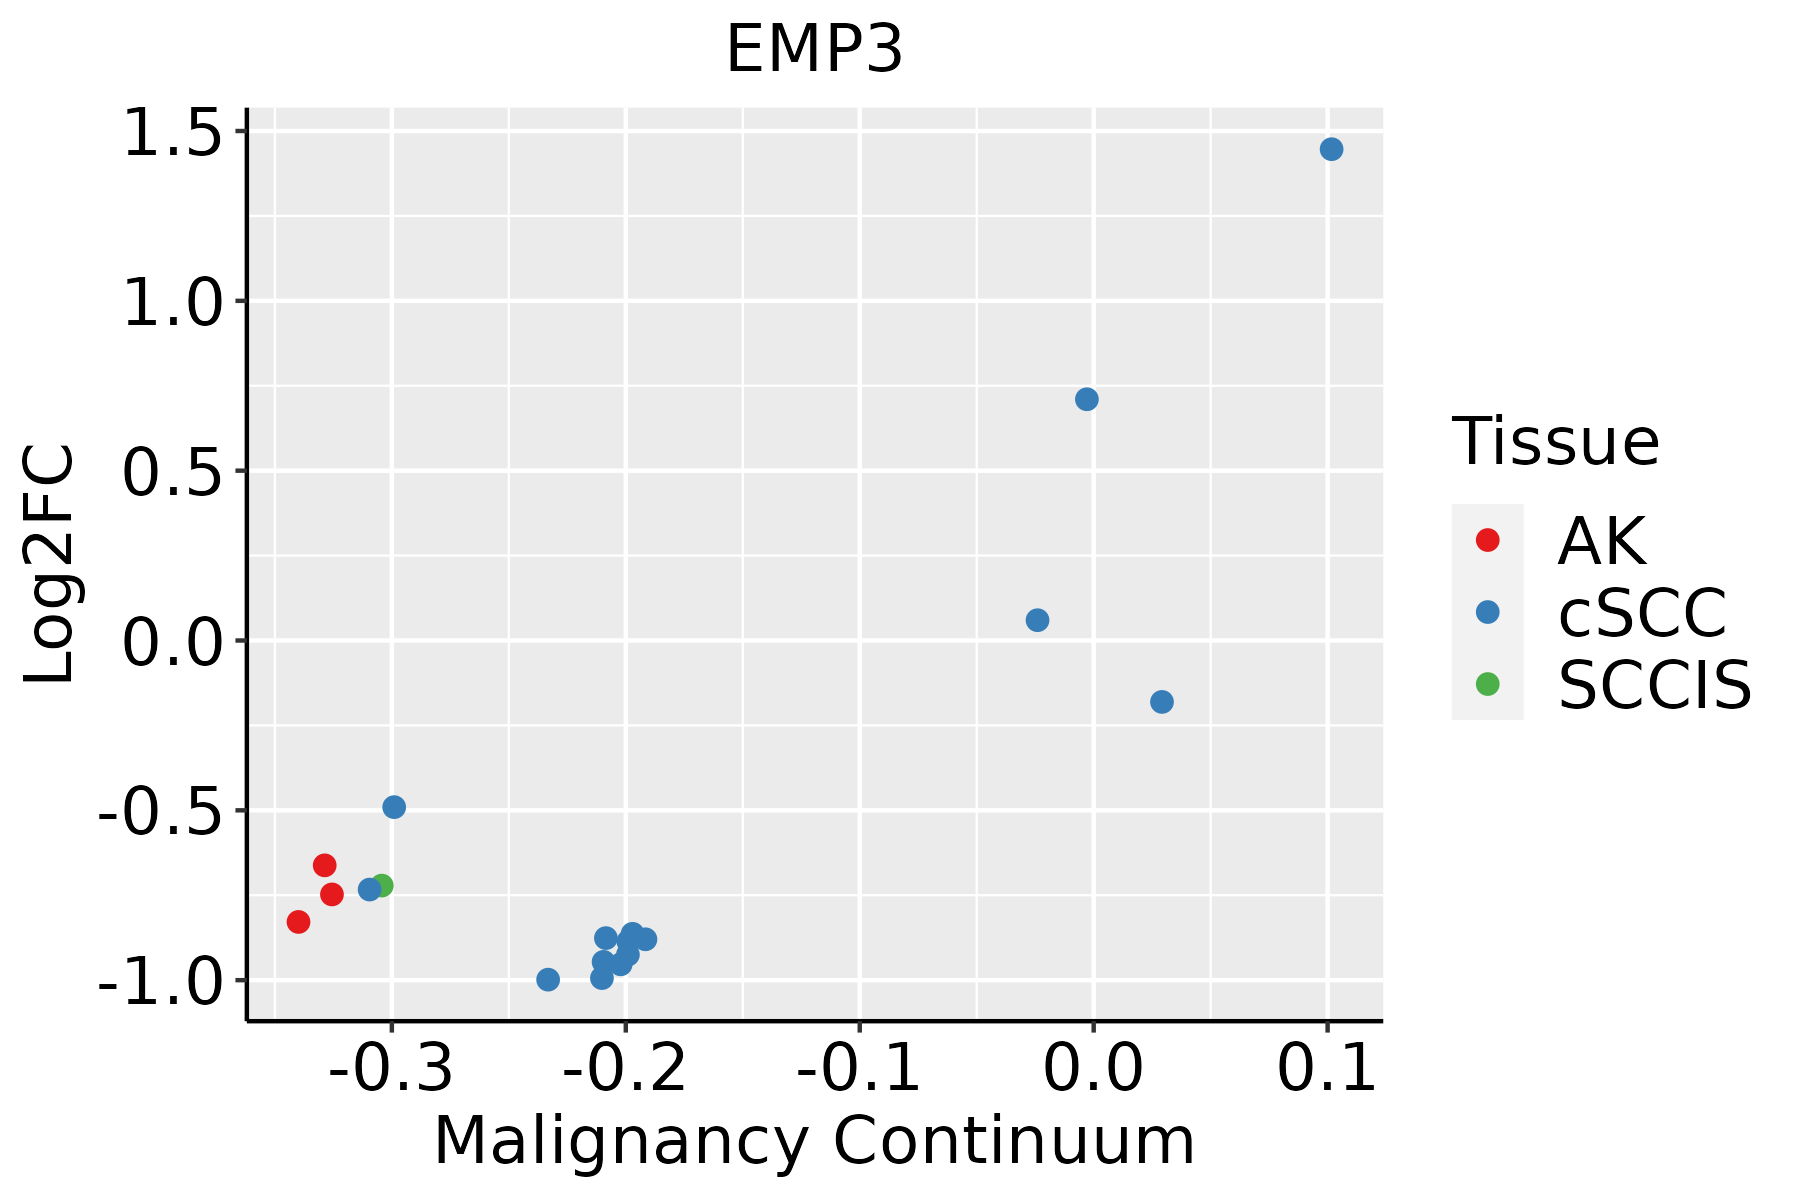 | AK: Actinic keratosis |
| cSCC: Cutaneous squamous cell carcinoma | ||
| SCCIS:squamous cell carcinoma in situ | ||
| Thyroid | 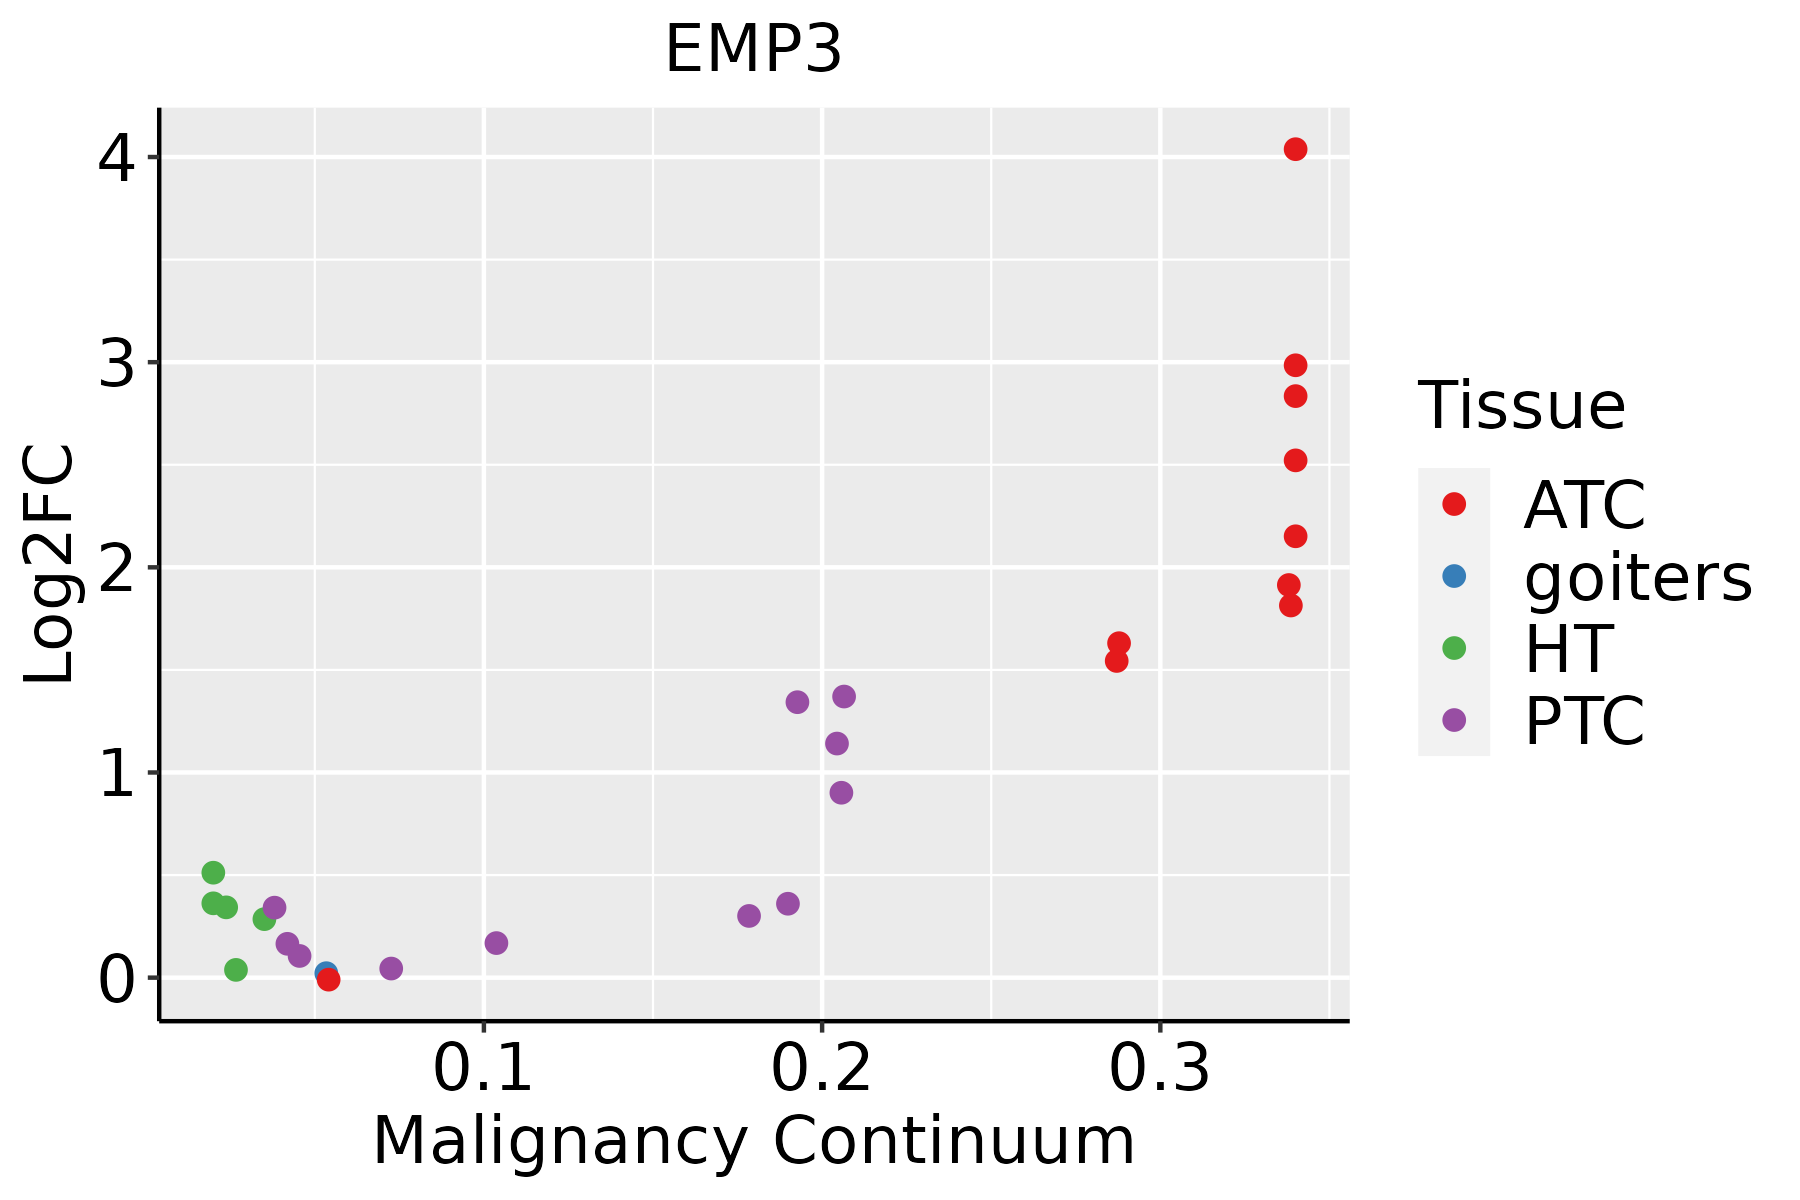 | ATC: Anaplastic thyroid cancer |
| HT: Hashimoto's thyroiditis | ||
| PTC: Papillary thyroid cancer |
| ∗log2FC in expression of this searched gene in stem-like cells from each diseased tissue sample relative to stem-like cells in normal samples in each tissue plotted against the malignancy continuum. Samples are colored based on if they are from different disease stage. |
Top |
Malignant transformation related pathway analysis |
| Find out the enriched GO biological processes and KEGG pathways involved in transition from healthy to precancer to cancer |
| Tissue | Disease Stage | Enriched GO biological Processes |
| Colorectum | AD |  |
| Colorectum | SER |  |
| Colorectum | MSS |  |
| Colorectum | MSI-H |  |
| Colorectum | FAP |  |
| ∗Top 15 enriched GO BP terms are showed in the bar plot of each disease state in each tissue. Each row represents a significant GO biological process which is colored according to the -log10(p.adjust). |
| Page: 1 2 3 4 5 6 7 8 9 |
| GO ID | Tissue | Disease Stage | Description | Gene Ratio | Bg Ratio | pvalue | p.adjust | Count |
| Page: 1 |
| Pathway ID | Tissue | Disease Stage | Description | Gene Ratio | Bg Ratio | pvalue | p.adjust | qvalue | Count |
| hsa043504 | Endometrium | AEH | TGF-beta signaling pathway | 26/1197 | 108/8465 | 3.82e-03 | 2.18e-02 | 1.59e-02 | 26 |
| hsa0435011 | Endometrium | AEH | TGF-beta signaling pathway | 26/1197 | 108/8465 | 3.82e-03 | 2.18e-02 | 1.59e-02 | 26 |
| hsa043502 | Endometrium | EEC | TGF-beta signaling pathway | 26/1237 | 108/8465 | 5.95e-03 | 3.12e-02 | 2.33e-02 | 26 |
| hsa043503 | Endometrium | EEC | TGF-beta signaling pathway | 26/1237 | 108/8465 | 5.95e-03 | 3.12e-02 | 2.33e-02 | 26 |
| hsa043507 | Esophagus | ESCC | TGF-beta signaling pathway | 69/4205 | 108/8465 | 1.92e-03 | 5.54e-03 | 2.84e-03 | 69 |
| hsa0435014 | Esophagus | ESCC | TGF-beta signaling pathway | 69/4205 | 108/8465 | 1.92e-03 | 5.54e-03 | 2.84e-03 | 69 |
| hsa043506 | Oral cavity | OSCC | TGF-beta signaling pathway | 60/3704 | 108/8465 | 8.66e-03 | 1.97e-02 | 1.00e-02 | 60 |
| hsa0435013 | Oral cavity | OSCC | TGF-beta signaling pathway | 60/3704 | 108/8465 | 8.66e-03 | 1.97e-02 | 1.00e-02 | 60 |
| hsa0435022 | Oral cavity | EOLP | TGF-beta signaling pathway | 29/1218 | 108/8465 | 4.81e-04 | 1.92e-03 | 1.13e-03 | 29 |
| hsa0435032 | Oral cavity | EOLP | TGF-beta signaling pathway | 29/1218 | 108/8465 | 4.81e-04 | 1.92e-03 | 1.13e-03 | 29 |
| hsa0435041 | Oral cavity | NEOLP | TGF-beta signaling pathway | 28/1112 | 108/8465 | 2.46e-04 | 1.62e-03 | 1.02e-03 | 28 |
| hsa0435051 | Oral cavity | NEOLP | TGF-beta signaling pathway | 28/1112 | 108/8465 | 2.46e-04 | 1.62e-03 | 1.02e-03 | 28 |
| hsa043505 | Prostate | BPH | TGF-beta signaling pathway | 35/1718 | 108/8465 | 1.98e-03 | 7.92e-03 | 4.90e-03 | 35 |
| hsa0435012 | Prostate | BPH | TGF-beta signaling pathway | 35/1718 | 108/8465 | 1.98e-03 | 7.92e-03 | 4.90e-03 | 35 |
| hsa0435021 | Prostate | Tumor | TGF-beta signaling pathway | 39/1791 | 108/8465 | 2.33e-04 | 1.35e-03 | 8.39e-04 | 39 |
| hsa0435031 | Prostate | Tumor | TGF-beta signaling pathway | 39/1791 | 108/8465 | 2.33e-04 | 1.35e-03 | 8.39e-04 | 39 |
| Page: 1 |
Top |
Cell-cell communication analysis |
| Identification of potential cell-cell interactions between two cell types and their ligand-receptor pairs for different disease states |
| Ligand | Receptor | LRpair | Pathway | Tissue | Disease Stage |
| Page: 1 |
Top |
Single-cell gene regulatory network inference analysis |
| Find out the significant the regulons (TFs) and the target genes of each regulon across cell types for different disease states |
| TF | Cell Type | Tissue | Disease Stage | Target Gene | RSS | Regulon Activity |
| ∗The dot plots of a searched regulon are shown for all cell subpopulations in each disease state of each tissue based on the regulon specific score inferred using pySCENIC and by calculating the average expression. |
| Page: 1 |
Top |
Somatic mutation of malignant transformation related genes |
| Annotation of somatic variants for genes involved in malignant transformation |
| Hugo Symbol | Variant Class | Variant Classification | dbSNP RS | HGVSc | HGVSp | HGVSp Short | SWISSPROT | BIOTYPE | SIFT | PolyPhen | Tumor Sample Barcode | Tissue | Histology | Sex | Age | Stage | Therapy Types | Drugs | Outcome |
| EMP3 | SNV | Missense_Mutation | c.46N>G | p.Leu16Val | p.L16V | P54852 | protein_coding | tolerated(0.12) | probably_damaging(0.995) | TCGA-EA-A50E-01 | Cervix | cervical & endocervical cancer | Female | <65 | I/II | Unknown | Unknown | PD | |
| EMP3 | SNV | Missense_Mutation | novel | c.258C>G | p.Phe86Leu | p.F86L | P54852 | protein_coding | tolerated(1) | benign(0) | TCGA-MY-A5BF-01 | Cervix | cervical & endocervical cancer | Female | >=65 | I/II | Chemotherapy | cisplatin | CR |
| EMP3 | SNV | Missense_Mutation | c.65N>A | p.Ala22Asp | p.A22D | P54852 | protein_coding | deleterious(0) | possibly_damaging(0.825) | TCGA-AY-4070-01 | Colorectum | colon adenocarcinoma | Female | <65 | III/IV | Chemotherapy | 5-fu | PD | |
| EMP3 | SNV | Missense_Mutation | c.476N>C | p.Leu159Pro | p.L159P | P54852 | protein_coding | deleterious(0) | benign(0.044) | TCGA-CM-5861-01 | Colorectum | colon adenocarcinoma | Female | <65 | I/II | Unknown | Unknown | PD | |
| EMP3 | SNV | Missense_Mutation | c.208N>G | p.Met70Val | p.M70V | P54852 | protein_coding | deleterious(0) | benign(0.222) | TCGA-D5-6540-01 | Colorectum | colon adenocarcinoma | Male | >=65 | I/II | Unknown | Unknown | SD | |
| EMP3 | SNV | Missense_Mutation | c.46N>A | p.Leu16Ile | p.L16I | P54852 | protein_coding | tolerated(0.18) | probably_damaging(0.995) | TCGA-AP-A1DV-01 | Endometrium | uterine corpus endometrioid carcinoma | Female | <65 | I/II | Unknown | Unknown | SD | |
| EMP3 | SNV | Missense_Mutation | c.127T>C | p.Cys43Arg | p.C43R | P54852 | protein_coding | deleterious(0) | probably_damaging(0.998) | TCGA-AX-A0J0-01 | Endometrium | uterine corpus endometrioid carcinoma | Female | <65 | I/II | Unknown | Unknown | SD | |
| EMP3 | SNV | Missense_Mutation | novel | c.395N>A | p.Gly132Glu | p.G132E | P54852 | protein_coding | tolerated(1) | possibly_damaging(0.506) | TCGA-AX-A2HD-01 | Endometrium | uterine corpus endometrioid carcinoma | Female | >=65 | III/IV | Unknown | Unknown | SD |
| EMP3 | SNV | Missense_Mutation | novel | c.164N>T | p.Ser55Ile | p.S55I | P54852 | protein_coding | tolerated(0.22) | benign(0.003) | TCGA-EO-A3B0-01 | Endometrium | uterine corpus endometrioid carcinoma | Female | <65 | III/IV | Unknown | Unknown | SD |
| EMP3 | SNV | Missense_Mutation | rs754202309 | c.194N>T | p.Ala65Val | p.A65V | P54852 | protein_coding | deleterious(0.02) | benign(0.282) | TCGA-FI-A2D5-01 | Endometrium | uterine corpus endometrioid carcinoma | Female | <65 | III/IV | Chemotherapy | carboplatinum | PD |
| Page: 1 2 |
Top |
Related drugs of malignant transformation related genes |
| Identification of chemicals and drugs interact with genes involved in malignant transfromation |
| (DGIdb 4.0) |
| Entrez ID | Symbol | Category | Interaction Types | Drug Claim Name | Drug Name | PMIDs |
| Page: 1 |

Copyright 2023-Present -The University of Texas Health Science Center at Houston |