
|
|||||
|
 | |
| |
| |
| |
| |
| |
|
Gene: EMP1 |
Gene summary for EMP1 |
| Gene information | Species | Human | Gene symbol | EMP1 | Gene ID | 2012 |
| Gene name | epithelial membrane protein 1 | |
| Gene Alias | CL-20 | |
| Cytomap | 12p13.1 | |
| Gene Type | protein-coding | GO ID | GO:0008150 | UniProtAcc | A0A024RAT0 |
Top |
Malignant transformation analysis |
| Identification of the aberrant gene expression in precancerous and cancerous lesions by comparing the gene expression of stem-like cells in diseased tissues with normal stem cells |
| Entrez ID | Symbol | Replicates | Species | Organ | Tissue | Adj P-value | Log2FC | Malignancy |
| 2012 | EMP1 | GSM4909281 | Human | Breast | IDC | 1.41e-03 | -3.26e-01 | 0.21 |
| 2012 | EMP1 | GSM4909285 | Human | Breast | IDC | 1.79e-08 | -3.72e-01 | 0.21 |
| 2012 | EMP1 | GSM4909286 | Human | Breast | IDC | 2.73e-12 | -4.63e-01 | 0.1081 |
| 2012 | EMP1 | GSM4909288 | Human | Breast | IDC | 3.71e-05 | -5.43e-01 | 0.0988 |
| 2012 | EMP1 | GSM4909290 | Human | Breast | IDC | 9.03e-03 | -3.40e-01 | 0.2096 |
| 2012 | EMP1 | GSM4909291 | Human | Breast | IDC | 9.49e-10 | -5.04e-01 | 0.1753 |
| 2012 | EMP1 | GSM4909293 | Human | Breast | IDC | 4.84e-14 | -4.40e-01 | 0.1581 |
| 2012 | EMP1 | GSM4909294 | Human | Breast | IDC | 6.43e-16 | -4.75e-01 | 0.2022 |
| 2012 | EMP1 | GSM4909296 | Human | Breast | IDC | 1.10e-11 | -4.13e-01 | 0.1524 |
| 2012 | EMP1 | GSM4909297 | Human | Breast | IDC | 9.23e-18 | -4.53e-01 | 0.1517 |
| 2012 | EMP1 | GSM4909300 | Human | Breast | IDC | 7.26e-04 | 5.05e-01 | 0.0334 |
| 2012 | EMP1 | GSM4909301 | Human | Breast | IDC | 1.83e-29 | -5.57e-01 | 0.1577 |
| 2012 | EMP1 | GSM4909302 | Human | Breast | IDC | 4.38e-07 | -3.94e-01 | 0.1545 |
| 2012 | EMP1 | GSM4909306 | Human | Breast | IDC | 1.78e-06 | -3.80e-01 | 0.1564 |
| 2012 | EMP1 | GSM4909307 | Human | Breast | IDC | 5.02e-07 | -3.88e-01 | 0.1569 |
| 2012 | EMP1 | GSM4909308 | Human | Breast | IDC | 4.94e-14 | -5.01e-01 | 0.158 |
| 2012 | EMP1 | GSM4909311 | Human | Breast | IDC | 8.48e-20 | -4.97e-01 | 0.1534 |
| 2012 | EMP1 | GSM4909312 | Human | Breast | IDC | 5.05e-21 | -4.89e-01 | 0.1552 |
| 2012 | EMP1 | GSM4909315 | Human | Breast | IDC | 2.73e-28 | -5.61e-01 | 0.21 |
| 2012 | EMP1 | GSM4909316 | Human | Breast | IDC | 1.11e-08 | -5.61e-01 | 0.21 |
| Page: 1 2 3 4 5 6 7 8 9 |
| Tissue | Expression Dynamics | Abbreviation |
| Breast | 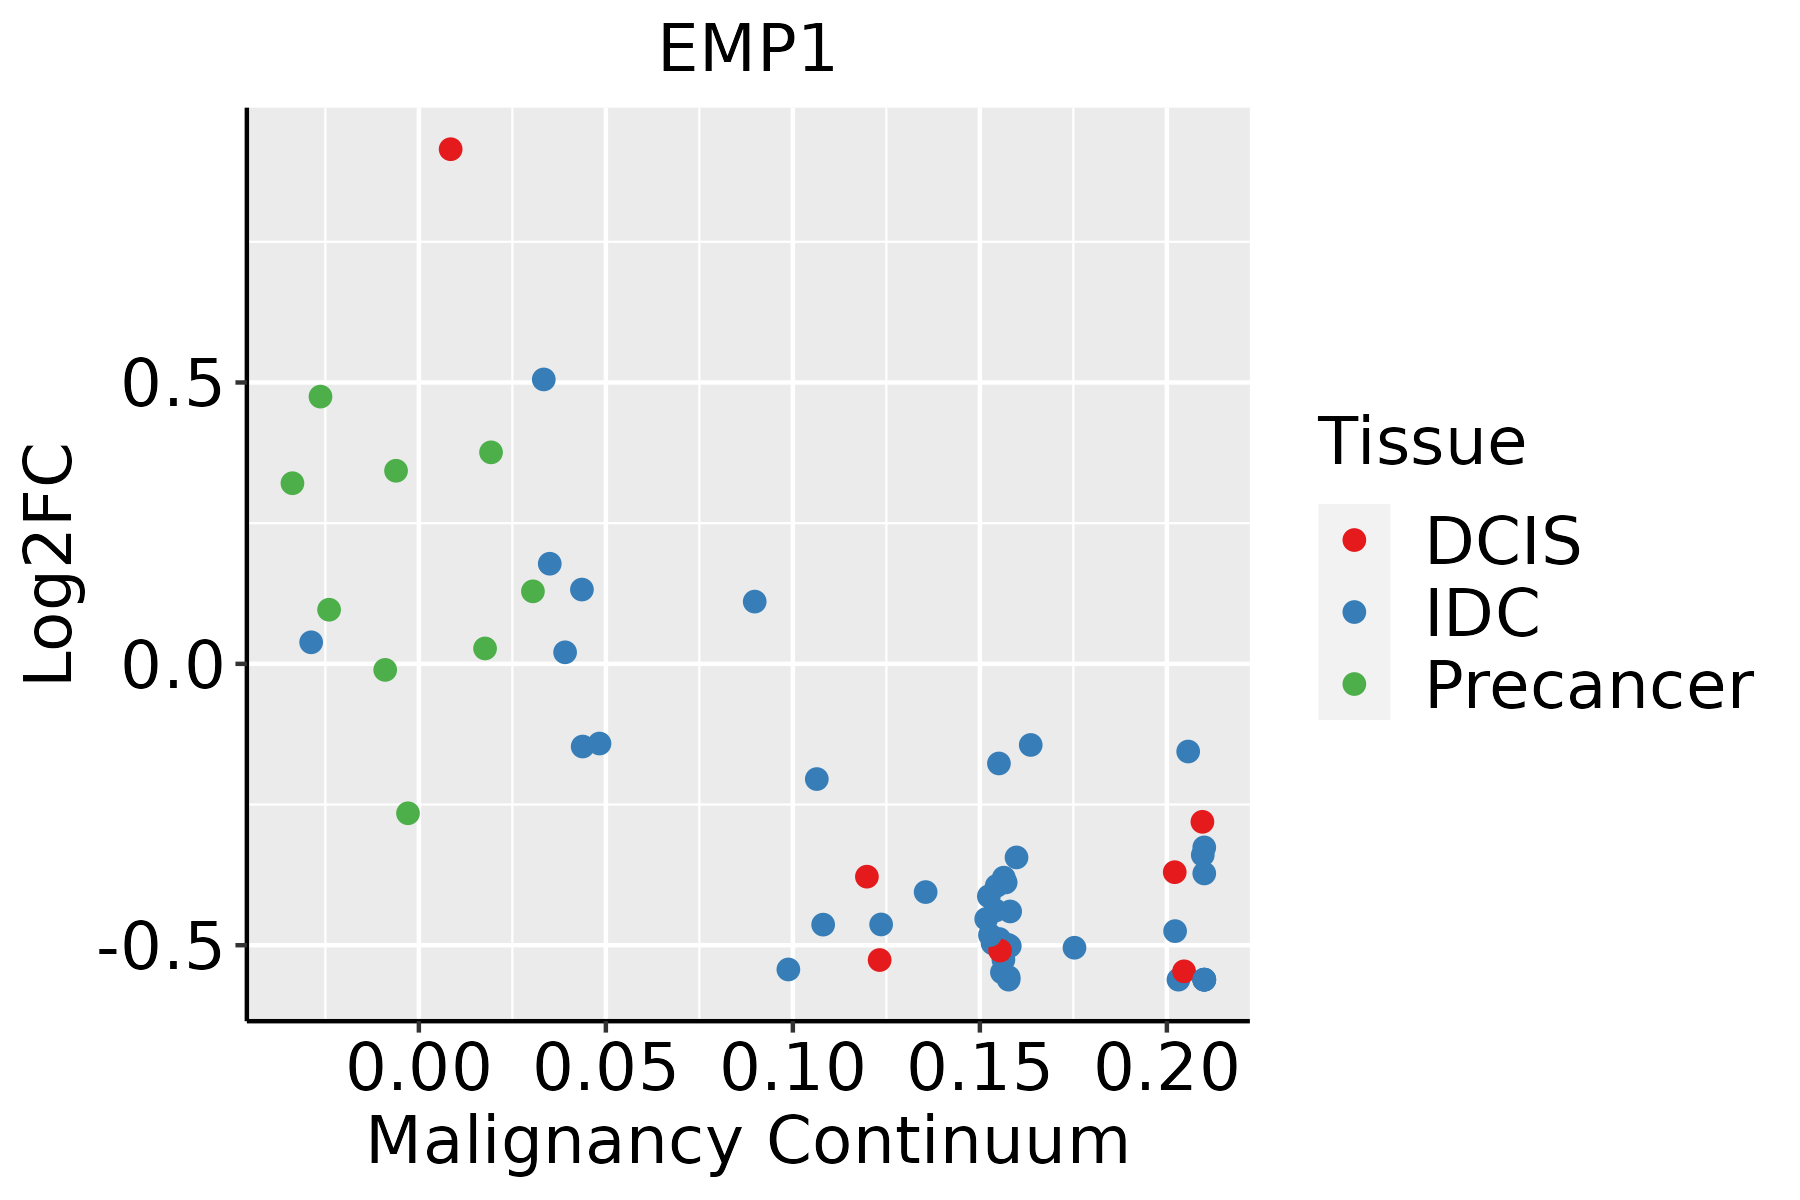 | IDC: Invasive ductal carcinoma |
| DCIS: Ductal carcinoma in situ | ||
| Precancer(BRCA1-mut): Precancerous lesion from BRCA1 mutation carriers | ||
| Cervix |  | CC: Cervix cancer |
| HSIL_HPV: HPV-infected high-grade squamous intraepithelial lesions | ||
| N_HPV: HPV-infected normal cervix | ||
| Endometrium | 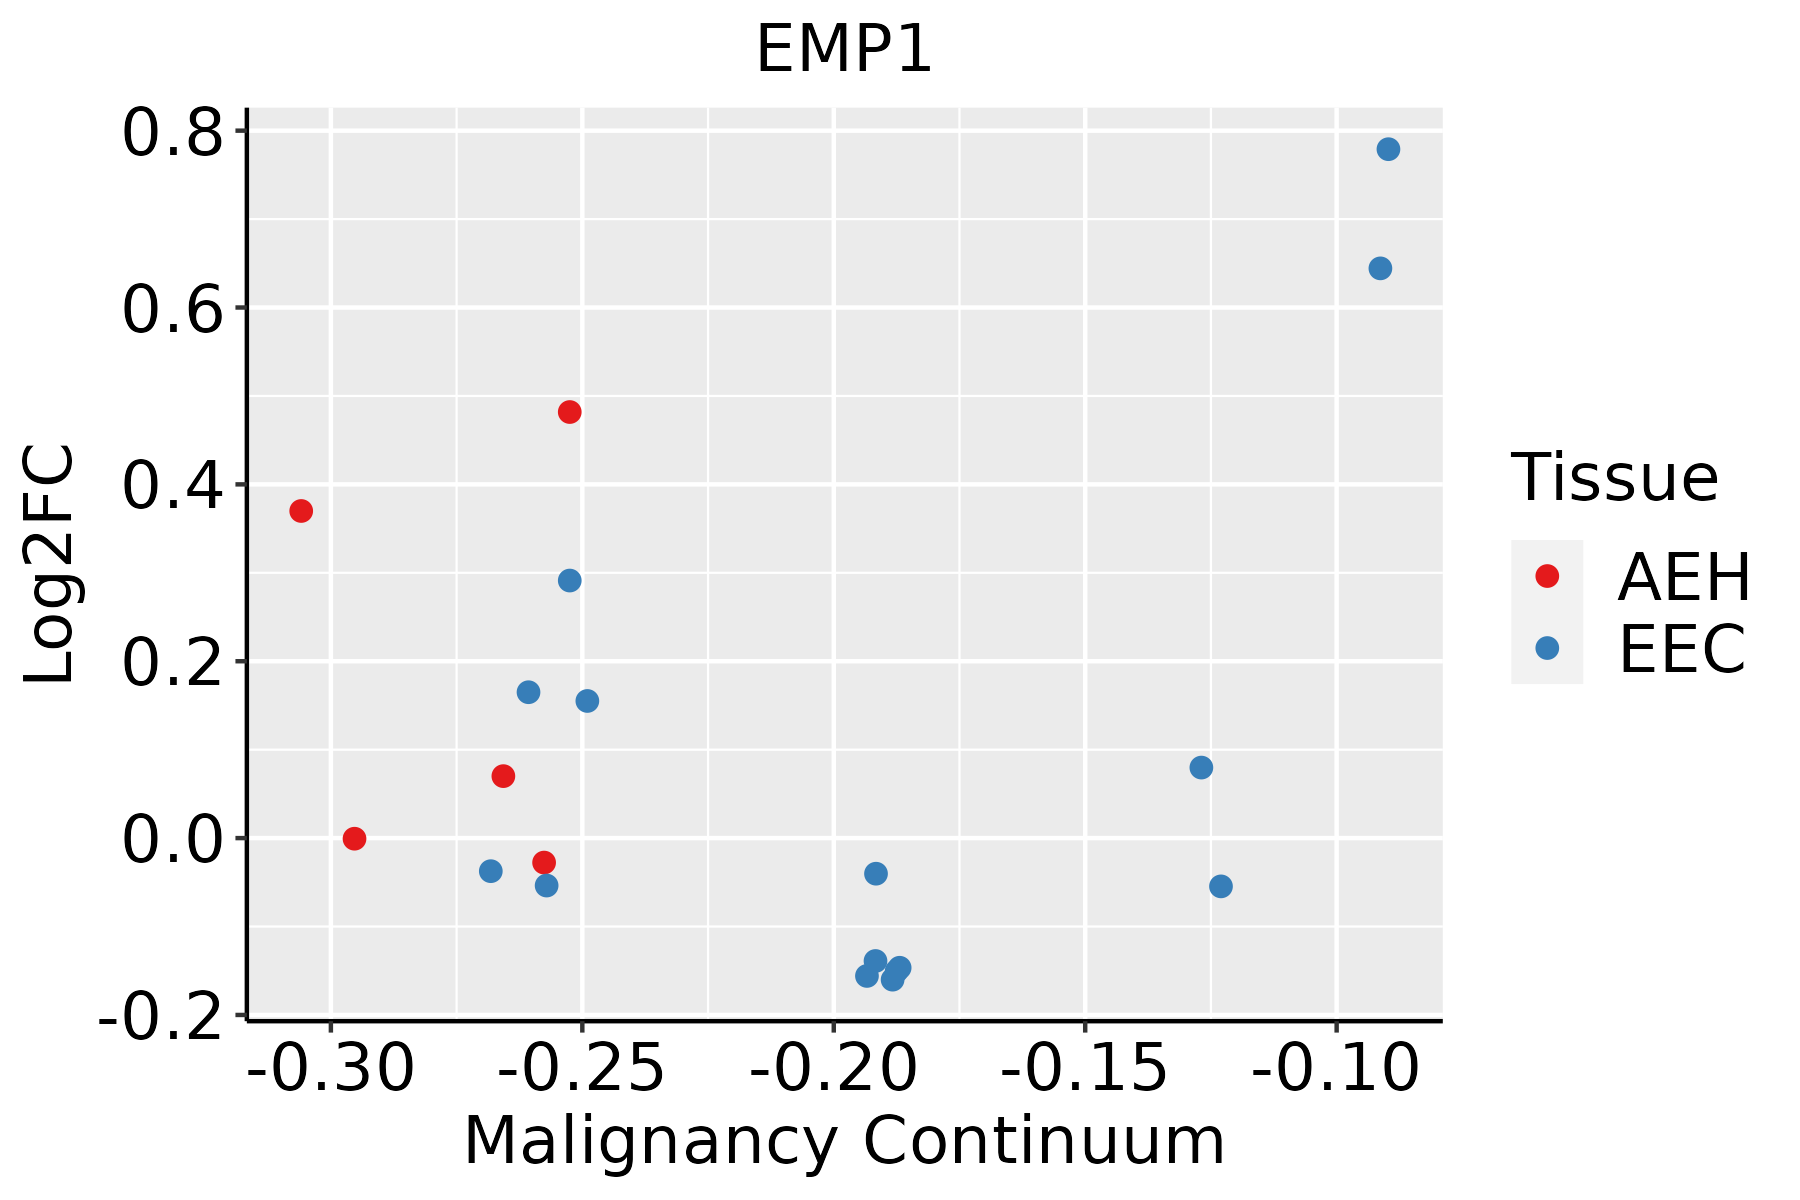 | AEH: Atypical endometrial hyperplasia |
| EEC: Endometrioid Cancer | ||
| Esophagus | 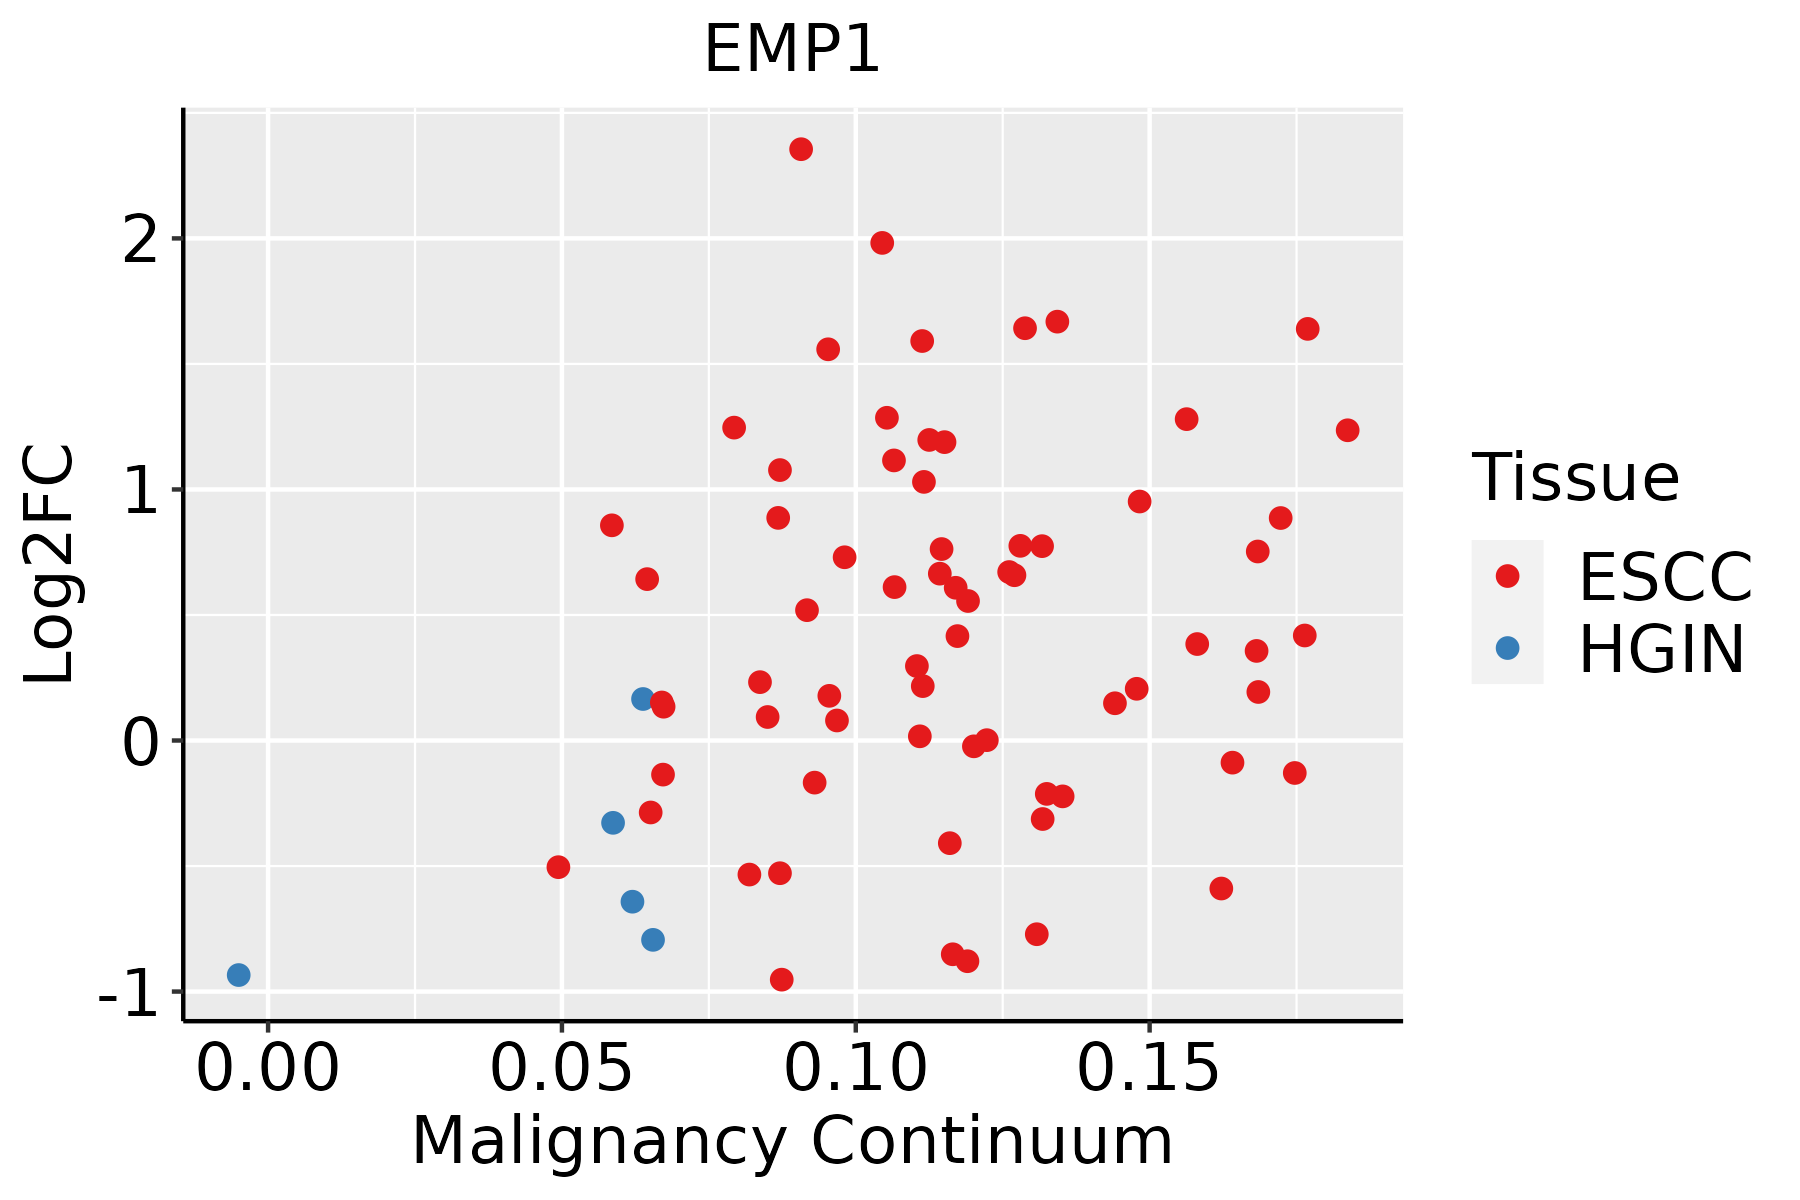 | ESCC: Esophageal squamous cell carcinoma |
| HGIN: High-grade intraepithelial neoplasias | ||
| LGIN: Low-grade intraepithelial neoplasias | ||
| GC | 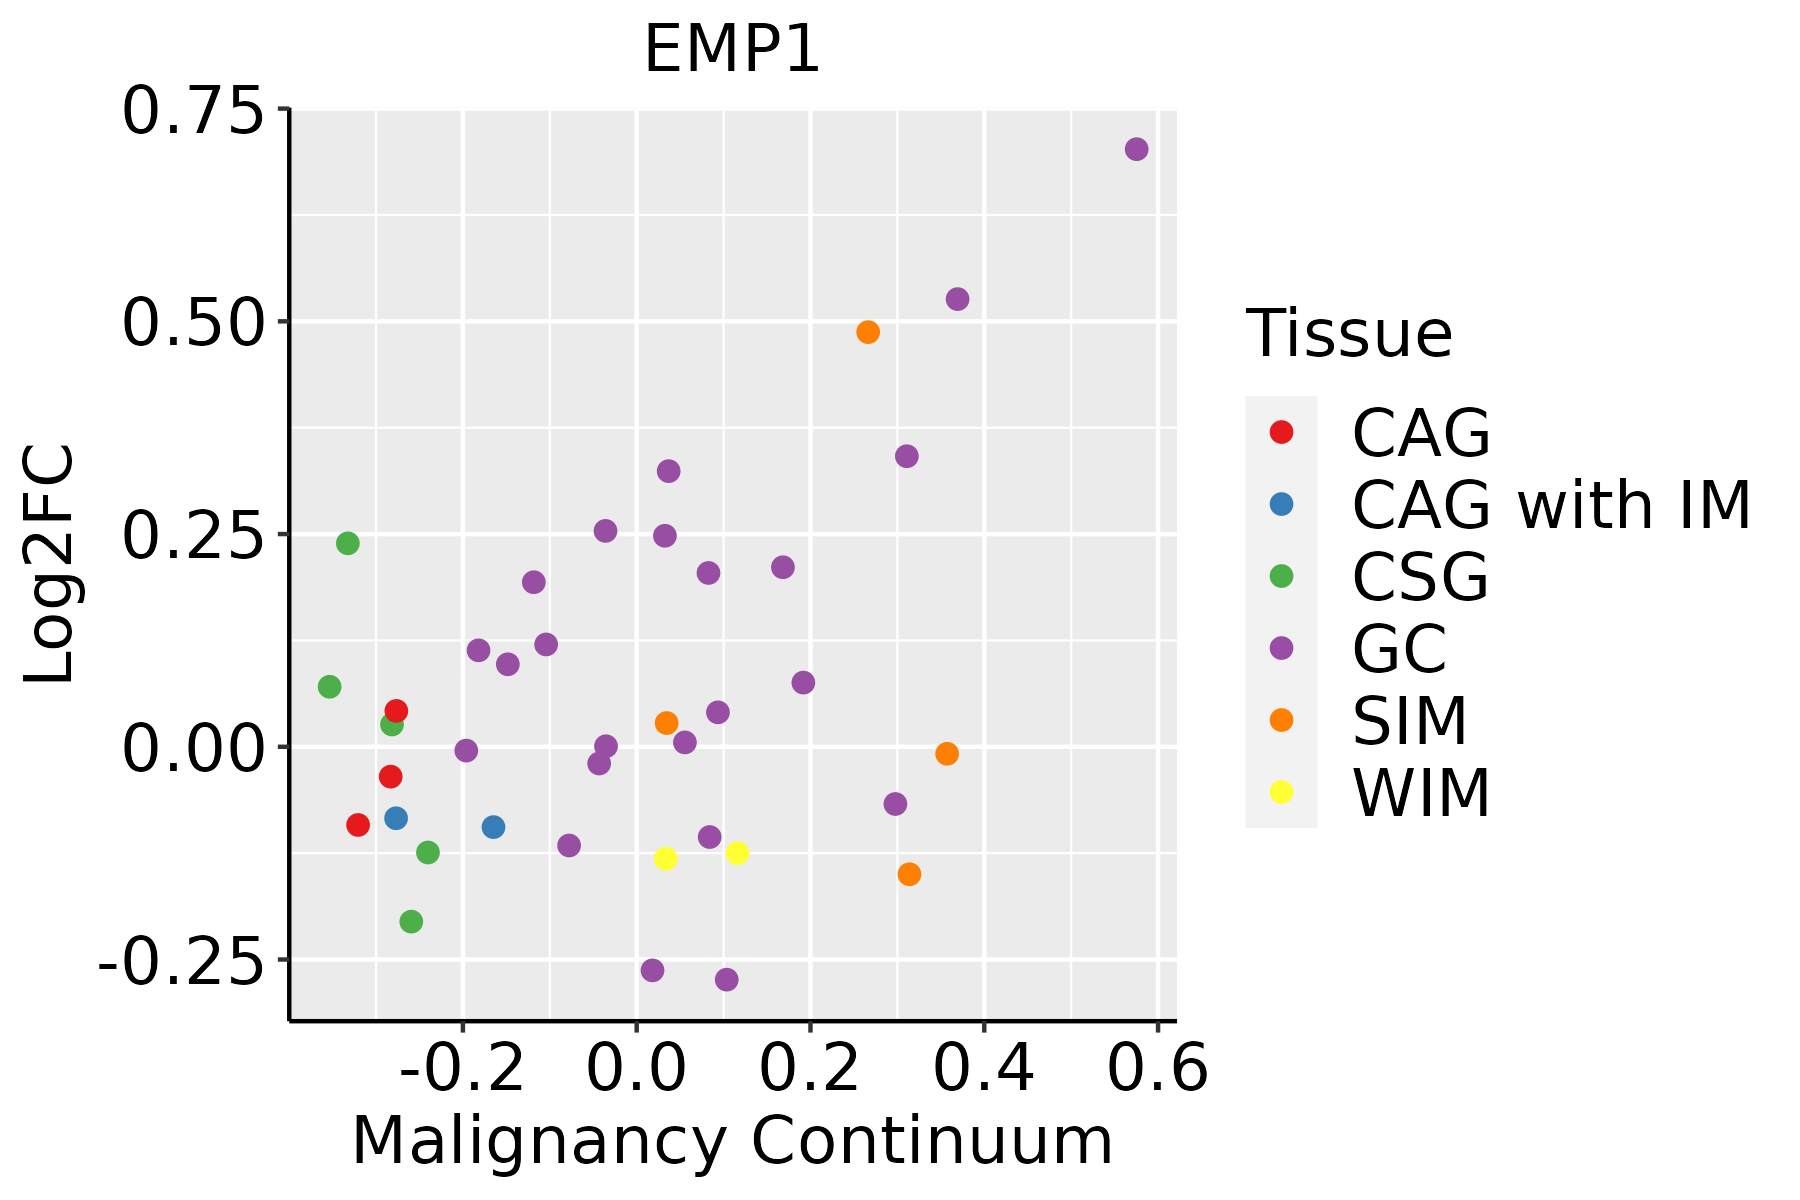 | CAG: Chronic atrophic gastritis |
| CAG with IM: Chronic atrophic gastritis with intestinal metaplasia | ||
| CSG: Chronic superficial gastritis | ||
| GC: Gastric cancer | ||
| SIM: Severe intestinal metaplasia | ||
| WIM: Wild intestinal metaplasia | ||
| Oral Cavity |  | EOLP: Erosive Oral lichen planus |
| LP: leukoplakia | ||
| NEOLP: Non-erosive oral lichen planus | ||
| OSCC: Oral squamous cell carcinoma | ||
| Prostate |  | BPH: Benign Prostatic Hyperplasia |
| Skin | 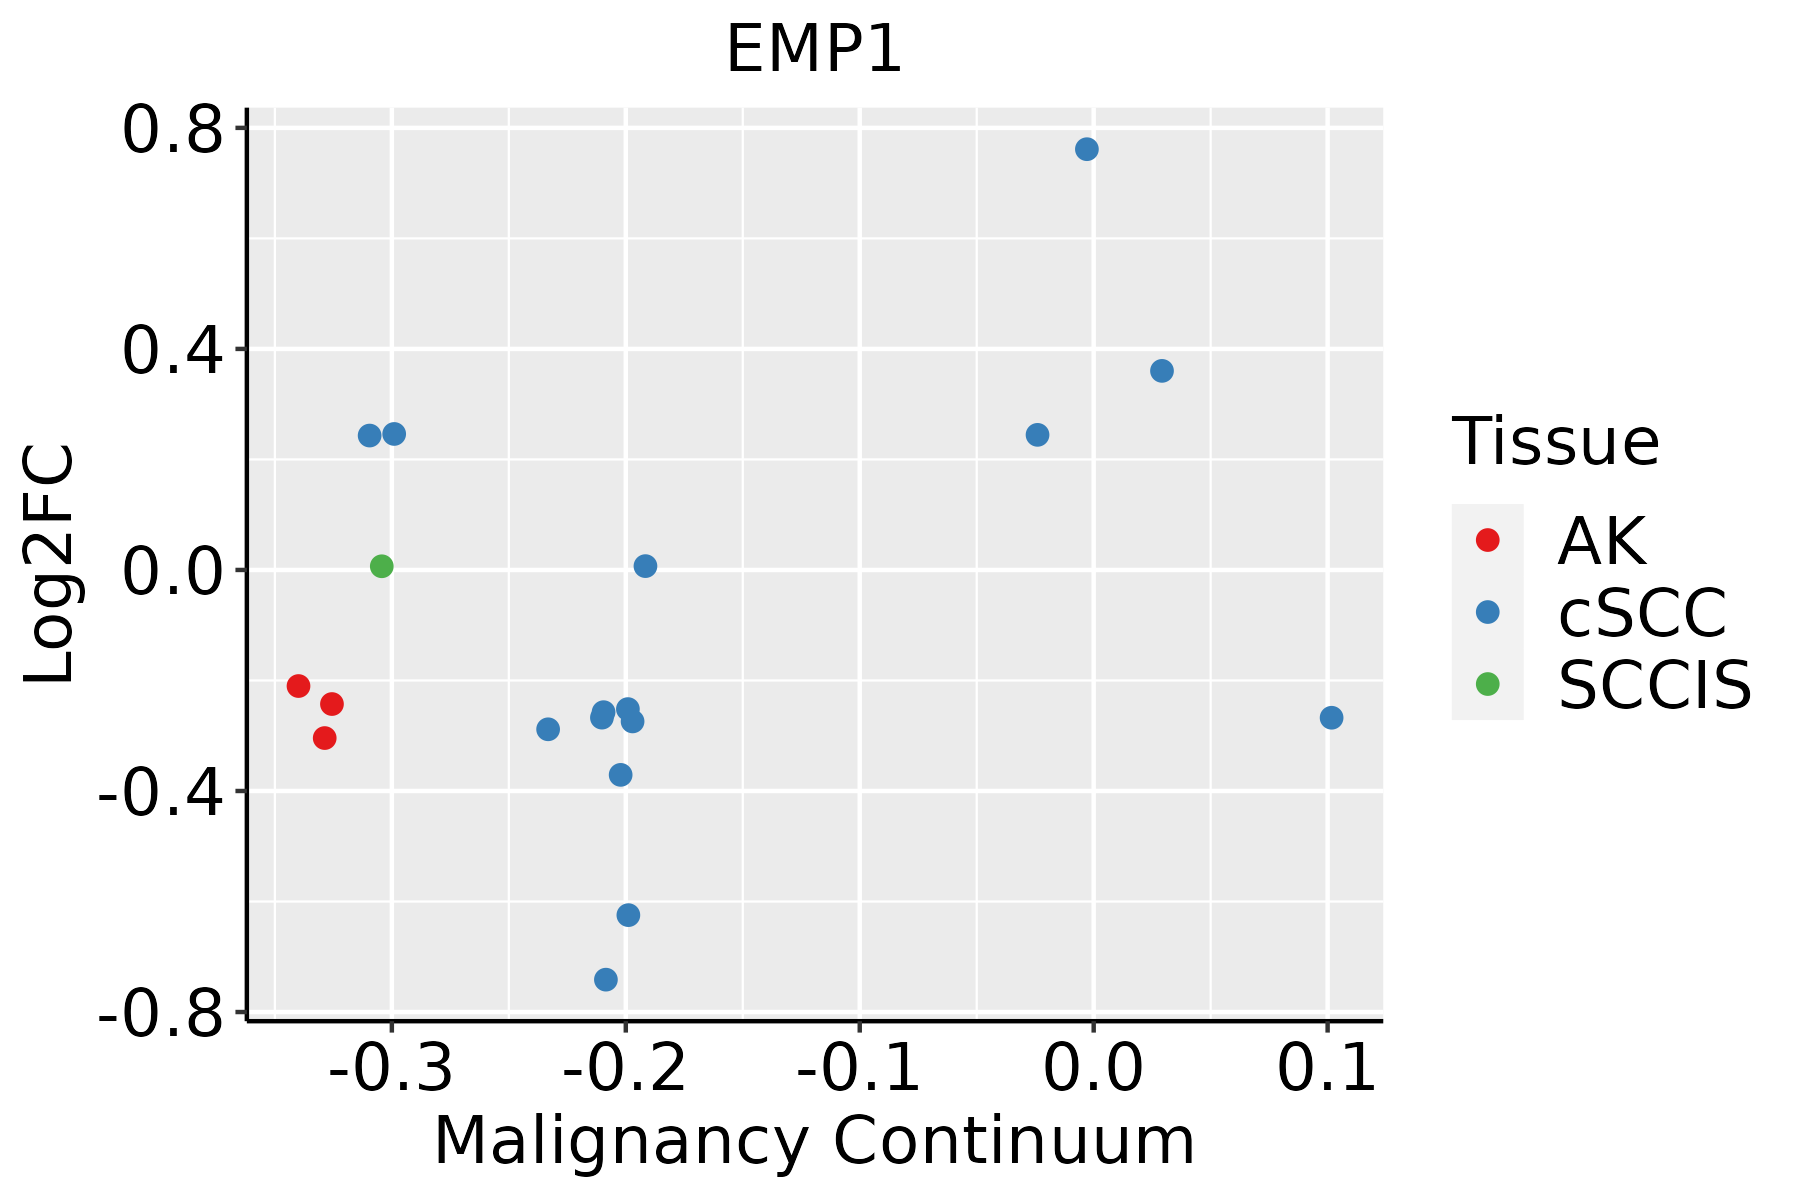 | AK: Actinic keratosis |
| cSCC: Cutaneous squamous cell carcinoma | ||
| SCCIS:squamous cell carcinoma in situ | ||
| Thyroid |  | ATC: Anaplastic thyroid cancer |
| HT: Hashimoto's thyroiditis | ||
| PTC: Papillary thyroid cancer |
| ∗log2FC in expression of this searched gene in stem-like cells from each diseased tissue sample relative to stem-like cells in normal samples in each tissue plotted against the malignancy continuum. Samples are colored based on if they are from different disease stage. |
Top |
Malignant transformation related pathway analysis |
| Find out the enriched GO biological processes and KEGG pathways involved in transition from healthy to precancer to cancer |
| Tissue | Disease Stage | Enriched GO biological Processes |
| Colorectum | AD |  |
| Colorectum | SER |  |
| Colorectum | MSS |  |
| Colorectum | MSI-H |  |
| Colorectum | FAP |  |
| ∗Top 15 enriched GO BP terms are showed in the bar plot of each disease state in each tissue. Each row represents a significant GO biological process which is colored according to the -log10(p.adjust). |
| Page: 1 2 3 4 5 6 7 8 9 |
| GO ID | Tissue | Disease Stage | Description | Gene Ratio | Bg Ratio | pvalue | p.adjust | Count |
| GO:00085445 | Breast | Precancer | epidermis development | 35/1080 | 324/18723 | 2.71e-04 | 3.96e-03 | 35 |
| GO:000854412 | Breast | IDC | epidermis development | 41/1434 | 324/18723 | 1.03e-03 | 1.14e-02 | 41 |
| GO:000854422 | Breast | DCIS | epidermis development | 40/1390 | 324/18723 | 1.05e-03 | 1.16e-02 | 40 |
| GO:00085446 | Cervix | CC | epidermis development | 83/2311 | 324/18723 | 3.91e-11 | 8.54e-09 | 83 |
| GO:000854413 | Cervix | HSIL_HPV | epidermis development | 38/737 | 324/18723 | 1.92e-09 | 3.23e-07 | 38 |
| GO:000854423 | Cervix | N_HPV | epidermis development | 21/534 | 324/18723 | 4.32e-04 | 6.01e-03 | 21 |
| GO:00085447 | Endometrium | AEH | epidermis development | 52/2100 | 324/18723 | 5.00e-03 | 3.14e-02 | 52 |
| GO:000854414 | Endometrium | EEC | epidermis development | 53/2168 | 324/18723 | 5.92e-03 | 3.54e-02 | 53 |
| GO:000854410 | Esophagus | ESCC | epidermis development | 193/8552 | 324/18723 | 2.87e-07 | 4.19e-06 | 193 |
| GO:003812718 | Esophagus | ESCC | ERBB signaling pathway | 82/8552 | 121/18723 | 7.23e-07 | 9.40e-06 | 82 |
| GO:000717318 | Esophagus | ESCC | epidermal growth factor receptor signaling pathway | 73/8552 | 108/18723 | 3.36e-06 | 3.73e-05 | 73 |
| GO:00097919 | Esophagus | ESCC | post-embryonic development | 56/8552 | 80/18723 | 9.08e-06 | 8.71e-05 | 56 |
| GO:00485687 | Esophagus | ESCC | embryonic organ development | 228/8552 | 427/18723 | 7.28e-04 | 3.79e-03 | 228 |
| GO:00182124 | Esophagus | ESCC | peptidyl-tyrosine modification | 202/8552 | 378/18723 | 1.34e-03 | 6.39e-03 | 202 |
| GO:00181084 | Esophagus | ESCC | peptidyl-tyrosine phosphorylation | 200/8552 | 375/18723 | 1.60e-03 | 7.45e-03 | 200 |
| GO:00485694 | Esophagus | ESCC | post-embryonic animal organ development | 12/8552 | 15/18723 | 7.31e-03 | 2.63e-02 | 12 |
| GO:00512161 | Esophagus | ESCC | cartilage development | 103/8552 | 190/18723 | 1.08e-02 | 3.67e-02 | 103 |
| GO:00020623 | Esophagus | ESCC | chondrocyte differentiation | 60/8552 | 106/18723 | 1.53e-02 | 4.94e-02 | 60 |
| GO:003812715 | Oral cavity | OSCC | ERBB signaling pathway | 76/7305 | 121/18723 | 9.59e-08 | 1.66e-06 | 76 |
| GO:00085449 | Oral cavity | OSCC | epidermis development | 171/7305 | 324/18723 | 2.89e-07 | 4.43e-06 | 171 |
| Page: 1 2 3 4 5 |
| Pathway ID | Tissue | Disease Stage | Description | Gene Ratio | Bg Ratio | pvalue | p.adjust | qvalue | Count |
| hsa045109 | Breast | IDC | Focal adhesion | 32/867 | 203/8465 | 8.60e-03 | 4.23e-02 | 3.17e-02 | 32 |
| hsa0451013 | Breast | IDC | Focal adhesion | 32/867 | 203/8465 | 8.60e-03 | 4.23e-02 | 3.17e-02 | 32 |
| hsa0451010 | Cervix | CC | Focal adhesion | 59/1267 | 203/8465 | 1.53e-07 | 1.84e-06 | 1.09e-06 | 59 |
| hsa0451014 | Cervix | CC | Focal adhesion | 59/1267 | 203/8465 | 1.53e-07 | 1.84e-06 | 1.09e-06 | 59 |
| hsa0451023 | Cervix | HSIL_HPV | Focal adhesion | 21/459 | 203/8465 | 3.24e-03 | 2.02e-02 | 1.63e-02 | 21 |
| hsa0451033 | Cervix | HSIL_HPV | Focal adhesion | 21/459 | 203/8465 | 3.24e-03 | 2.02e-02 | 1.63e-02 | 21 |
| hsa0451015 | Endometrium | AEH | Focal adhesion | 58/1197 | 203/8465 | 4.99e-08 | 7.37e-07 | 5.39e-07 | 58 |
| hsa0451016 | Endometrium | AEH | Focal adhesion | 58/1197 | 203/8465 | 4.99e-08 | 7.37e-07 | 5.39e-07 | 58 |
| hsa0451024 | Endometrium | EEC | Focal adhesion | 58/1237 | 203/8465 | 1.61e-07 | 2.30e-06 | 1.71e-06 | 58 |
| hsa0451034 | Endometrium | EEC | Focal adhesion | 58/1237 | 203/8465 | 1.61e-07 | 2.30e-06 | 1.71e-06 | 58 |
| hsa0451020 | Esophagus | ESCC | Focal adhesion | 127/4205 | 203/8465 | 1.25e-04 | 4.99e-04 | 2.56e-04 | 127 |
| hsa04510111 | Esophagus | ESCC | Focal adhesion | 127/4205 | 203/8465 | 1.25e-04 | 4.99e-04 | 2.56e-04 | 127 |
| hsa0451019 | Oral cavity | OSCC | Focal adhesion | 128/3704 | 203/8465 | 1.71e-08 | 1.63e-07 | 8.31e-08 | 128 |
| hsa04510110 | Oral cavity | OSCC | Focal adhesion | 128/3704 | 203/8465 | 1.71e-08 | 1.63e-07 | 8.31e-08 | 128 |
| hsa0451026 | Oral cavity | EOLP | Focal adhesion | 60/1218 | 203/8465 | 1.42e-08 | 1.83e-07 | 1.08e-07 | 60 |
| hsa0451036 | Oral cavity | EOLP | Focal adhesion | 60/1218 | 203/8465 | 1.42e-08 | 1.83e-07 | 1.08e-07 | 60 |
| hsa0451017 | Prostate | BPH | Focal adhesion | 85/1718 | 203/8465 | 1.17e-12 | 2.28e-11 | 1.41e-11 | 85 |
| hsa0451018 | Prostate | BPH | Focal adhesion | 85/1718 | 203/8465 | 1.17e-12 | 2.28e-11 | 1.41e-11 | 85 |
| hsa0451025 | Prostate | Tumor | Focal adhesion | 84/1791 | 203/8465 | 3.44e-11 | 6.69e-10 | 4.15e-10 | 84 |
| hsa0451035 | Prostate | Tumor | Focal adhesion | 84/1791 | 203/8465 | 3.44e-11 | 6.69e-10 | 4.15e-10 | 84 |
| Page: 1 |
Top |
Cell-cell communication analysis |
| Identification of potential cell-cell interactions between two cell types and their ligand-receptor pairs for different disease states |
| Ligand | Receptor | LRpair | Pathway | Tissue | Disease Stage |
| Page: 1 |
Top |
Single-cell gene regulatory network inference analysis |
| Find out the significant the regulons (TFs) and the target genes of each regulon across cell types for different disease states |
| TF | Cell Type | Tissue | Disease Stage | Target Gene | RSS | Regulon Activity |
| ∗The dot plots of a searched regulon are shown for all cell subpopulations in each disease state of each tissue based on the regulon specific score inferred using pySCENIC and by calculating the average expression. |
| Page: 1 |
Top |
Somatic mutation of malignant transformation related genes |
| Annotation of somatic variants for genes involved in malignant transformation |
| Hugo Symbol | Variant Class | Variant Classification | dbSNP RS | HGVSc | HGVSp | HGVSp Short | SWISSPROT | BIOTYPE | SIFT | PolyPhen | Tumor Sample Barcode | Tissue | Histology | Sex | Age | Stage | Therapy Types | Drugs | Outcome |
| EMP1 | SNV | Missense_Mutation | c.133N>G | p.Thr45Ala | p.T45A | P54849 | protein_coding | tolerated(0.1) | benign(0.012) | TCGA-E2-A1L7-01 | Breast | breast invasive carcinoma | Female | <65 | III/IV | Chemotherapy | cyclophosphamide | PD | |
| EMP1 | SNV | Missense_Mutation | rs148486500 | c.98N>T | p.Thr33Met | p.T33M | P54849 | protein_coding | tolerated(0.18) | benign(0.197) | TCGA-OL-A6VO-01 | Breast | breast invasive carcinoma | Female | <65 | I/II | Chemotherapy | taxotere | CR |
| EMP1 | SNV | Missense_Mutation | novel | c.347N>G | p.Tyr116Cys | p.Y116C | P54849 | protein_coding | deleterious(0) | probably_damaging(1) | TCGA-CA-6717-01 | Colorectum | colon adenocarcinoma | Male | <65 | I/II | Chemotherapy | oxaliplatin | CR |
| EMP1 | SNV | Missense_Mutation | c.464N>T | p.Arg155Ile | p.R155I | P54849 | protein_coding | deleterious(0) | probably_damaging(0.998) | TCGA-B5-A11E-01 | Endometrium | uterine corpus endometrioid carcinoma | Female | <65 | I/II | Unknown | Unknown | SD | |
| EMP1 | SNV | Missense_Mutation | novel | c.107N>T | p.Ala36Val | p.A36V | P54849 | protein_coding | tolerated(0.39) | benign(0.005) | TCGA-B5-A3FA-01 | Endometrium | uterine corpus endometrioid carcinoma | Female | >=65 | I/II | Unknown | Unknown | SD |
| EMP1 | SNV | Missense_Mutation | c.468N>T | p.Lys156Asn | p.K156N | P54849 | protein_coding | deleterious(0) | probably_damaging(0.997) | TCGA-D1-A16X-01 | Endometrium | uterine corpus endometrioid carcinoma | Female | <65 | I/II | Unknown | Unknown | SD | |
| EMP1 | SNV | Missense_Mutation | rs201405991 | c.247N>A | p.Val83Met | p.V83M | P54849 | protein_coding | tolerated(0.06) | benign(0.176) | TCGA-DF-A2KU-01 | Endometrium | uterine corpus endometrioid carcinoma | Female | Unknown | I/II | Unknown | Unknown | SD |
| EMP1 | SNV | Missense_Mutation | novel | c.381G>T | p.Gln127His | p.Q127H | P54849 | protein_coding | tolerated(0.12) | benign(0.03) | TCGA-EO-A22R-01 | Endometrium | uterine corpus endometrioid carcinoma | Female | <65 | I/II | Unknown | Unknown | SD |
| EMP1 | SNV | Missense_Mutation | novel | c.92N>A | p.Ser31Tyr | p.S31Y | P54849 | protein_coding | tolerated(0.09) | possibly_damaging(0.837) | TCGA-DD-AAW0-01 | Liver | liver hepatocellular carcinoma | Male | <65 | I/II | Unknown | Unknown | SD |
| EMP1 | SNV | Missense_Mutation | rs774431121 | c.445G>A | p.Val149Ile | p.V149I | P54849 | protein_coding | tolerated(1) | benign(0.005) | TCGA-F7-A624-01 | Oral cavity | head & neck squamous cell carcinoma | Male | >=65 | I/II | Unknown | Unknown | SD |
| Page: 1 2 |
Top |
Related drugs of malignant transformation related genes |
| Identification of chemicals and drugs interact with genes involved in malignant transfromation |
| (DGIdb 4.0) |
| Entrez ID | Symbol | Category | Interaction Types | Drug Claim Name | Drug Name | PMIDs |
| 2012 | EMP1 | NA | GEFITINIB | GEFITINIB | 16087880 |
| Page: 1 |

Copyright 2023-Present -The University of Texas Health Science Center at Houston |