| Tissue | Expression Dynamics | Abbreviation |
| Colorectum (GSE201348) |  | FAP: Familial adenomatous polyposis |
| CRC: Colorectal cancer |
| Colorectum (HTA11) | 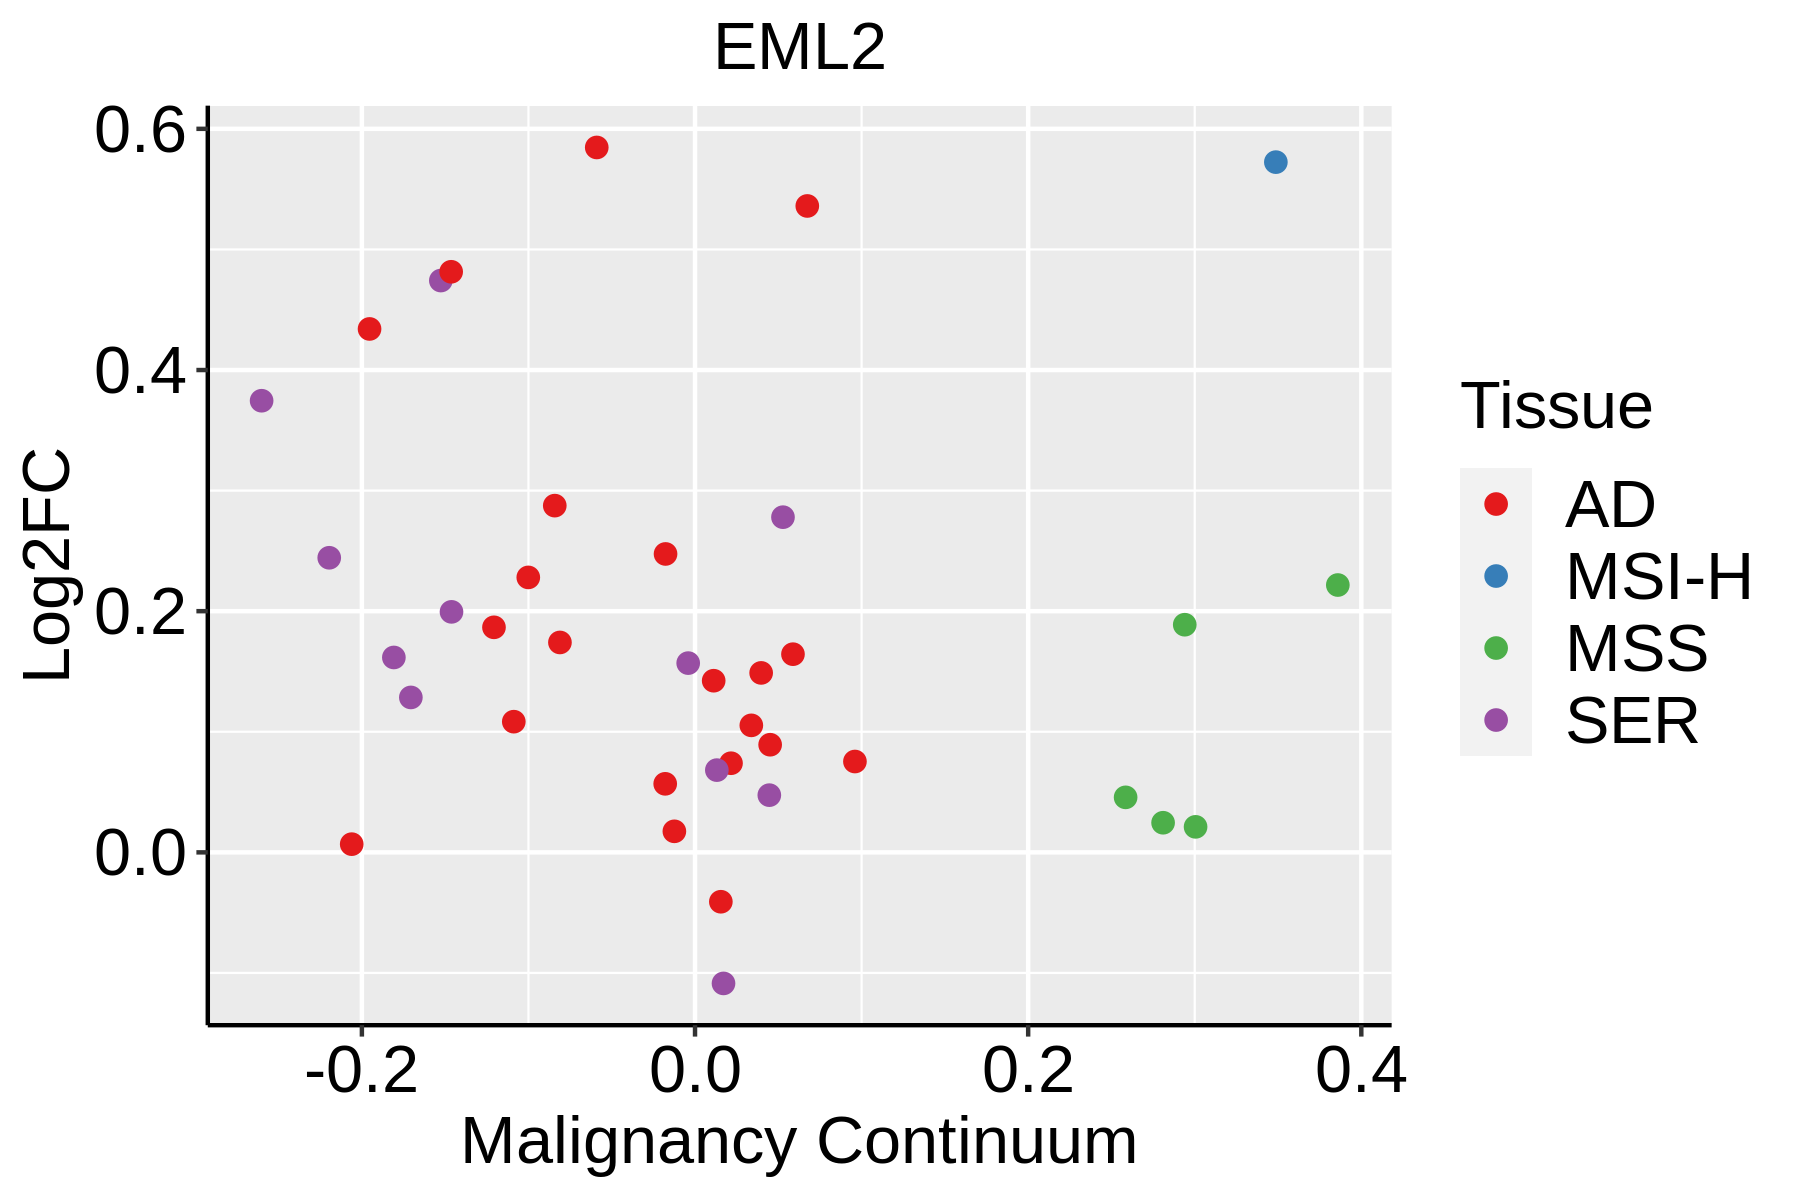 | AD: Adenomas |
| SER: Sessile serrated lesions |
| MSI-H: Microsatellite-high colorectal cancer |
| MSS: Microsatellite stable colorectal cancer |
| Esophagus | 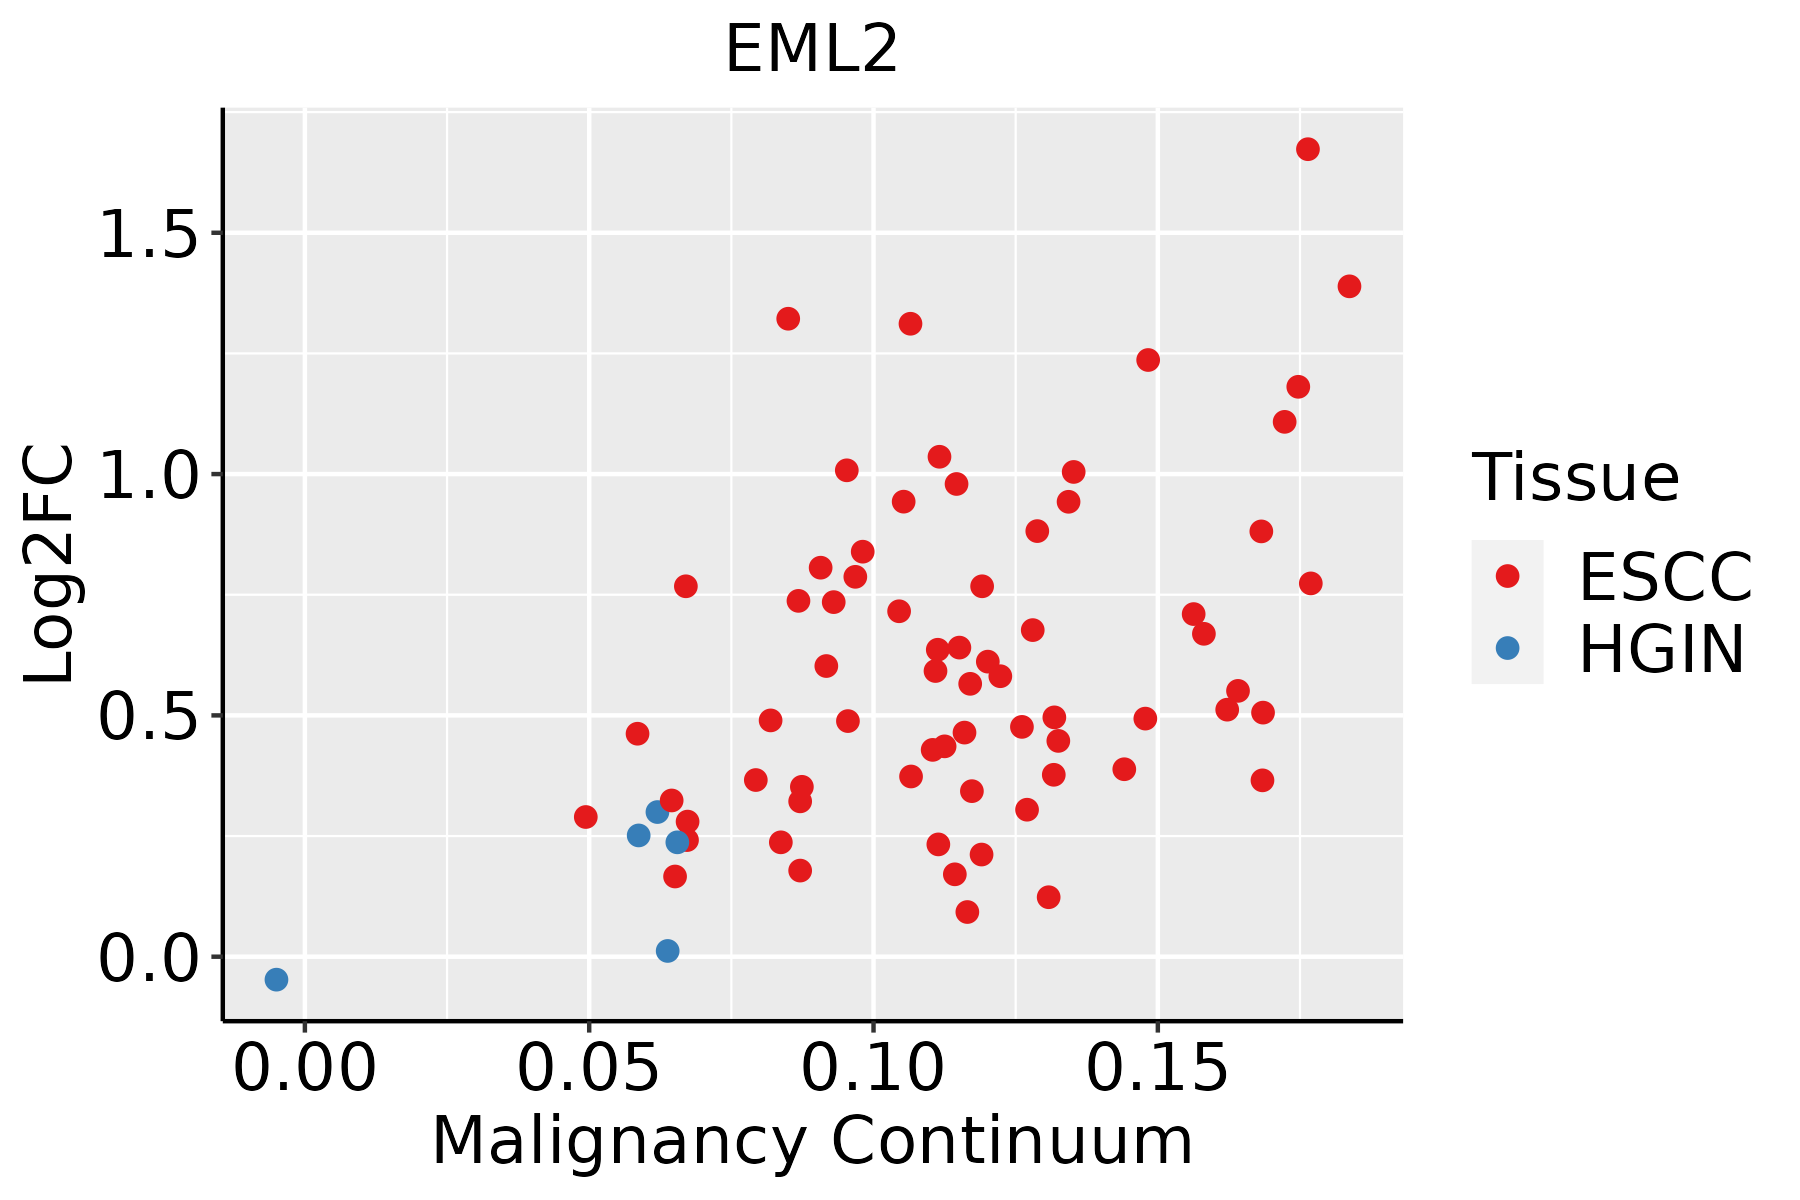 | ESCC: Esophageal squamous cell carcinoma |
| HGIN: High-grade intraepithelial neoplasias |
| LGIN: Low-grade intraepithelial neoplasias |
| Liver |  | HCC: Hepatocellular carcinoma |
| NAFLD: Non-alcoholic fatty liver disease |
| Oral Cavity |  | EOLP: Erosive Oral lichen planus |
| LP: leukoplakia |
| NEOLP: Non-erosive oral lichen planus |
| OSCC: Oral squamous cell carcinoma |
| Skin | 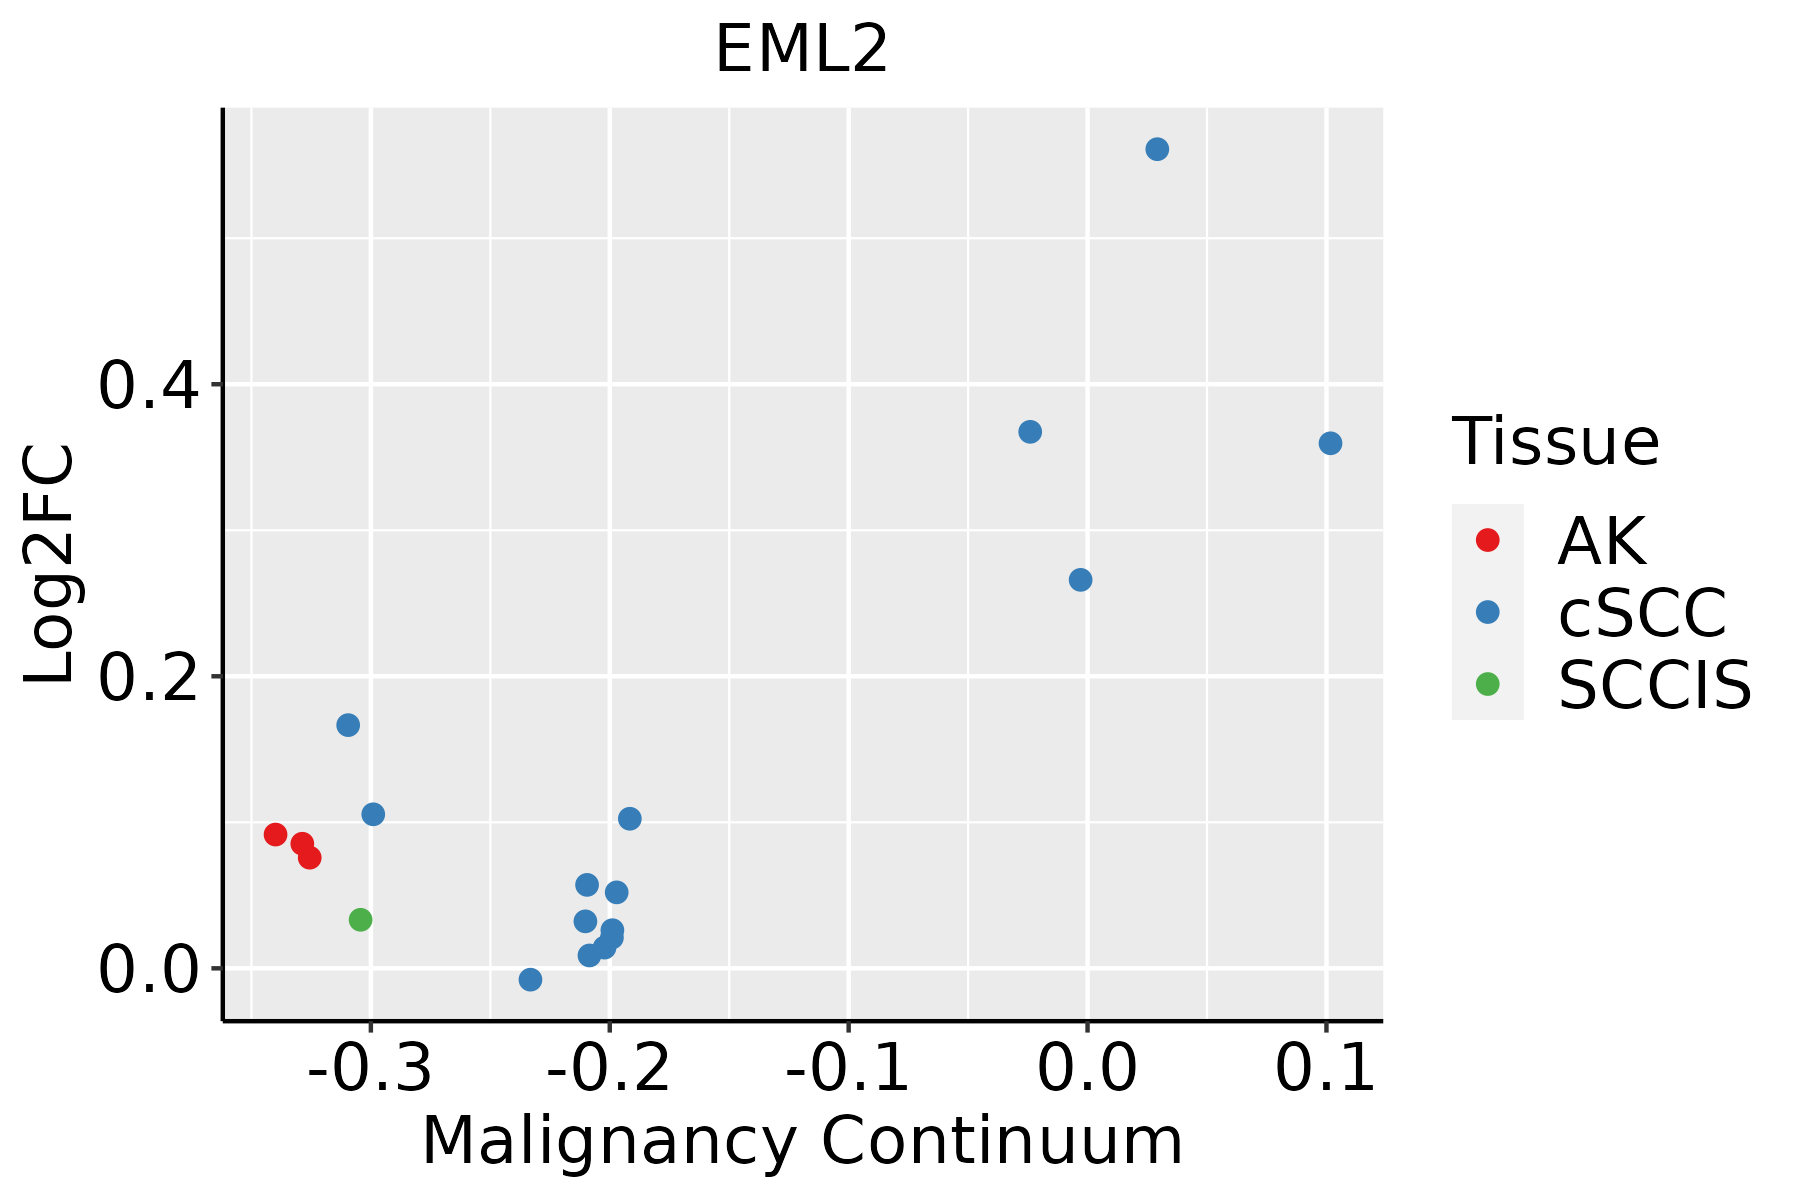 | AK: Actinic keratosis |
| cSCC: Cutaneous squamous cell carcinoma |
| SCCIS:squamous cell carcinoma in situ |
| Thyroid | 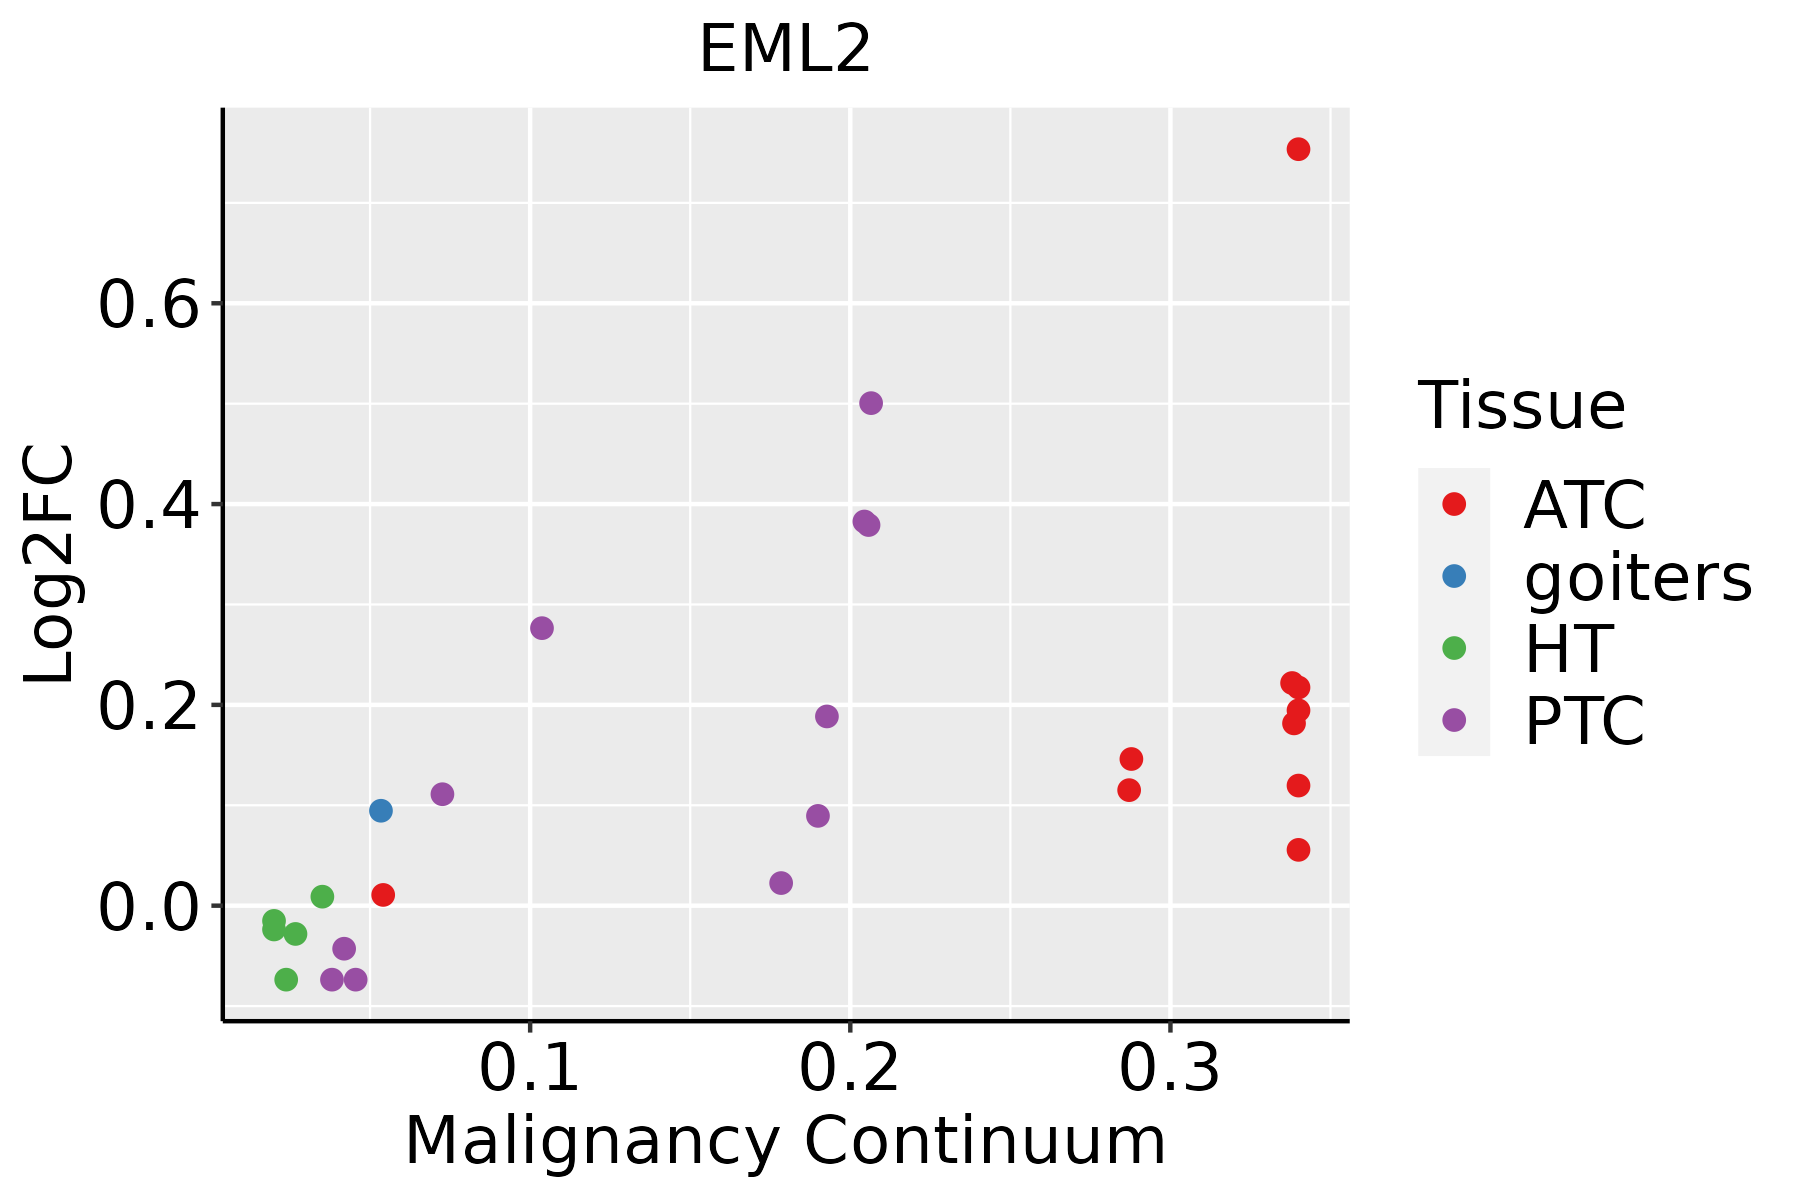 | ATC: Anaplastic thyroid cancer |
| HT: Hashimoto's thyroiditis |
| PTC: Papillary thyroid cancer |
| GO ID | Tissue | Disease Stage | Description | Gene Ratio | Bg Ratio | pvalue | p.adjust | Count |
| GO:1902903 | Colorectum | AD | regulation of supramolecular fiber organization | 139/3918 | 383/18723 | 2.01e-12 | 3.19e-10 | 139 |
| GO:0032271 | Colorectum | AD | regulation of protein polymerization | 94/3918 | 233/18723 | 1.01e-11 | 1.29e-09 | 94 |
| GO:0051258 | Colorectum | AD | protein polymerization | 112/3918 | 297/18723 | 1.85e-11 | 2.27e-09 | 112 |
| GO:0043254 | Colorectum | AD | regulation of protein-containing complex assembly | 148/3918 | 428/18723 | 2.64e-11 | 3.18e-09 | 148 |
| GO:0010639 | Colorectum | AD | negative regulation of organelle organization | 114/3918 | 348/18723 | 1.41e-07 | 6.49e-06 | 114 |
| GO:0032272 | Colorectum | AD | negative regulation of protein polymerization | 36/3918 | 80/18723 | 1.13e-06 | 3.72e-05 | 36 |
| GO:1902904 | Colorectum | AD | negative regulation of supramolecular fiber organization | 60/3918 | 167/18723 | 5.23e-06 | 1.35e-04 | 60 |
| GO:0031333 | Colorectum | AD | negative regulation of protein-containing complex assembly | 52/3918 | 141/18723 | 9.27e-06 | 2.18e-04 | 52 |
| GO:0051494 | Colorectum | AD | negative regulation of cytoskeleton organization | 58/3918 | 163/18723 | 1.04e-05 | 2.40e-04 | 58 |
| GO:0070507 | Colorectum | AD | regulation of microtubule cytoskeleton organization | 44/3918 | 148/18723 | 7.05e-03 | 4.31e-02 | 44 |
| GO:19029031 | Colorectum | SER | regulation of supramolecular fiber organization | 114/2897 | 383/18723 | 7.32e-13 | 1.95e-10 | 114 |
| GO:00322711 | Colorectum | SER | regulation of protein polymerization | 78/2897 | 233/18723 | 5.71e-12 | 1.17e-09 | 78 |
| GO:00512581 | Colorectum | SER | protein polymerization | 91/2897 | 297/18723 | 2.72e-11 | 5.06e-09 | 91 |
| GO:00432541 | Colorectum | SER | regulation of protein-containing complex assembly | 119/2897 | 428/18723 | 3.34e-11 | 5.86e-09 | 119 |
| GO:00106391 | Colorectum | SER | negative regulation of organelle organization | 90/2897 | 348/18723 | 3.14e-07 | 1.69e-05 | 90 |
| GO:00322721 | Colorectum | SER | negative regulation of protein polymerization | 31/2897 | 80/18723 | 3.67e-07 | 1.96e-05 | 31 |
| GO:19029041 | Colorectum | SER | negative regulation of supramolecular fiber organization | 50/2897 | 167/18723 | 1.63e-06 | 7.23e-05 | 50 |
| GO:00514941 | Colorectum | SER | negative regulation of cytoskeleton organization | 48/2897 | 163/18723 | 4.34e-06 | 1.63e-04 | 48 |
| GO:00313331 | Colorectum | SER | negative regulation of protein-containing complex assembly | 43/2897 | 141/18723 | 5.03e-06 | 1.86e-04 | 43 |
| GO:00432544 | Colorectum | FAP | regulation of protein-containing complex assembly | 101/2622 | 428/18723 | 5.18e-08 | 4.07e-06 | 101 |
| Hugo Symbol | Variant Class | Variant Classification | dbSNP RS | HGVSc | HGVSp | HGVSp Short | SWISSPROT | BIOTYPE | SIFT | PolyPhen | Tumor Sample Barcode | Tissue | Histology | Sex | Age | Stage | Therapy Types | Drugs | Outcome |
| EML2 | SNV | Missense_Mutation | | c.1546N>A | p.Asp516Asn | p.D516N | O95834 | protein_coding | deleterious(0.01) | probably_damaging(0.995) | TCGA-AC-A23H-01 | Breast | breast invasive carcinoma | Female | >=65 | I/II | Unknown | Unknown | PD |
| EML2 | SNV | Missense_Mutation | rs774032487 | c.808N>T | p.Arg270Trp | p.R270W | O95834 | protein_coding | deleterious(0) | probably_damaging(0.95) | TCGA-AC-A3W6-01 | Breast | breast invasive carcinoma | Female | >=65 | III/IV | Unknown | Unknown | SD |
| EML2 | SNV | Missense_Mutation | novel | c.940A>T | p.Ile314Phe | p.I314F | O95834 | protein_coding | deleterious(0) | benign(0.033) | TCGA-BH-A0BJ-01 | Breast | breast invasive carcinoma | Female | <65 | I/II | Chemotherapy | doxorubicin | SD |
| EML2 | SNV | Missense_Mutation | | c.2326N>C | p.Asp776His | p.D776H | O95834 | protein_coding | deleterious(0) | probably_damaging(0.999) | TCGA-BH-A0HP-01 | Breast | breast invasive carcinoma | Female | >=65 | III/IV | Chemotherapy | doxorubicin | SD |
| EML2 | SNV | Missense_Mutation | | c.1421N>T | p.Gly474Val | p.G474V | O95834 | protein_coding | deleterious(0) | probably_damaging(0.944) | TCGA-E2-A159-01 | Breast | breast invasive carcinoma | Female | <65 | I/II | Chemotherapy | cyclophosphamide | SD |
| EML2 | insertion | Nonsense_Mutation | novel | c.1889_1890insGCACGAATGAAGCAAACACATATTCCC | p.Ser630delinsArgHisGluTerSerLysHisIlePhePro | p.S630delinsRHE*SKHIFP | O95834 | protein_coding | | | TCGA-AN-A04D-01 | Breast | breast invasive carcinoma | Female | <65 | I/II | Unknown | Unknown | SD |
| EML2 | SNV | Missense_Mutation | | c.2380N>T | p.Asp794Tyr | p.D794Y | O95834 | protein_coding | deleterious(0) | probably_damaging(0.999) | TCGA-DS-A0VK-01 | Cervix | cervical & endocervical cancer | Female | <65 | I/II | Chemotherapy | carboplatin | PD |
| EML2 | SNV | Missense_Mutation | | c.1021N>T | p.Arg341Cys | p.R341C | O95834 | protein_coding | deleterious(0) | probably_damaging(0.997) | TCGA-AA-3715-01 | Colorectum | colon adenocarcinoma | Male | >=65 | I/II | Unknown | Unknown | PD |
| EML2 | SNV | Missense_Mutation | | c.1022N>A | p.Arg341His | p.R341H | O95834 | protein_coding | tolerated(0.17) | probably_damaging(0.996) | TCGA-AA-3986-01 | Colorectum | colon adenocarcinoma | Male | >=65 | I/II | Unknown | Unknown | SD |
| EML2 | SNV | Missense_Mutation | | c.856G>A | p.Ala286Thr | p.A286T | O95834 | protein_coding | deleterious(0) | probably_damaging(0.995) | TCGA-AD-6895-01 | Colorectum | colon adenocarcinoma | Male | >=65 | III/IV | Unknown | Unknown | SD |


