
|
|||||
|
 | |
| |
| |
| |
| |
| |
|
Gene: EMG1 |
Gene summary for EMG1 |
| Gene information | Species | Human | Gene symbol | EMG1 | Gene ID | 10436 |
| Gene name | EMG1 N1-specific pseudouridine methyltransferase | |
| Gene Alias | C2F | |
| Cytomap | 12p13.31 | |
| Gene Type | protein-coding | GO ID | GO:0000154 | UniProtAcc | Q92979 |
Top |
Malignant transformation analysis |
| Identification of the aberrant gene expression in precancerous and cancerous lesions by comparing the gene expression of stem-like cells in diseased tissues with normal stem cells |
| Entrez ID | Symbol | Replicates | Species | Organ | Tissue | Adj P-value | Log2FC | Malignancy |
| 10436 | EMG1 | HTA11_3410_2000001011 | Human | Colorectum | AD | 4.20e-02 | 9.73e-02 | 0.0155 |
| 10436 | EMG1 | HTA11_2487_2000001011 | Human | Colorectum | SER | 3.37e-03 | 1.80e-01 | -0.1808 |
| 10436 | EMG1 | HTA11_1938_2000001011 | Human | Colorectum | AD | 2.86e-06 | 2.76e-01 | -0.0811 |
| 10436 | EMG1 | HTA11_347_2000001011 | Human | Colorectum | AD | 3.72e-05 | 1.41e-01 | -0.1954 |
| 10436 | EMG1 | HTA11_411_2000001011 | Human | Colorectum | SER | 1.86e-06 | 3.68e-01 | -0.2602 |
| 10436 | EMG1 | HTA11_696_2000001011 | Human | Colorectum | AD | 2.07e-07 | 1.70e-01 | -0.1464 |
| 10436 | EMG1 | HTA11_866_2000001011 | Human | Colorectum | AD | 8.13e-03 | 9.31e-02 | -0.1001 |
| 10436 | EMG1 | HTA11_1391_2000001011 | Human | Colorectum | AD | 1.88e-04 | 1.88e-01 | -0.059 |
| 10436 | EMG1 | HTA11_2992_2000001011 | Human | Colorectum | SER | 1.51e-04 | 2.39e-01 | -0.1706 |
| 10436 | EMG1 | HTA11_5216_2000001011 | Human | Colorectum | SER | 3.40e-02 | 1.93e-01 | -0.1462 |
| 10436 | EMG1 | HTA11_546_2000001011 | Human | Colorectum | AD | 2.65e-04 | 2.45e-01 | -0.0842 |
| 10436 | EMG1 | HTA11_866_3004761011 | Human | Colorectum | AD | 3.01e-09 | 2.22e-01 | 0.096 |
| 10436 | EMG1 | HTA11_4255_2000001011 | Human | Colorectum | SER | 3.03e-06 | 4.15e-01 | 0.0446 |
| 10436 | EMG1 | HTA11_7696_3000711011 | Human | Colorectum | AD | 9.56e-07 | 1.59e-01 | 0.0674 |
| 10436 | EMG1 | HTA11_7469_2000001011 | Human | Colorectum | AD | 2.39e-03 | 3.74e-01 | -0.0124 |
| 10436 | EMG1 | HTA11_6818_2000001021 | Human | Colorectum | AD | 1.15e-02 | 1.45e-01 | 0.0588 |
| 10436 | EMG1 | HTA11_99999970781_79442 | Human | Colorectum | MSS | 6.35e-15 | 2.82e-01 | 0.294 |
| 10436 | EMG1 | HTA11_99999965104_69814 | Human | Colorectum | MSS | 3.26e-04 | 1.80e-01 | 0.281 |
| 10436 | EMG1 | HTA11_99999971662_82457 | Human | Colorectum | MSS | 2.12e-29 | 5.65e-01 | 0.3859 |
| 10436 | EMG1 | HTA11_99999973899_84307 | Human | Colorectum | MSS | 5.79e-04 | 1.84e-01 | 0.2585 |
| Page: 1 2 3 4 5 6 |
| Tissue | Expression Dynamics | Abbreviation |
| Colorectum (GSE201348) |  | FAP: Familial adenomatous polyposis |
| CRC: Colorectal cancer | ||
| Colorectum (HTA11) |  | AD: Adenomas |
| SER: Sessile serrated lesions | ||
| MSI-H: Microsatellite-high colorectal cancer | ||
| MSS: Microsatellite stable colorectal cancer | ||
| Esophagus | 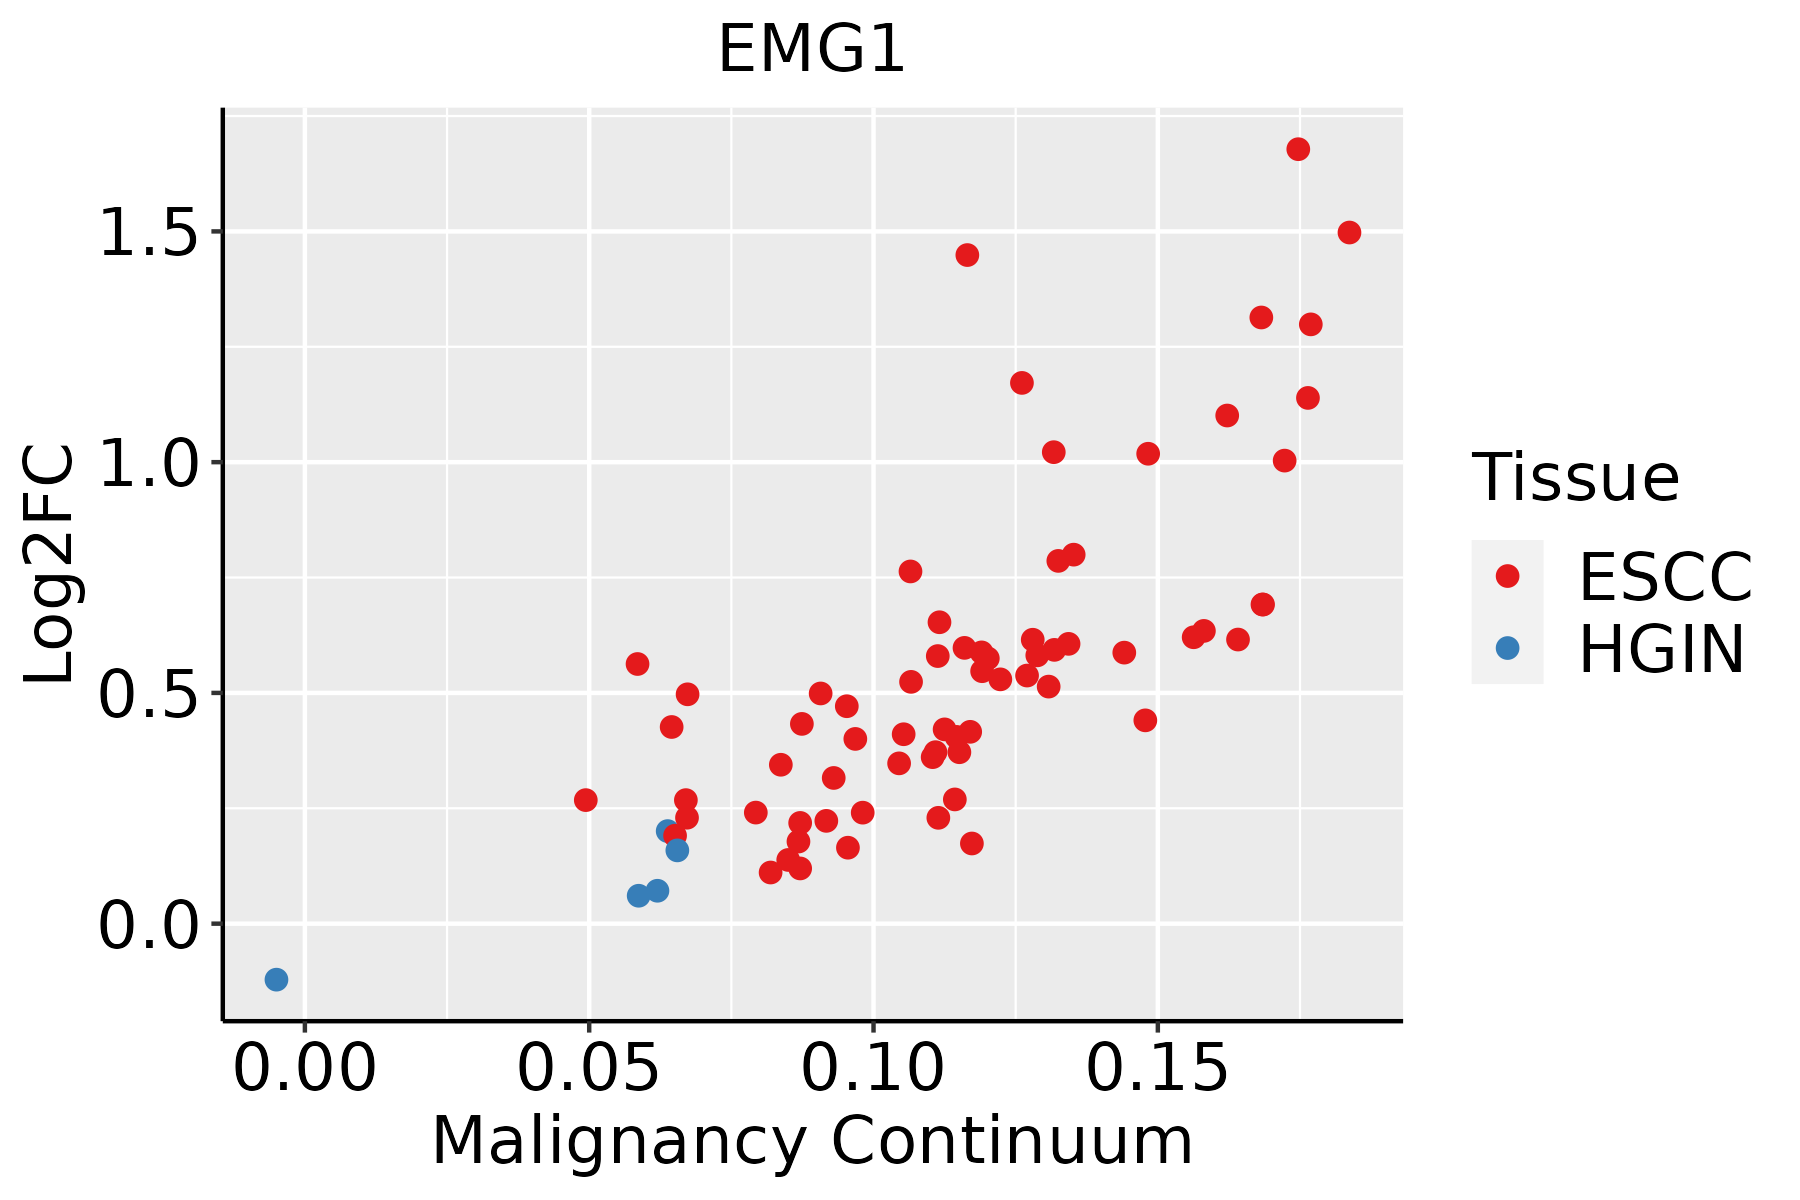 | ESCC: Esophageal squamous cell carcinoma |
| HGIN: High-grade intraepithelial neoplasias | ||
| LGIN: Low-grade intraepithelial neoplasias | ||
| Oral Cavity |  | EOLP: Erosive Oral lichen planus |
| LP: leukoplakia | ||
| NEOLP: Non-erosive oral lichen planus | ||
| OSCC: Oral squamous cell carcinoma | ||
| Skin | 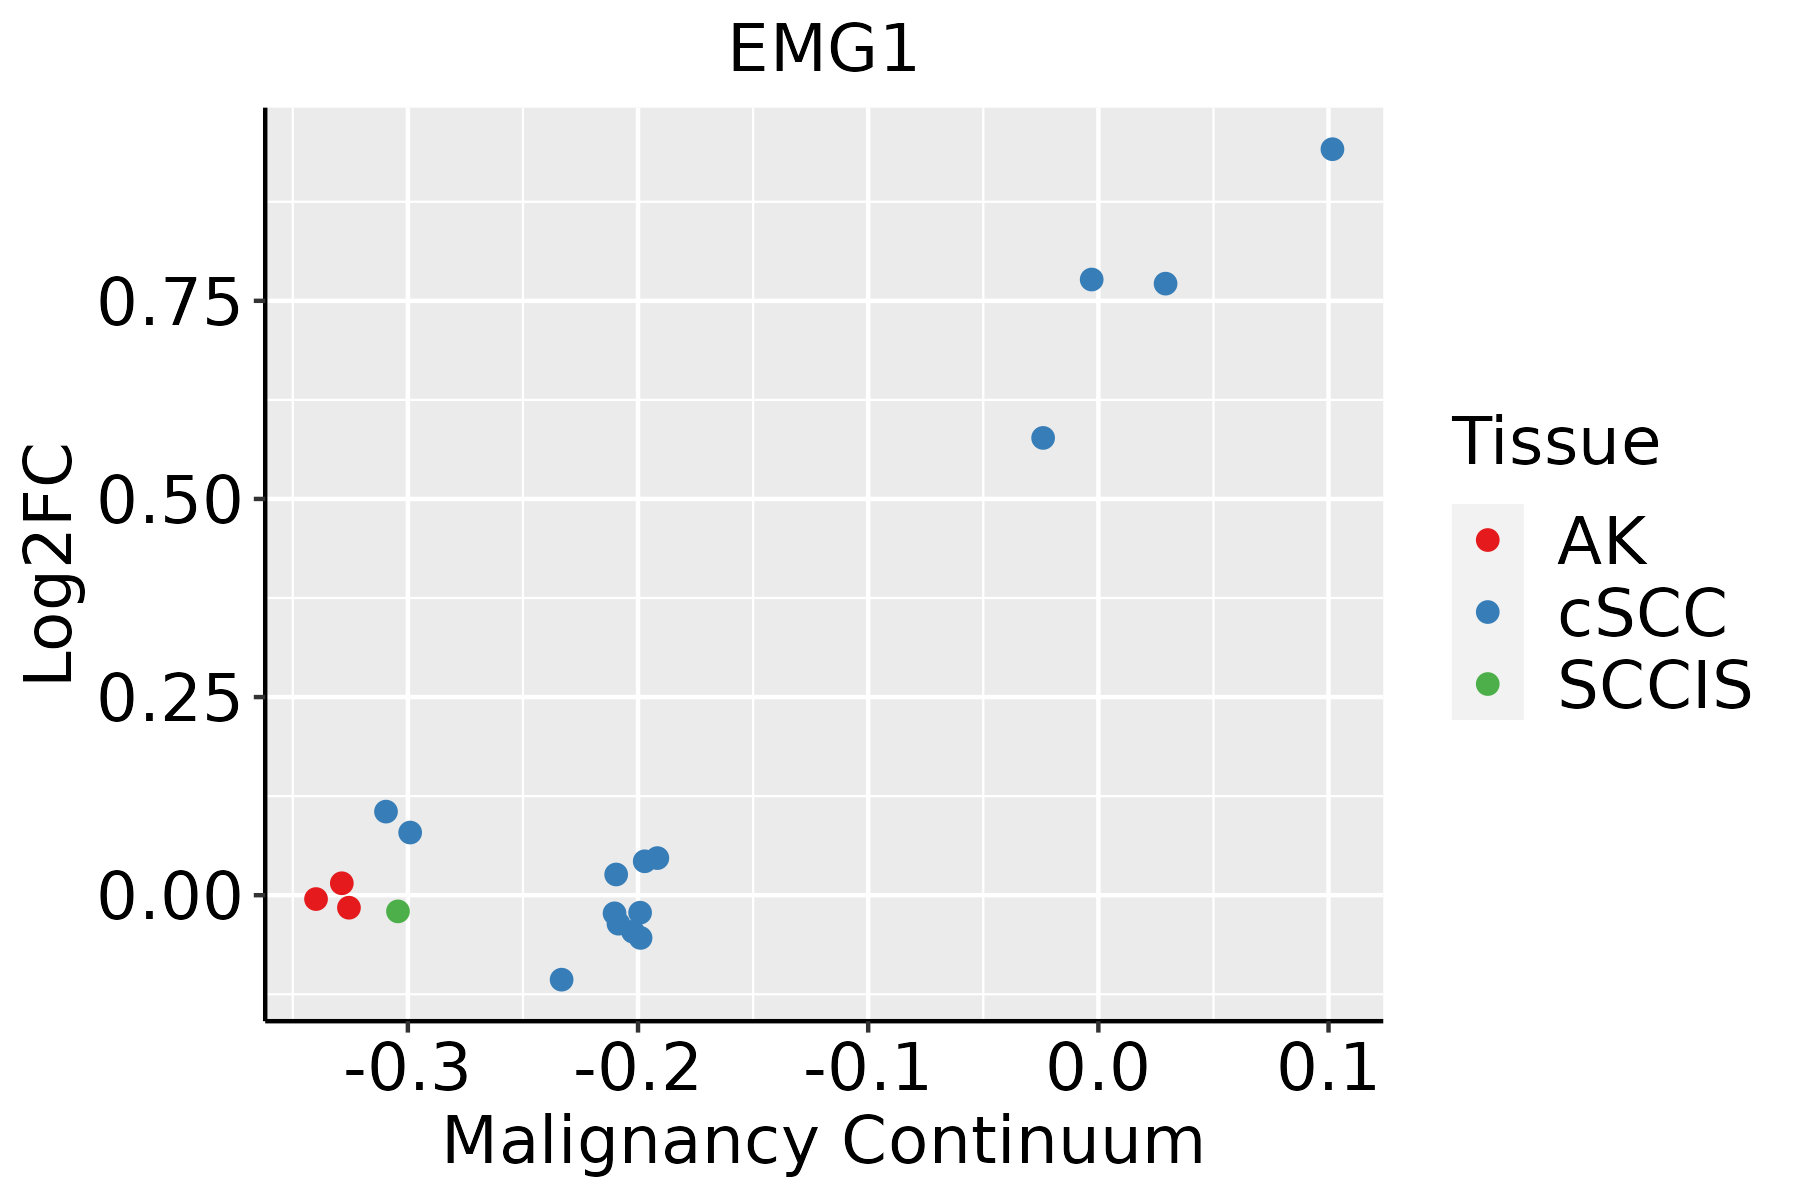 | AK: Actinic keratosis |
| cSCC: Cutaneous squamous cell carcinoma | ||
| SCCIS:squamous cell carcinoma in situ |
| ∗log2FC in expression of this searched gene in stem-like cells from each diseased tissue sample relative to stem-like cells in normal samples in each tissue plotted against the malignancy continuum. Samples are colored based on if they are from different disease stage. |
Top |
Malignant transformation related pathway analysis |
| Find out the enriched GO biological processes and KEGG pathways involved in transition from healthy to precancer to cancer |
| Tissue | Disease Stage | Enriched GO biological Processes |
| Colorectum | AD |  |
| Colorectum | SER |  |
| Colorectum | MSS |  |
| Colorectum | MSI-H |  |
| Colorectum | FAP |  |
| ∗Top 15 enriched GO BP terms are showed in the bar plot of each disease state in each tissue. Each row represents a significant GO biological process which is colored according to the -log10(p.adjust). |
| Page: 1 2 3 4 5 6 7 8 9 |
| GO ID | Tissue | Disease Stage | Description | Gene Ratio | Bg Ratio | pvalue | p.adjust | Count |
| GO:0022613 | Colorectum | AD | ribonucleoprotein complex biogenesis | 151/3918 | 463/18723 | 1.96e-09 | 1.39e-07 | 151 |
| GO:0001701 | Colorectum | AD | in utero embryonic development | 110/3918 | 367/18723 | 2.36e-05 | 4.62e-04 | 110 |
| GO:0042254 | Colorectum | AD | ribosome biogenesis | 84/3918 | 299/18723 | 1.82e-03 | 1.50e-02 | 84 |
| GO:0042274 | Colorectum | AD | ribosomal small subunit biogenesis | 25/3918 | 73/18723 | 5.69e-03 | 3.64e-02 | 25 |
| GO:00226131 | Colorectum | SER | ribonucleoprotein complex biogenesis | 112/2897 | 463/18723 | 5.01e-07 | 2.48e-05 | 112 |
| GO:00422741 | Colorectum | SER | ribosomal small subunit biogenesis | 23/2897 | 73/18723 | 4.50e-04 | 6.57e-03 | 23 |
| GO:00422541 | Colorectum | SER | ribosome biogenesis | 66/2897 | 299/18723 | 1.48e-03 | 1.60e-02 | 66 |
| GO:00017011 | Colorectum | SER | in utero embryonic development | 77/2897 | 367/18723 | 2.77e-03 | 2.48e-02 | 77 |
| GO:00226132 | Colorectum | MSS | ribonucleoprotein complex biogenesis | 144/3467 | 463/18723 | 2.76e-11 | 3.67e-09 | 144 |
| GO:00017012 | Colorectum | MSS | in utero embryonic development | 99/3467 | 367/18723 | 3.71e-05 | 7.10e-04 | 99 |
| GO:00422542 | Colorectum | MSS | ribosome biogenesis | 79/3467 | 299/18723 | 4.32e-04 | 5.23e-03 | 79 |
| GO:0006364 | Colorectum | MSS | rRNA processing | 58/3467 | 225/18723 | 4.17e-03 | 3.03e-02 | 58 |
| GO:0016072 | Colorectum | MSS | rRNA metabolic process | 60/3467 | 236/18723 | 5.01e-03 | 3.46e-02 | 60 |
| GO:0022613111 | Esophagus | ESCC | ribonucleoprotein complex biogenesis | 365/8552 | 463/18723 | 1.74e-49 | 1.11e-45 | 365 |
| GO:0042254111 | Esophagus | ESCC | ribosome biogenesis | 252/8552 | 299/18723 | 3.27e-44 | 1.04e-40 | 252 |
| GO:003447015 | Esophagus | ESCC | ncRNA processing | 300/8552 | 395/18723 | 3.09e-35 | 3.26e-32 | 300 |
| GO:0016072110 | Esophagus | ESCC | rRNA metabolic process | 197/8552 | 236/18723 | 1.31e-33 | 1.18e-30 | 197 |
| GO:0006364110 | Esophagus | ESCC | rRNA processing | 189/8552 | 225/18723 | 4.88e-33 | 3.87e-30 | 189 |
| GO:003466012 | Esophagus | ESCC | ncRNA metabolic process | 346/8552 | 485/18723 | 4.35e-31 | 2.51e-28 | 346 |
| GO:0042274111 | Esophagus | ESCC | ribosomal small subunit biogenesis | 67/8552 | 73/18723 | 6.62e-17 | 5.38e-15 | 67 |
| Page: 1 2 3 4 |
| Pathway ID | Tissue | Disease Stage | Description | Gene Ratio | Bg Ratio | pvalue | p.adjust | qvalue | Count |
| Page: 1 |
Top |
Cell-cell communication analysis |
| Identification of potential cell-cell interactions between two cell types and their ligand-receptor pairs for different disease states |
| Ligand | Receptor | LRpair | Pathway | Tissue | Disease Stage |
| Page: 1 |
Top |
Single-cell gene regulatory network inference analysis |
| Find out the significant the regulons (TFs) and the target genes of each regulon across cell types for different disease states |
| TF | Cell Type | Tissue | Disease Stage | Target Gene | RSS | Regulon Activity |
| ∗The dot plots of a searched regulon are shown for all cell subpopulations in each disease state of each tissue based on the regulon specific score inferred using pySCENIC and by calculating the average expression. |
| Page: 1 |
Top |
Somatic mutation of malignant transformation related genes |
| Annotation of somatic variants for genes involved in malignant transformation |
| Hugo Symbol | Variant Class | Variant Classification | dbSNP RS | HGVSc | HGVSp | HGVSp Short | SWISSPROT | BIOTYPE | SIFT | PolyPhen | Tumor Sample Barcode | Tissue | Histology | Sex | Age | Stage | Therapy Types | Drugs | Outcome |
| EMG1 | SNV | Missense_Mutation | novel | c.149N>T | p.Ala50Val | p.A50V | Q92979 | protein_coding | deleterious(0) | probably_damaging(0.989) | TCGA-A8-A09Z-01 | Breast | breast invasive carcinoma | Female | >=65 | I/II | Unknown | Unknown | SD |
| EMG1 | SNV | Missense_Mutation | novel | c.222N>T | p.Leu74Phe | p.L74F | Q92979 | protein_coding | deleterious(0.01) | possibly_damaging(0.652) | TCGA-ZJ-AAXD-01 | Cervix | cervical & endocervical cancer | Female | <65 | III/IV | Unknown | Unknown | SD |
| EMG1 | SNV | Missense_Mutation | novel | c.548N>G | p.Val183Gly | p.V183G | Q92979 | protein_coding | deleterious(0) | benign(0.143) | TCGA-5M-AAT6-01 | Colorectum | colon adenocarcinoma | Female | <65 | III/IV | Unknown | Unknown | PD |
| EMG1 | SNV | Missense_Mutation | novel | c.479A>G | p.Lys160Arg | p.K160R | Q92979 | protein_coding | deleterious(0.04) | possibly_damaging(0.53) | TCGA-AA-3672-01 | Colorectum | colon adenocarcinoma | Female | >=65 | III/IV | Unknown | Unknown | SD |
| EMG1 | SNV | Missense_Mutation | novel | c.374G>A | p.Arg125Gln | p.R125Q | Q92979 | protein_coding | deleterious(0) | probably_damaging(0.989) | TCGA-CA-5796-01 | Colorectum | colon adenocarcinoma | Female | <65 | I/II | Chemotherapy | oxaliplatin | CR |
| EMG1 | SNV | Missense_Mutation | novel | c.359T>C | p.Val120Ala | p.V120A | Q92979 | protein_coding | deleterious(0.01) | probably_damaging(0.982) | TCGA-AG-A00Y-01 | Colorectum | rectum adenocarcinoma | Male | >=65 | I/II | Unknown | Unknown | PD |
| EMG1 | SNV | Missense_Mutation | novel | c.395N>A | p.Arg132His | p.R132H | Q92979 | protein_coding | deleterious(0) | probably_damaging(0.983) | TCGA-EI-7002-01 | Colorectum | rectum adenocarcinoma | Male | <65 | III/IV | Chemotherapy | irinotecan+5-fluorouracilim | SD |
| EMG1 | insertion | Frame_Shift_Ins | novel | c.597_598insT | p.Val200CysfsTer22 | p.V200Cfs*22 | Q92979 | protein_coding | TCGA-EI-6885-01 | Colorectum | rectum adenocarcinoma | Female | <65 | III/IV | Chemotherapy | oxaliplatinum+5-fu | PD | ||
| EMG1 | insertion | Frame_Shift_Ins | novel | c.599dupT | p.Gly201ArgfsTer21 | p.G201Rfs*21 | Q92979 | protein_coding | TCGA-EI-6885-01 | Colorectum | rectum adenocarcinoma | Female | <65 | III/IV | Chemotherapy | oxaliplatinum+5-fu | PD | ||
| EMG1 | SNV | Missense_Mutation | rs3168594 | c.104G>A | p.Gly35Glu | p.G35E | Q92979 | protein_coding | tolerated(1) | benign(0.001) | TCGA-A5-A0G2-01 | Endometrium | uterine corpus endometrioid carcinoma | Female | <65 | III/IV | Unknown | Unknown | SD |
| Page: 1 2 3 |
Top |
Related drugs of malignant transformation related genes |
| Identification of chemicals and drugs interact with genes involved in malignant transfromation |
| (DGIdb 4.0) |
| Entrez ID | Symbol | Category | Interaction Types | Drug Claim Name | Drug Name | PMIDs |
| Page: 1 |

Copyright 2023-Present -The University of Texas Health Science Center at Houston |