
|
|||||
|
 | |
| |
| |
| |
| |
| |
|
Gene: EMD |
Gene summary for EMD |
| Gene information | Species | Human | Gene symbol | EMD | Gene ID | 2010 |
| Gene name | emerin | |
| Gene Alias | EDMD | |
| Cytomap | Xq28 | |
| Gene Type | protein-coding | GO ID | GO:0003008 | UniProtAcc | P50402 |
Top |
Malignant transformation analysis |
| Identification of the aberrant gene expression in precancerous and cancerous lesions by comparing the gene expression of stem-like cells in diseased tissues with normal stem cells |
| Entrez ID | Symbol | Replicates | Species | Organ | Tissue | Adj P-value | Log2FC | Malignancy |
| 2010 | EMD | HTA11_3410_2000001011 | Human | Colorectum | AD | 5.33e-04 | 1.55e-01 | 0.0155 |
| 2010 | EMD | HTA11_2487_2000001011 | Human | Colorectum | SER | 2.89e-07 | 2.87e-01 | -0.1808 |
| 2010 | EMD | HTA11_2951_2000001011 | Human | Colorectum | AD | 3.87e-02 | 2.79e-01 | 0.0216 |
| 2010 | EMD | HTA11_1938_2000001011 | Human | Colorectum | AD | 2.62e-02 | 1.92e-01 | -0.0811 |
| 2010 | EMD | HTA11_347_2000001011 | Human | Colorectum | AD | 9.56e-08 | 2.62e-01 | -0.1954 |
| 2010 | EMD | HTA11_411_2000001011 | Human | Colorectum | SER | 4.39e-03 | 5.71e-01 | -0.2602 |
| 2010 | EMD | HTA11_3361_2000001011 | Human | Colorectum | AD | 1.66e-07 | 3.99e-01 | -0.1207 |
| 2010 | EMD | HTA11_696_2000001011 | Human | Colorectum | AD | 9.34e-11 | 3.22e-01 | -0.1464 |
| 2010 | EMD | HTA11_866_2000001011 | Human | Colorectum | AD | 9.11e-06 | 1.76e-01 | -0.1001 |
| 2010 | EMD | HTA11_1391_2000001011 | Human | Colorectum | AD | 1.20e-12 | 4.34e-01 | -0.059 |
| 2010 | EMD | HTA11_546_2000001011 | Human | Colorectum | AD | 4.12e-04 | 3.86e-01 | -0.0842 |
| 2010 | EMD | HTA11_866_3004761011 | Human | Colorectum | AD | 7.05e-07 | 3.06e-01 | 0.096 |
| 2010 | EMD | HTA11_8622_2000001021 | Human | Colorectum | SER | 4.20e-02 | 2.58e-01 | 0.0528 |
| 2010 | EMD | HTA11_7663_2000001011 | Human | Colorectum | SER | 4.64e-03 | 3.78e-01 | 0.0131 |
| 2010 | EMD | HTA11_10711_2000001011 | Human | Colorectum | AD | 2.32e-03 | 2.20e-01 | 0.0338 |
| 2010 | EMD | HTA11_7696_3000711011 | Human | Colorectum | AD | 2.69e-14 | 3.25e-01 | 0.0674 |
| 2010 | EMD | HTA11_7469_2000001011 | Human | Colorectum | AD | 9.89e-03 | 4.64e-01 | -0.0124 |
| 2010 | EMD | HTA11_6818_2000001021 | Human | Colorectum | AD | 2.39e-05 | 3.90e-01 | 0.0588 |
| 2010 | EMD | HTA11_99999970781_79442 | Human | Colorectum | MSS | 3.63e-12 | 3.19e-01 | 0.294 |
| 2010 | EMD | HTA11_99999965104_69814 | Human | Colorectum | MSS | 6.42e-14 | 4.55e-01 | 0.281 |
| Page: 1 2 3 4 5 6 7 8 |
| Tissue | Expression Dynamics | Abbreviation |
| Colorectum (GSE201348) |  | FAP: Familial adenomatous polyposis |
| CRC: Colorectal cancer | ||
| Colorectum (HTA11) |  | AD: Adenomas |
| SER: Sessile serrated lesions | ||
| MSI-H: Microsatellite-high colorectal cancer | ||
| MSS: Microsatellite stable colorectal cancer | ||
| Esophagus |  | ESCC: Esophageal squamous cell carcinoma |
| HGIN: High-grade intraepithelial neoplasias | ||
| LGIN: Low-grade intraepithelial neoplasias | ||
| Liver | 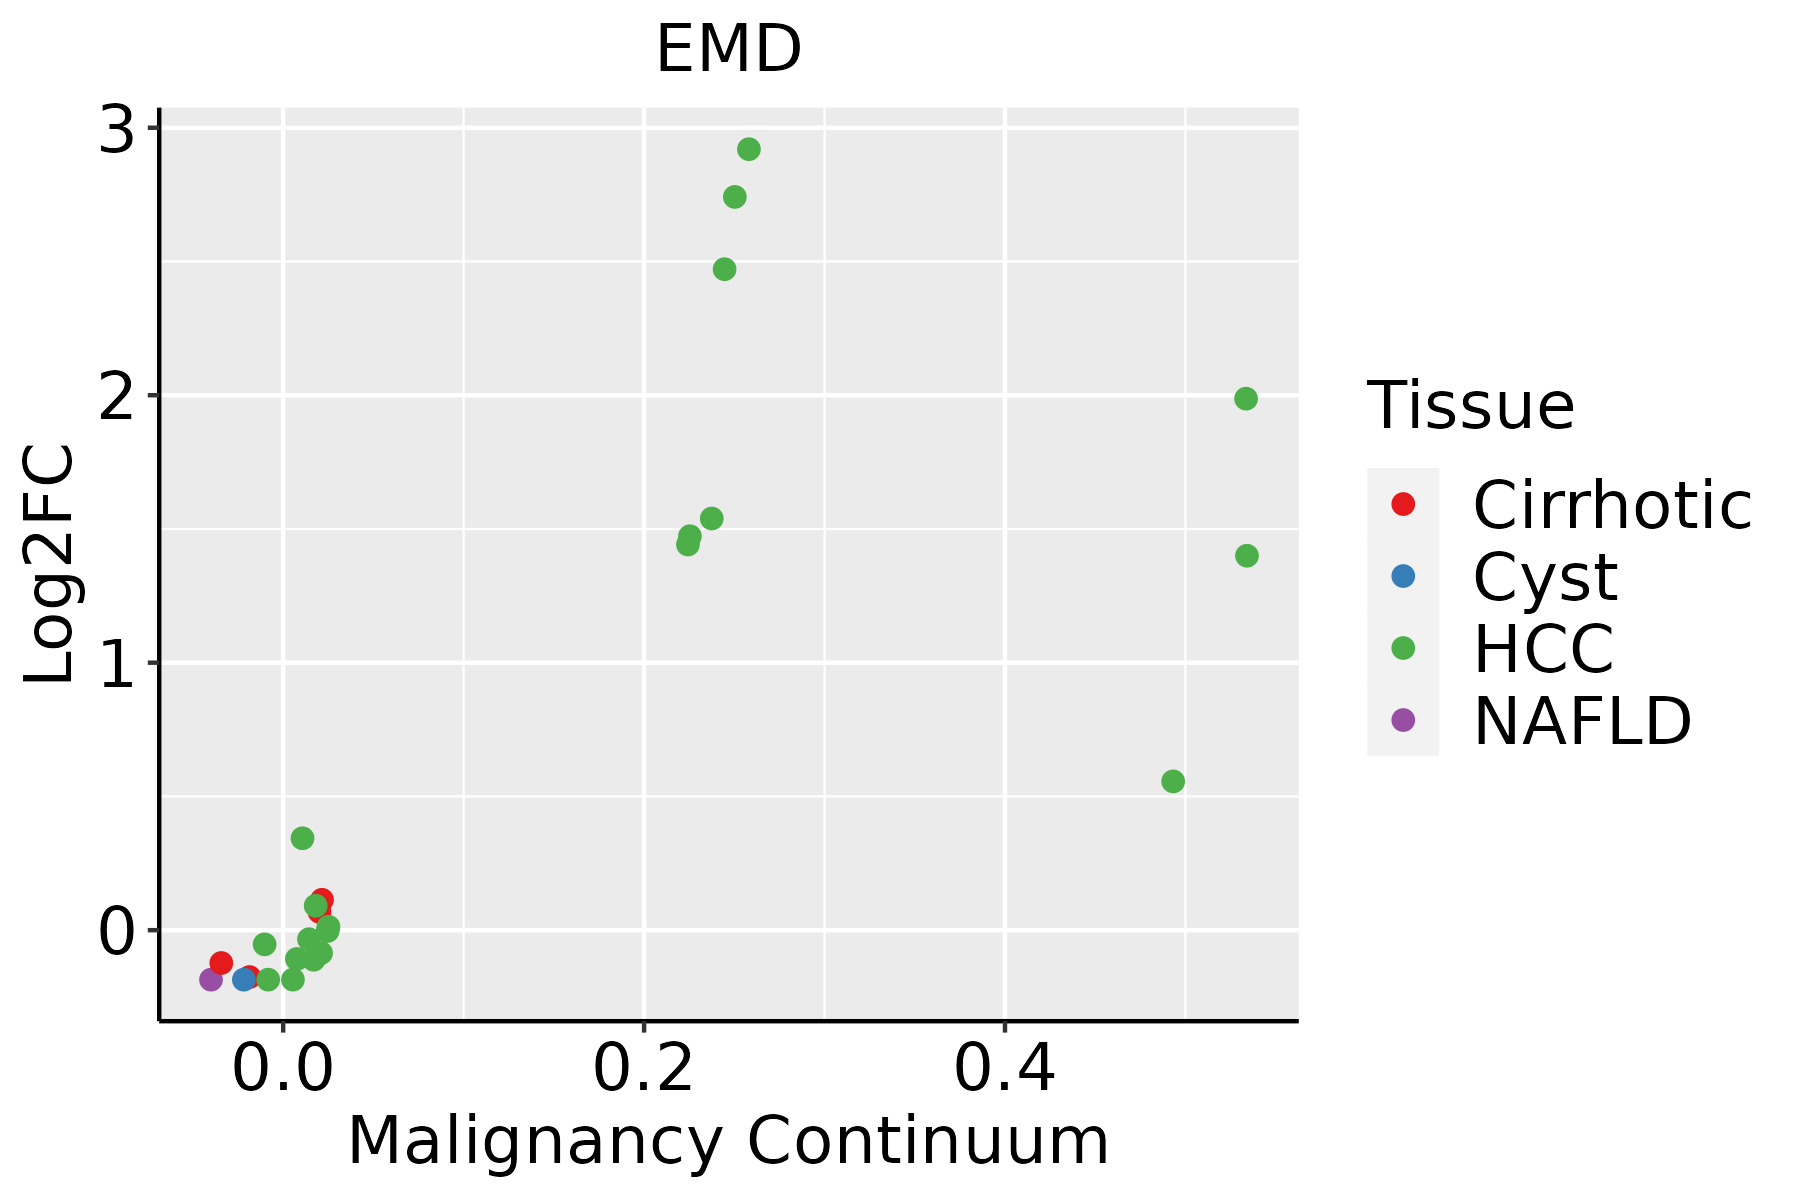 | HCC: Hepatocellular carcinoma |
| NAFLD: Non-alcoholic fatty liver disease | ||
| Oral Cavity | 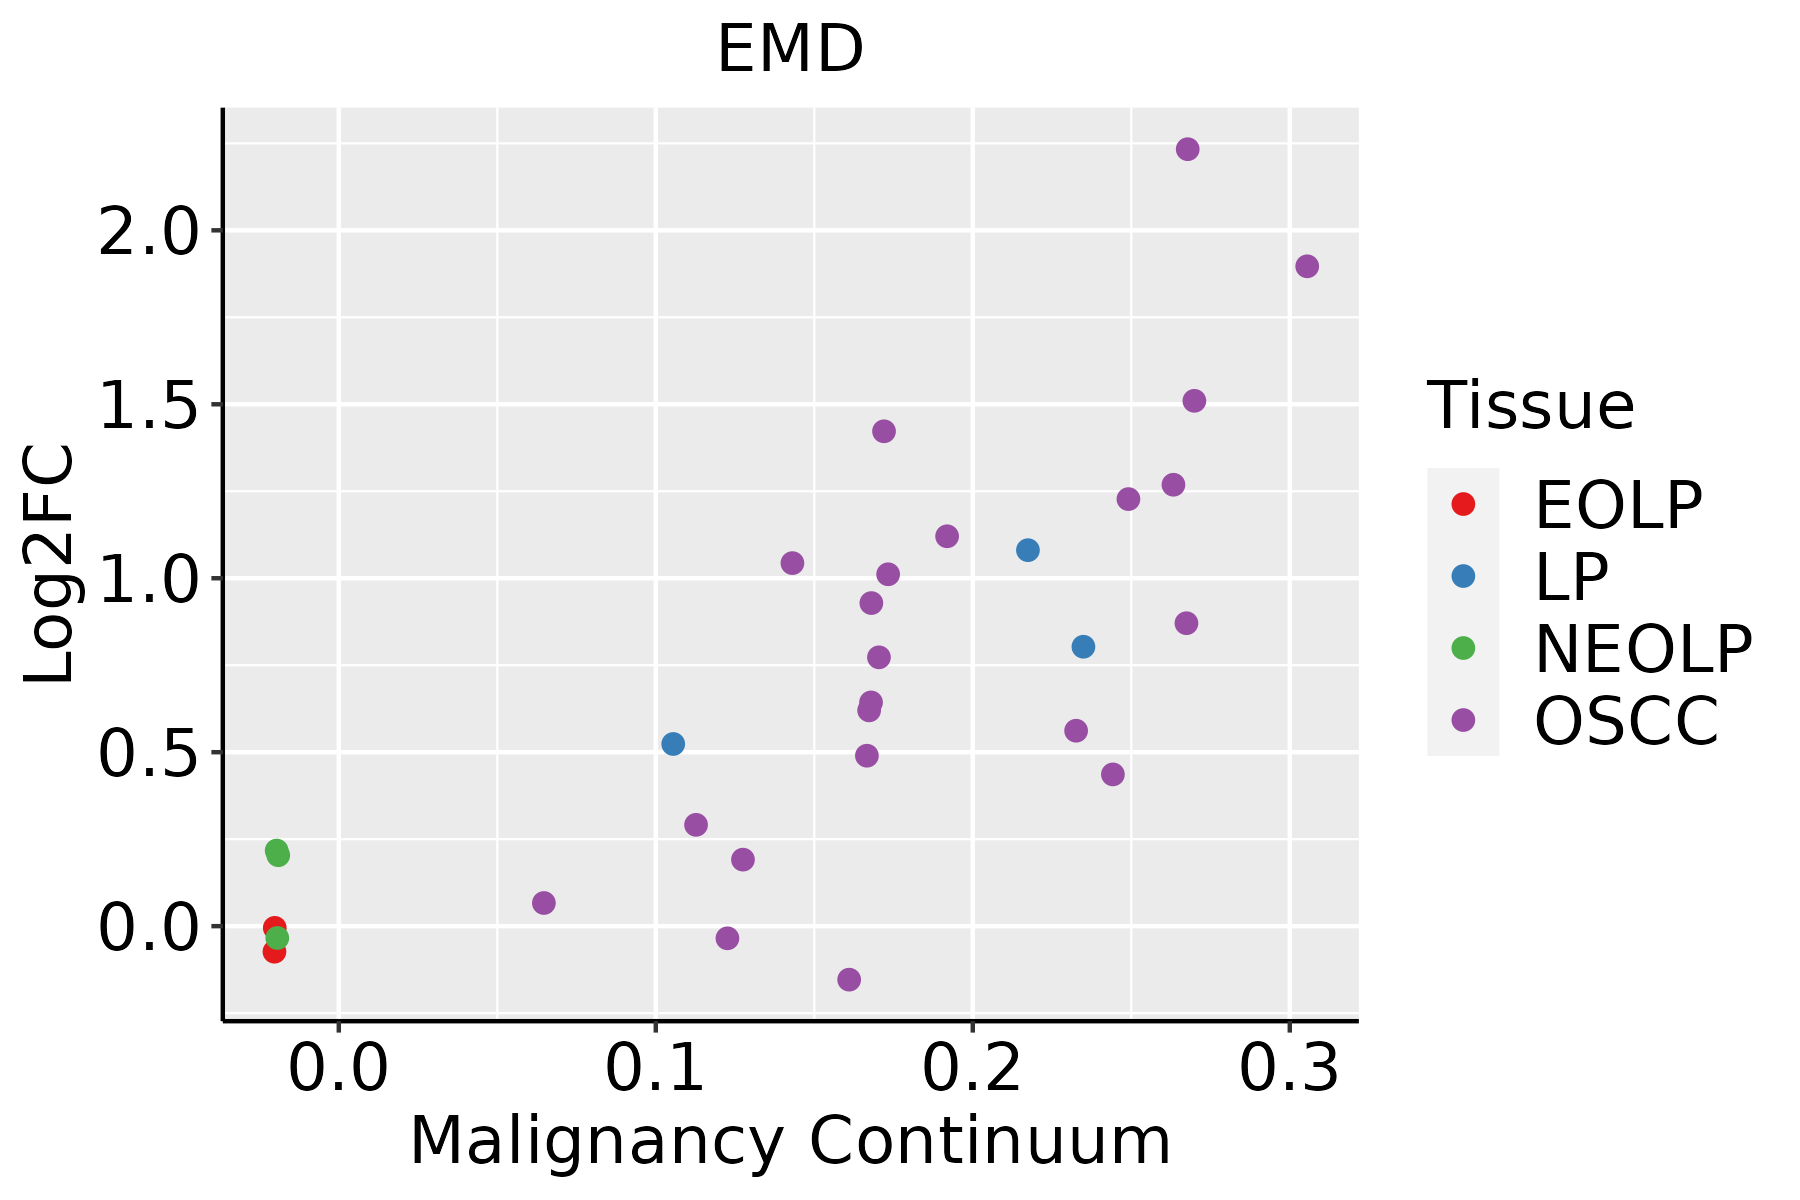 | EOLP: Erosive Oral lichen planus |
| LP: leukoplakia | ||
| NEOLP: Non-erosive oral lichen planus | ||
| OSCC: Oral squamous cell carcinoma | ||
| Skin | 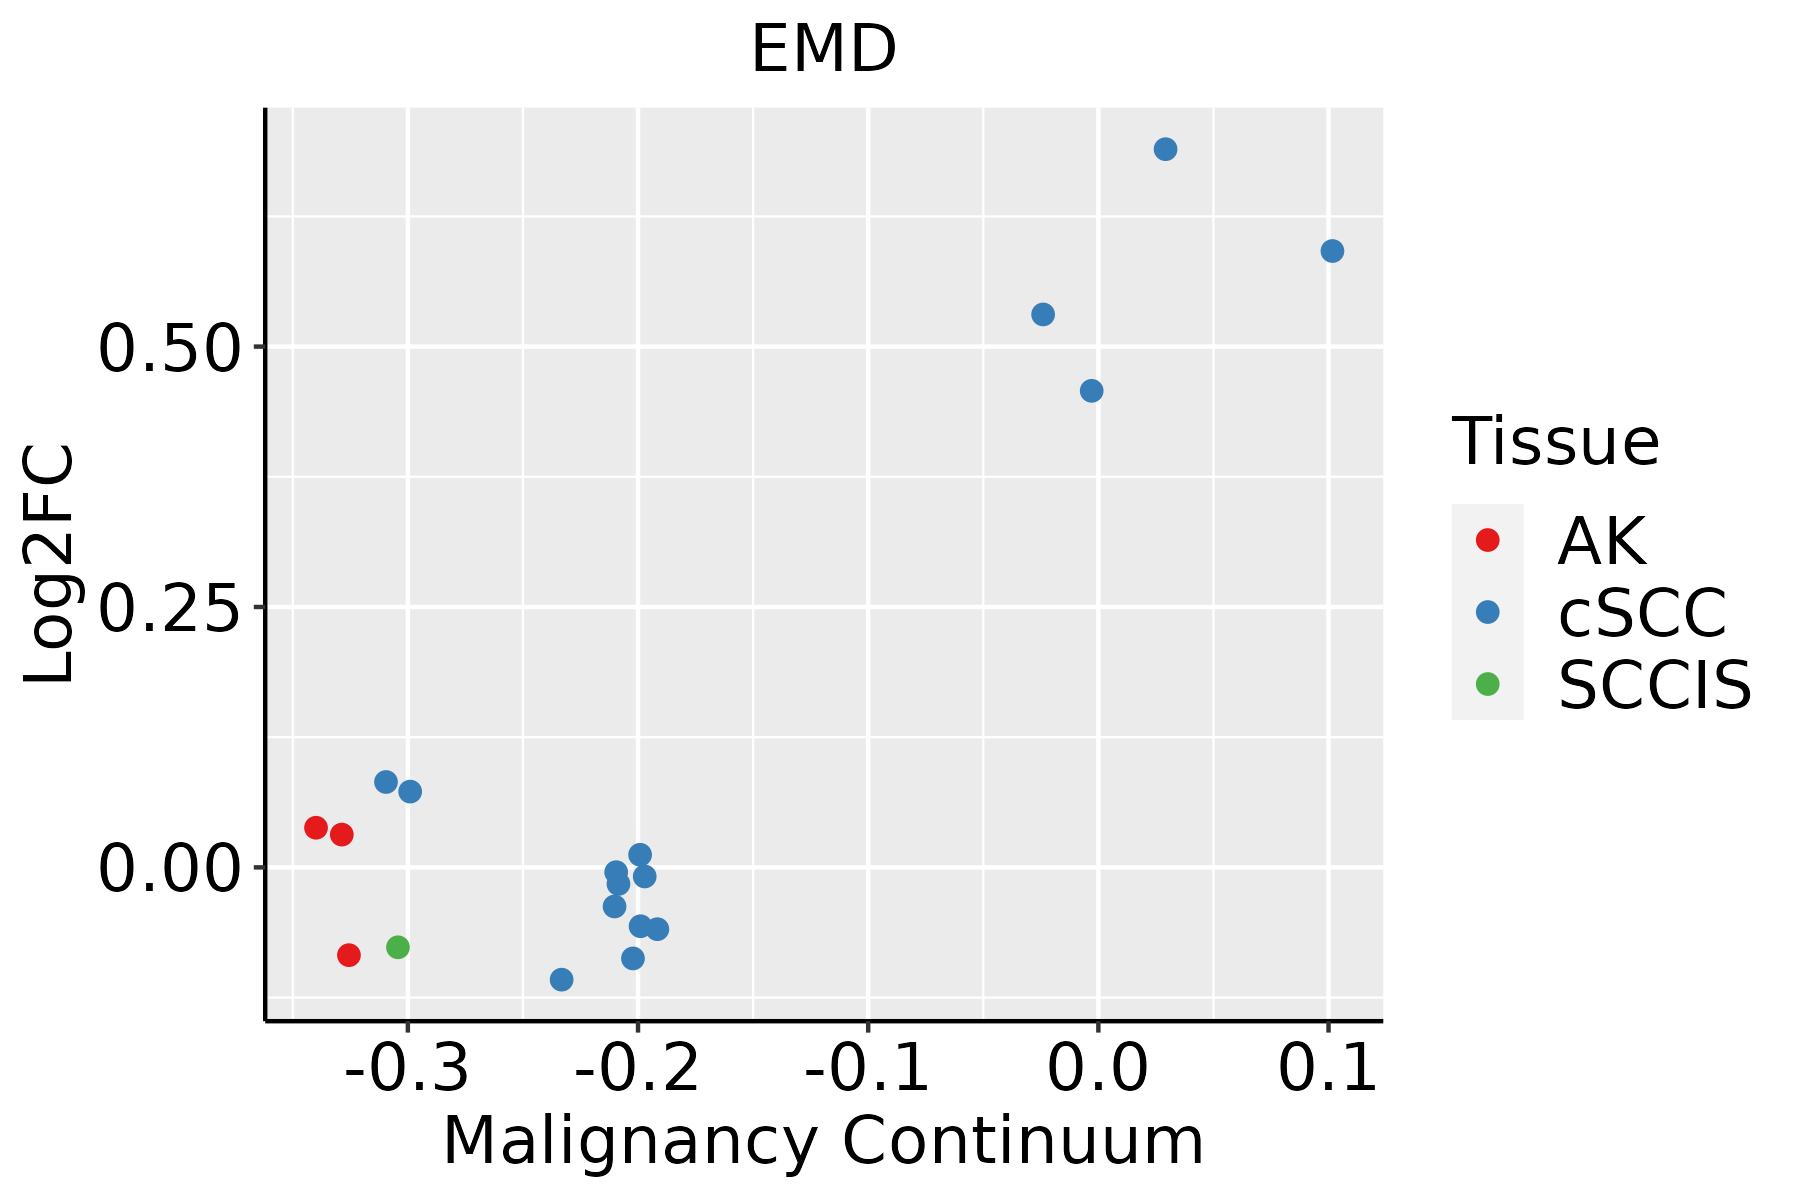 | AK: Actinic keratosis |
| cSCC: Cutaneous squamous cell carcinoma | ||
| SCCIS:squamous cell carcinoma in situ | ||
| Thyroid | 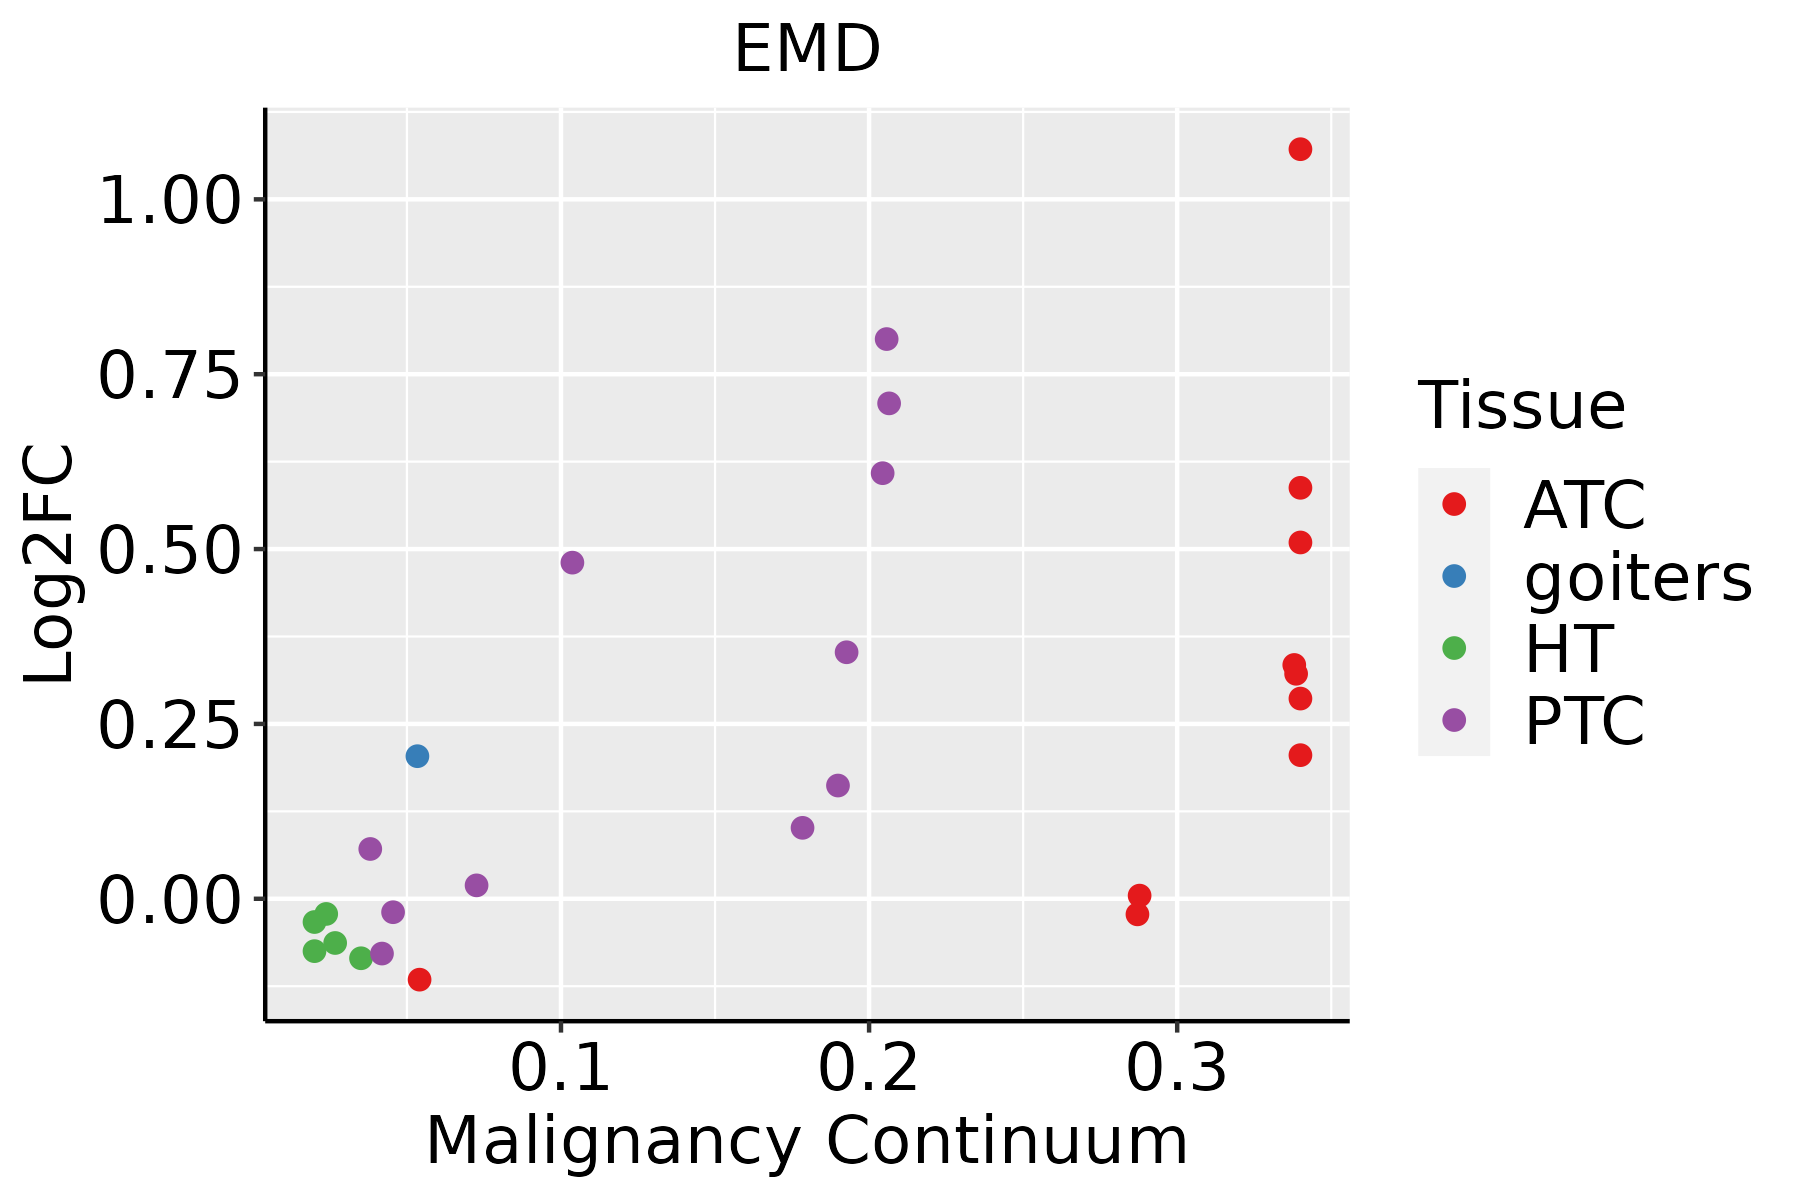 | ATC: Anaplastic thyroid cancer |
| HT: Hashimoto's thyroiditis | ||
| PTC: Papillary thyroid cancer |
| ∗log2FC in expression of this searched gene in stem-like cells from each diseased tissue sample relative to stem-like cells in normal samples in each tissue plotted against the malignancy continuum. Samples are colored based on if they are from different disease stage. |
Top |
Malignant transformation related pathway analysis |
| Find out the enriched GO biological processes and KEGG pathways involved in transition from healthy to precancer to cancer |
| Tissue | Disease Stage | Enriched GO biological Processes |
| Colorectum | AD |  |
| Colorectum | SER |  |
| Colorectum | MSS |  |
| Colorectum | MSI-H |  |
| Colorectum | FAP |  |
| ∗Top 15 enriched GO BP terms are showed in the bar plot of each disease state in each tissue. Each row represents a significant GO biological process which is colored according to the -log10(p.adjust). |
| Page: 1 2 3 4 5 6 7 8 9 |
| GO ID | Tissue | Disease Stage | Description | Gene Ratio | Bg Ratio | pvalue | p.adjust | Count |
| GO:00071786 | Cervix | CC | transmembrane receptor protein serine/threonine kinase signaling pathway | 67/2311 | 355/18723 | 2.39e-04 | 2.67e-03 | 67 |
| GO:00715595 | Cervix | CC | response to transforming growth factor beta | 50/2311 | 256/18723 | 6.31e-04 | 5.91e-03 | 50 |
| GO:00715605 | Cervix | CC | cellular response to transforming growth factor beta stimulus | 49/2311 | 250/18723 | 6.55e-04 | 6.05e-03 | 49 |
| GO:00071795 | Cervix | CC | transforming growth factor beta receptor signaling pathway | 38/2311 | 198/18723 | 3.62e-03 | 2.31e-02 | 38 |
| GO:1904951 | Colorectum | AD | positive regulation of establishment of protein localization | 112/3918 | 319/18723 | 2.55e-09 | 1.80e-07 | 112 |
| GO:0051222 | Colorectum | AD | positive regulation of protein transport | 106/3918 | 303/18723 | 8.45e-09 | 5.08e-07 | 106 |
| GO:0006913 | Colorectum | AD | nucleocytoplasmic transport | 102/3918 | 301/18723 | 1.00e-07 | 4.85e-06 | 102 |
| GO:0051169 | Colorectum | AD | nuclear transport | 102/3918 | 301/18723 | 1.00e-07 | 4.85e-06 | 102 |
| GO:0090316 | Colorectum | AD | positive regulation of intracellular protein transport | 62/3918 | 160/18723 | 1.82e-07 | 7.79e-06 | 62 |
| GO:0032388 | Colorectum | AD | positive regulation of intracellular transport | 74/3918 | 202/18723 | 1.83e-07 | 7.80e-06 | 74 |
| GO:0032386 | Colorectum | AD | regulation of intracellular transport | 109/3918 | 337/18723 | 5.33e-07 | 1.95e-05 | 109 |
| GO:0033157 | Colorectum | AD | regulation of intracellular protein transport | 80/3918 | 229/18723 | 5.81e-07 | 2.09e-05 | 80 |
| GO:0030111 | Colorectum | AD | regulation of Wnt signaling pathway | 102/3918 | 328/18723 | 8.51e-06 | 2.03e-04 | 102 |
| GO:0016055 | Colorectum | AD | Wnt signaling pathway | 130/3918 | 444/18723 | 1.60e-05 | 3.37e-04 | 130 |
| GO:0198738 | Colorectum | AD | cell-cell signaling by wnt | 130/3918 | 446/18723 | 2.02e-05 | 4.10e-04 | 130 |
| GO:0046822 | Colorectum | AD | regulation of nucleocytoplasmic transport | 41/3918 | 106/18723 | 2.17e-05 | 4.33e-04 | 41 |
| GO:0046824 | Colorectum | AD | positive regulation of nucleocytoplasmic transport | 27/3918 | 62/18723 | 4.91e-05 | 8.43e-04 | 27 |
| GO:0051168 | Colorectum | AD | nuclear export | 53/3918 | 154/18723 | 6.89e-05 | 1.11e-03 | 53 |
| GO:0060070 | Colorectum | AD | canonical Wnt signaling pathway | 90/3918 | 303/18723 | 1.76e-04 | 2.38e-03 | 90 |
| GO:0060828 | Colorectum | AD | regulation of canonical Wnt signaling pathway | 77/3918 | 253/18723 | 2.19e-04 | 2.87e-03 | 77 |
| Page: 1 2 3 4 5 6 7 8 9 10 11 12 13 14 15 16 17 18 |
| Pathway ID | Tissue | Disease Stage | Description | Gene Ratio | Bg Ratio | pvalue | p.adjust | qvalue | Count |
| Page: 1 |
Top |
Cell-cell communication analysis |
| Identification of potential cell-cell interactions between two cell types and their ligand-receptor pairs for different disease states |
| Ligand | Receptor | LRpair | Pathway | Tissue | Disease Stage |
| Page: 1 |
Top |
Single-cell gene regulatory network inference analysis |
| Find out the significant the regulons (TFs) and the target genes of each regulon across cell types for different disease states |
| TF | Cell Type | Tissue | Disease Stage | Target Gene | RSS | Regulon Activity |
| ∗The dot plots of a searched regulon are shown for all cell subpopulations in each disease state of each tissue based on the regulon specific score inferred using pySCENIC and by calculating the average expression. |
| Page: 1 |
Top |
Somatic mutation of malignant transformation related genes |
| Annotation of somatic variants for genes involved in malignant transformation |
| Hugo Symbol | Variant Class | Variant Classification | dbSNP RS | HGVSc | HGVSp | HGVSp Short | SWISSPROT | BIOTYPE | SIFT | PolyPhen | Tumor Sample Barcode | Tissue | Histology | Sex | Age | Stage | Therapy Types | Drugs | Outcome |
| EMD | SNV | Missense_Mutation | c.700G>T | p.Val234Phe | p.V234F | P50402 | protein_coding | deleterious(0.02) | benign(0.235) | TCGA-AN-A0AM-01 | Breast | breast invasive carcinoma | Female | <65 | I/II | Unknown | Unknown | SD | |
| EMD | SNV | Missense_Mutation | c.173N>G | p.Ser58Cys | p.S58C | P50402 | protein_coding | tolerated(0.07) | possibly_damaging(0.75) | TCGA-C5-A1M6-01 | Cervix | cervical & endocervical cancer | Female | <65 | I/II | Chemotherapy | cisplatin | PD | |
| EMD | SNV | Missense_Mutation | c.720N>A | p.Phe240Leu | p.F240L | P50402 | protein_coding | tolerated(1) | benign(0) | TCGA-DS-A1OC-01 | Cervix | cervical & endocervical cancer | Female | <65 | I/II | Chemotherapy | gemcitabine | SD | |
| EMD | SNV | Missense_Mutation | rs782057378 | c.662N>A | p.Arg221His | p.R221H | P50402 | protein_coding | deleterious(0) | benign(0) | TCGA-AA-3662-01 | Colorectum | colon adenocarcinoma | Female | >=65 | III/IV | Chemotherapy | capecitabine | PR |
| EMD | SNV | Missense_Mutation | c.661C>T | p.Arg221Cys | p.R221C | P50402 | protein_coding | deleterious(0) | benign(0.441) | TCGA-AD-6889-01 | Colorectum | colon adenocarcinoma | Male | >=65 | I/II | Chemotherapy | xeloda | PD | |
| EMD | SNV | Missense_Mutation | c.146N>T | p.Ser49Leu | p.S49L | P50402 | protein_coding | tolerated(0.12) | benign(0.005) | TCGA-AZ-4313-01 | Colorectum | colon adenocarcinoma | Female | <65 | I/II | Unknown | Unknown | SD | |
| EMD | SNV | Missense_Mutation | novel | c.407A>C | p.Asp136Ala | p.D136A | P50402 | protein_coding | tolerated(0.05) | benign(0.003) | TCGA-CA-6717-01 | Colorectum | colon adenocarcinoma | Male | <65 | I/II | Chemotherapy | oxaliplatin | CR |
| EMD | SNV | Missense_Mutation | c.610C>A | p.Arg204Ser | p.R204S | P50402 | protein_coding | deleterious(0.01) | benign(0.182) | TCGA-CK-5913-01 | Colorectum | colon adenocarcinoma | Female | <65 | I/II | Unknown | Unknown | SD | |
| EMD | SNV | Missense_Mutation | c.752G>T | p.Gly251Val | p.G251V | P50402 | protein_coding | deleterious(0.01) | benign(0.298) | TCGA-AF-A56N-01 | Colorectum | rectum adenocarcinoma | Female | <65 | I/II | Chemotherapy | xeloda | CR | |
| EMD | SNV | Missense_Mutation | rs782768362 | c.385N>A | p.Ala129Thr | p.A129T | P50402 | protein_coding | tolerated(1) | benign(0) | TCGA-EI-6508-01 | Colorectum | rectum adenocarcinoma | Female | <65 | III/IV | Chemotherapy | oxaliplatin | SD |
| Page: 1 2 3 4 |
Top |
Related drugs of malignant transformation related genes |
| Identification of chemicals and drugs interact with genes involved in malignant transfromation |
| (DGIdb 4.0) |
| Entrez ID | Symbol | Category | Interaction Types | Drug Claim Name | Drug Name | PMIDs |
| Page: 1 |

Copyright 2023-Present -The University of Texas Health Science Center at Houston |