Schematic overview of the cellular and molecular mechanisms involved in the cancer progression, including the proposed cellular and molecular mechanisms in cancer cells trajectory. AT1: alveolar type 1 cells; AT2: alveolar type 2 cells; AAH: atypical adenomatous hyperplasia; AIS: adenocarcinoma in situ; MIA: minimally invasive adenocarcinoma; IA: invasive adenocarcinoma; EMT: epithelial-mesenchymal transition

Home

Download

Statistics

Help

Contact

Center for Computational Systems Medicine
leaf

Gene summary

leaf

Malignant transformation analysis

leaf

Malignant transformation related pathway analysis

leaf

Cell-cell communication analysis

leaf

Single-cell gene regulatory network inference analysis

leaf

Somatic mutation of malignant transformation related genes

leaf

Related drugs of malignant transformation related genes

Gene: EMC9

Gene summary for EMC9

check button Gene summary.

Gene informationSpeciesHuman
Gene symbol

EMC9

Gene ID

51016

Gene nameER membrane protein complex subunit 9
Gene AliasC14orf122
Cytomap14q12
Gene Typeprotein-coding
GO ID

GO:0006996

UniProtAcc

H0YNH6


Top

Malignant transformation analysis

check button Identification of the aberrant gene expression in precancerous and cancerous lesions by comparing the gene expression of stem-like cells in diseased tissues with normal stem cells
check button Malignant transformation involving gene list.
Entrez IDSymbolReplicatesSpeciesOrganTissueAdj P-valueLog2FCMalignancy
51016EMC9LZE2THumanEsophagusESCC3.94e-076.31e-010.082
51016EMC9LZE4THumanEsophagusESCC2.45e-092.69e-010.0811
51016EMC9LZE7THumanEsophagusESCC1.40e-083.62e-010.0667
51016EMC9LZE24THumanEsophagusESCC8.36e-164.12e-010.0596
51016EMC9LZE21THumanEsophagusESCC2.27e-114.68e-010.0655
51016EMC9LZE6THumanEsophagusESCC9.07e-083.33e-010.0845
51016EMC9P1T-EHumanEsophagusESCC1.09e-042.01e-010.0875
51016EMC9P2T-EHumanEsophagusESCC2.80e-173.10e-010.1177
51016EMC9P4T-EHumanEsophagusESCC6.31e-397.73e-010.1323
51016EMC9P5T-EHumanEsophagusESCC1.18e-295.79e-010.1327
51016EMC9P8T-EHumanEsophagusESCC4.16e-082.74e-010.0889
51016EMC9P9T-EHumanEsophagusESCC1.74e-224.47e-010.1131
51016EMC9P10T-EHumanEsophagusESCC1.42e-296.18e-010.116
51016EMC9P11T-EHumanEsophagusESCC1.78e-133.81e-010.1426
51016EMC9P12T-EHumanEsophagusESCC1.98e-448.90e-010.1122
51016EMC9P15T-EHumanEsophagusESCC1.44e-398.13e-010.1149
51016EMC9P16T-EHumanEsophagusESCC3.85e-111.66e-010.1153
51016EMC9P17T-EHumanEsophagusESCC1.45e-124.08e-010.1278
51016EMC9P19T-EHumanEsophagusESCC1.65e-104.98e-010.1662
51016EMC9P20T-EHumanEsophagusESCC3.75e-112.58e-010.1124
Page: 1 2 3 4 5 

check button Transcriptomic changes along malignancy continuum.
TissueExpression DynamicsAbbreviation
EsophagusThe image shows the transcriptomic changes along malignancy continuum.log2FC in expression of this searched gene in stem-like cells from each diseased tissue sample relative to stem-like cells in normal samples in each tissue plotted against the malignancy continuum. Samples are colored based on if they are from different disease stage.
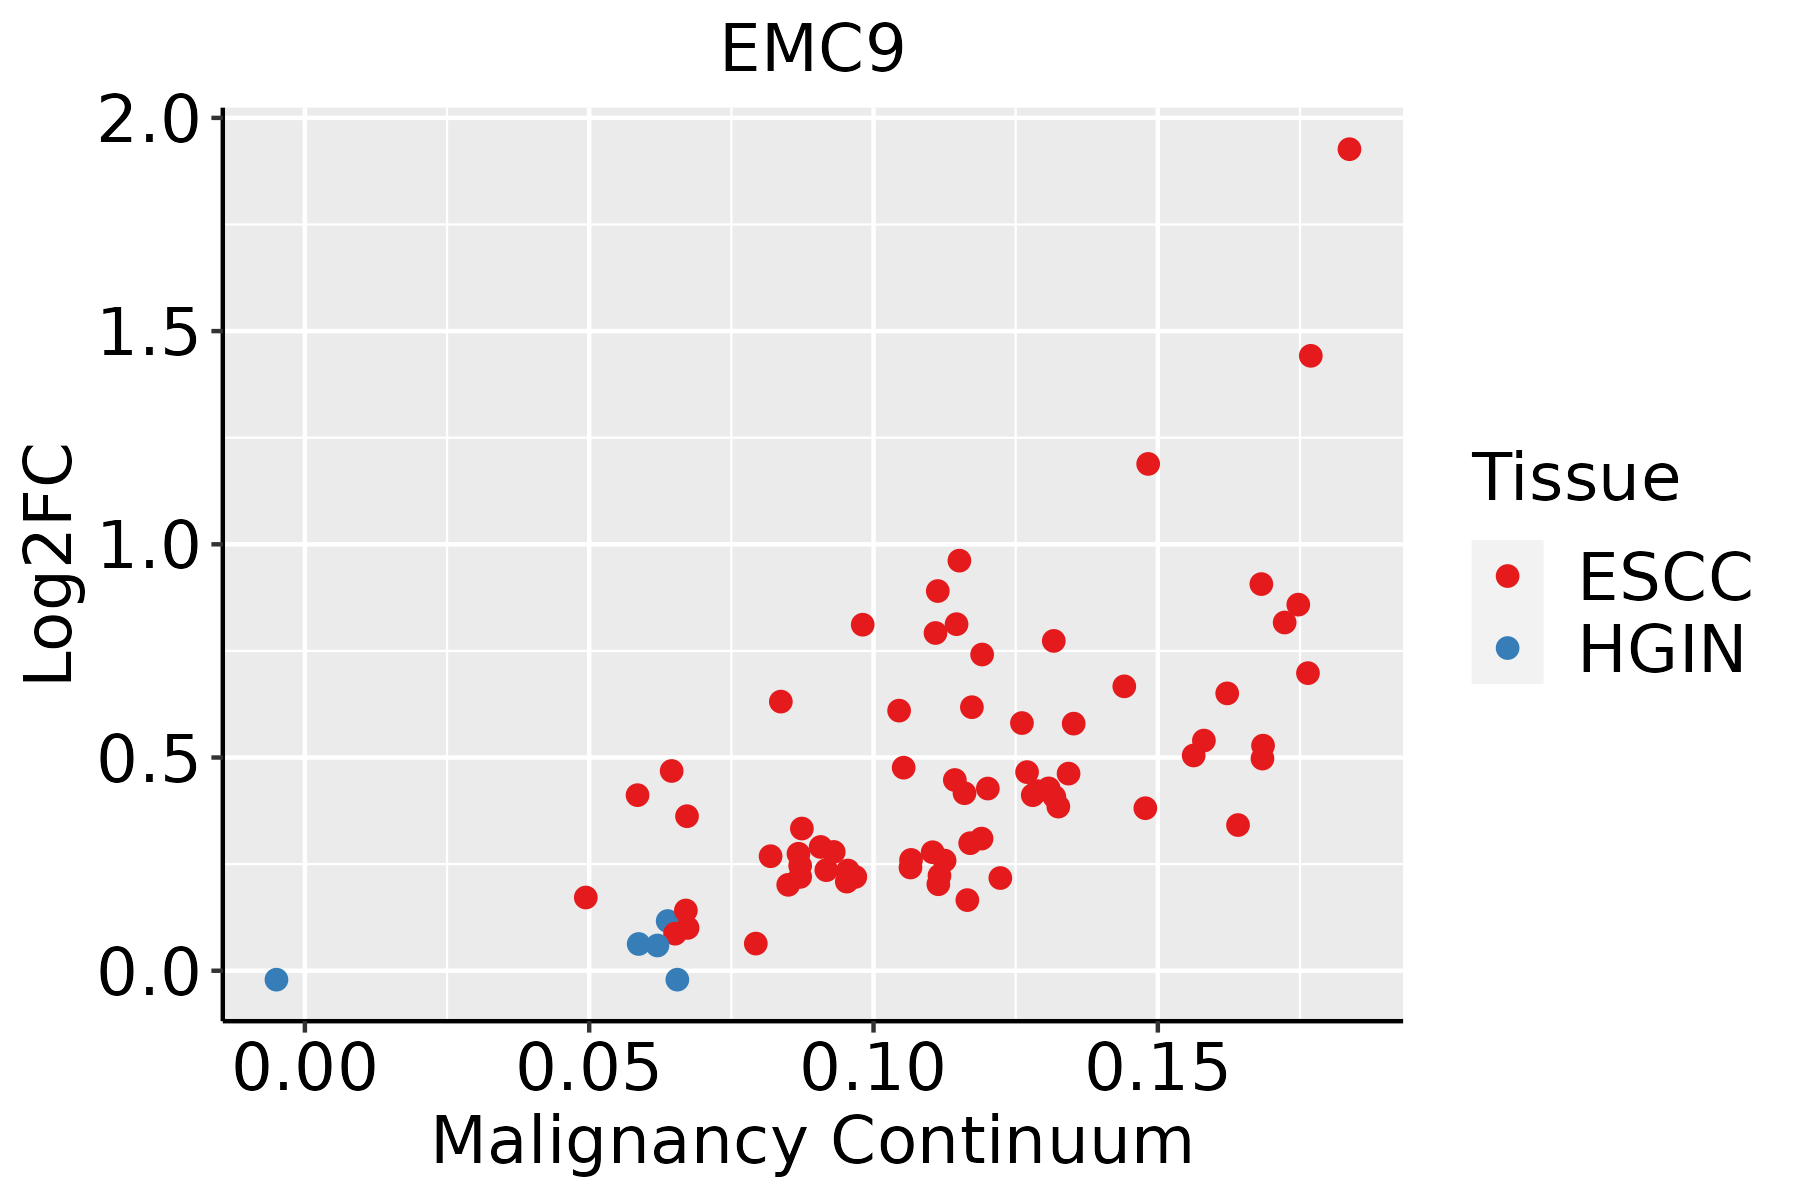
ESCC: Esophageal squamous cell carcinoma
HGIN: High-grade intraepithelial neoplasias
LGIN: Low-grade intraepithelial neoplasias
LiverThe image shows the transcriptomic changes along malignancy continuum.log2FC in expression of this searched gene in stem-like cells from each diseased tissue sample relative to stem-like cells in normal samples in each tissue plotted against the malignancy continuum. Samples are colored based on if they are from different disease stage.
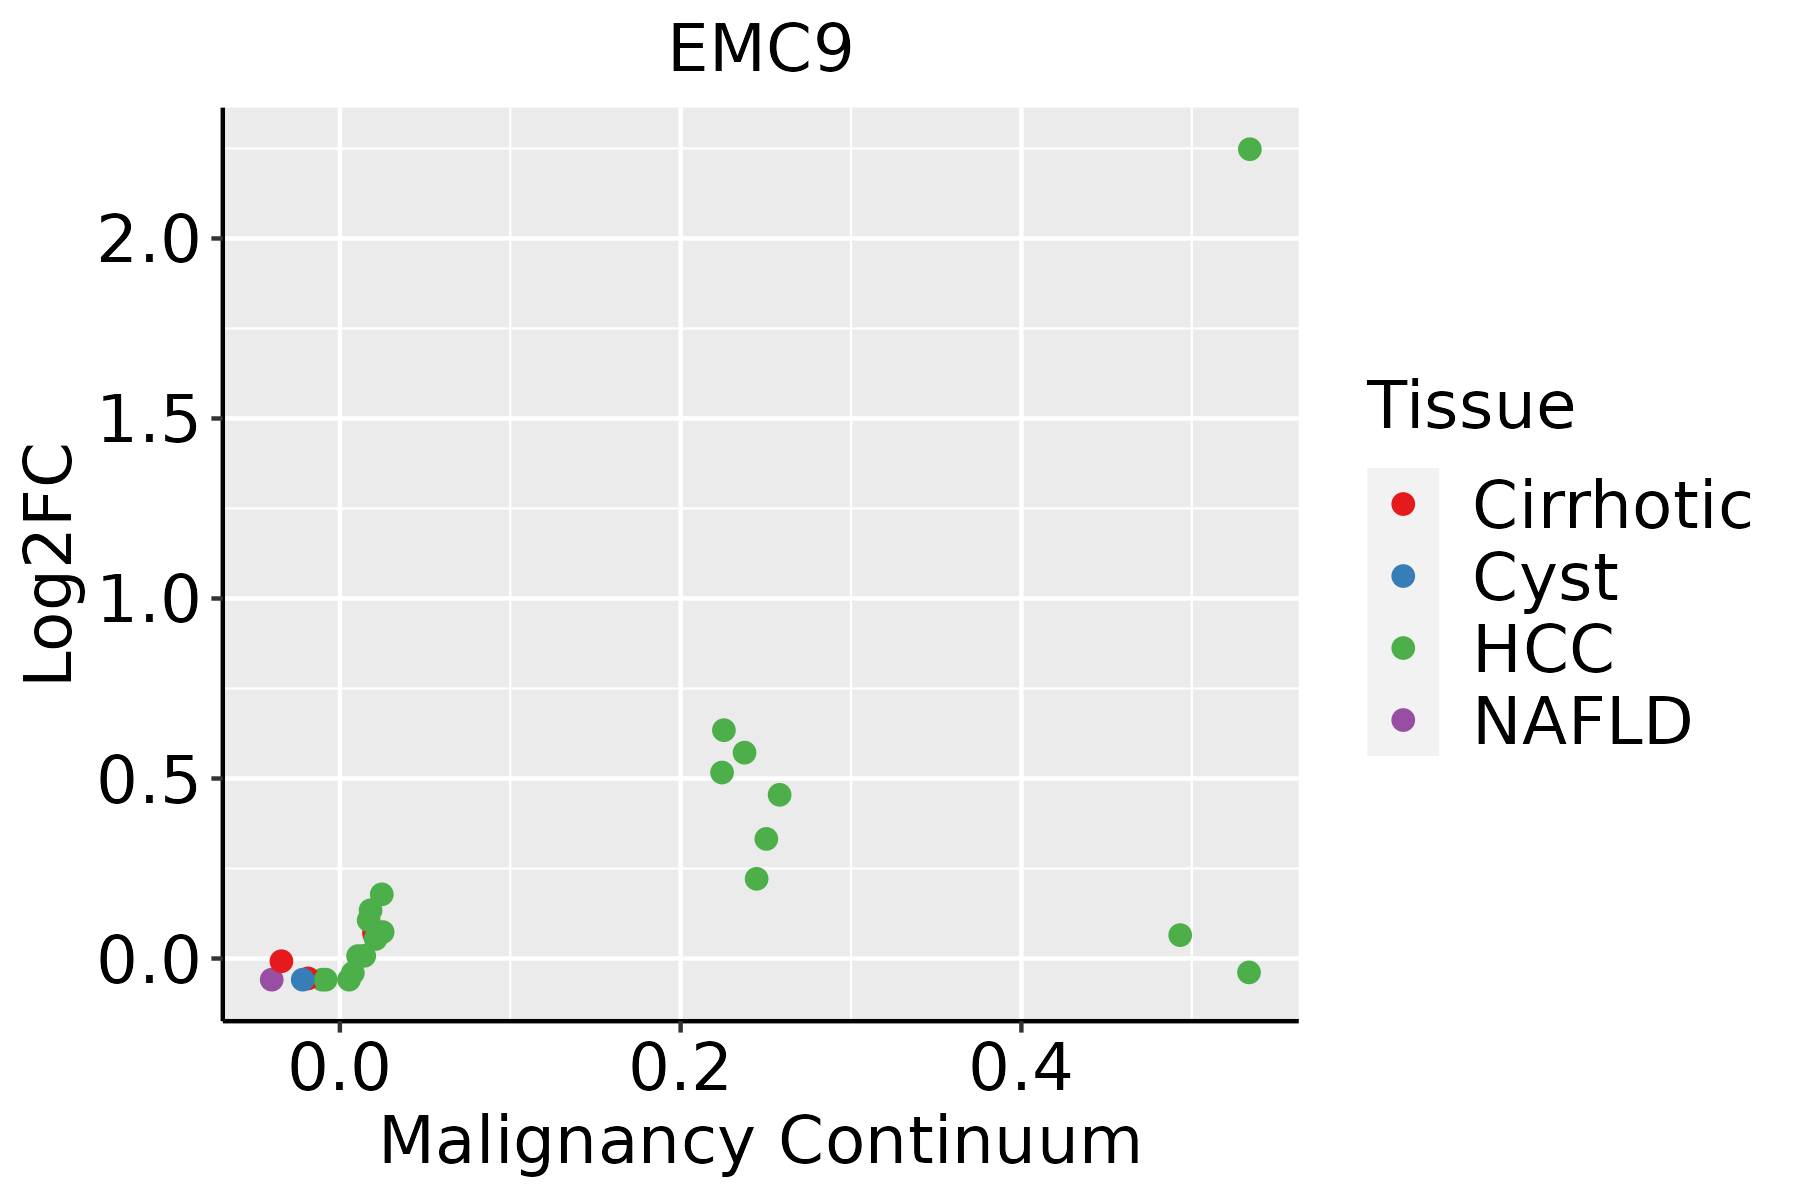
HCC: Hepatocellular carcinoma
NAFLD: Non-alcoholic fatty liver disease
Oral CavityThe image shows the transcriptomic changes along malignancy continuum.log2FC in expression of this searched gene in stem-like cells from each diseased tissue sample relative to stem-like cells in normal samples in each tissue plotted against the malignancy continuum. Samples are colored based on if they are from different disease stage.
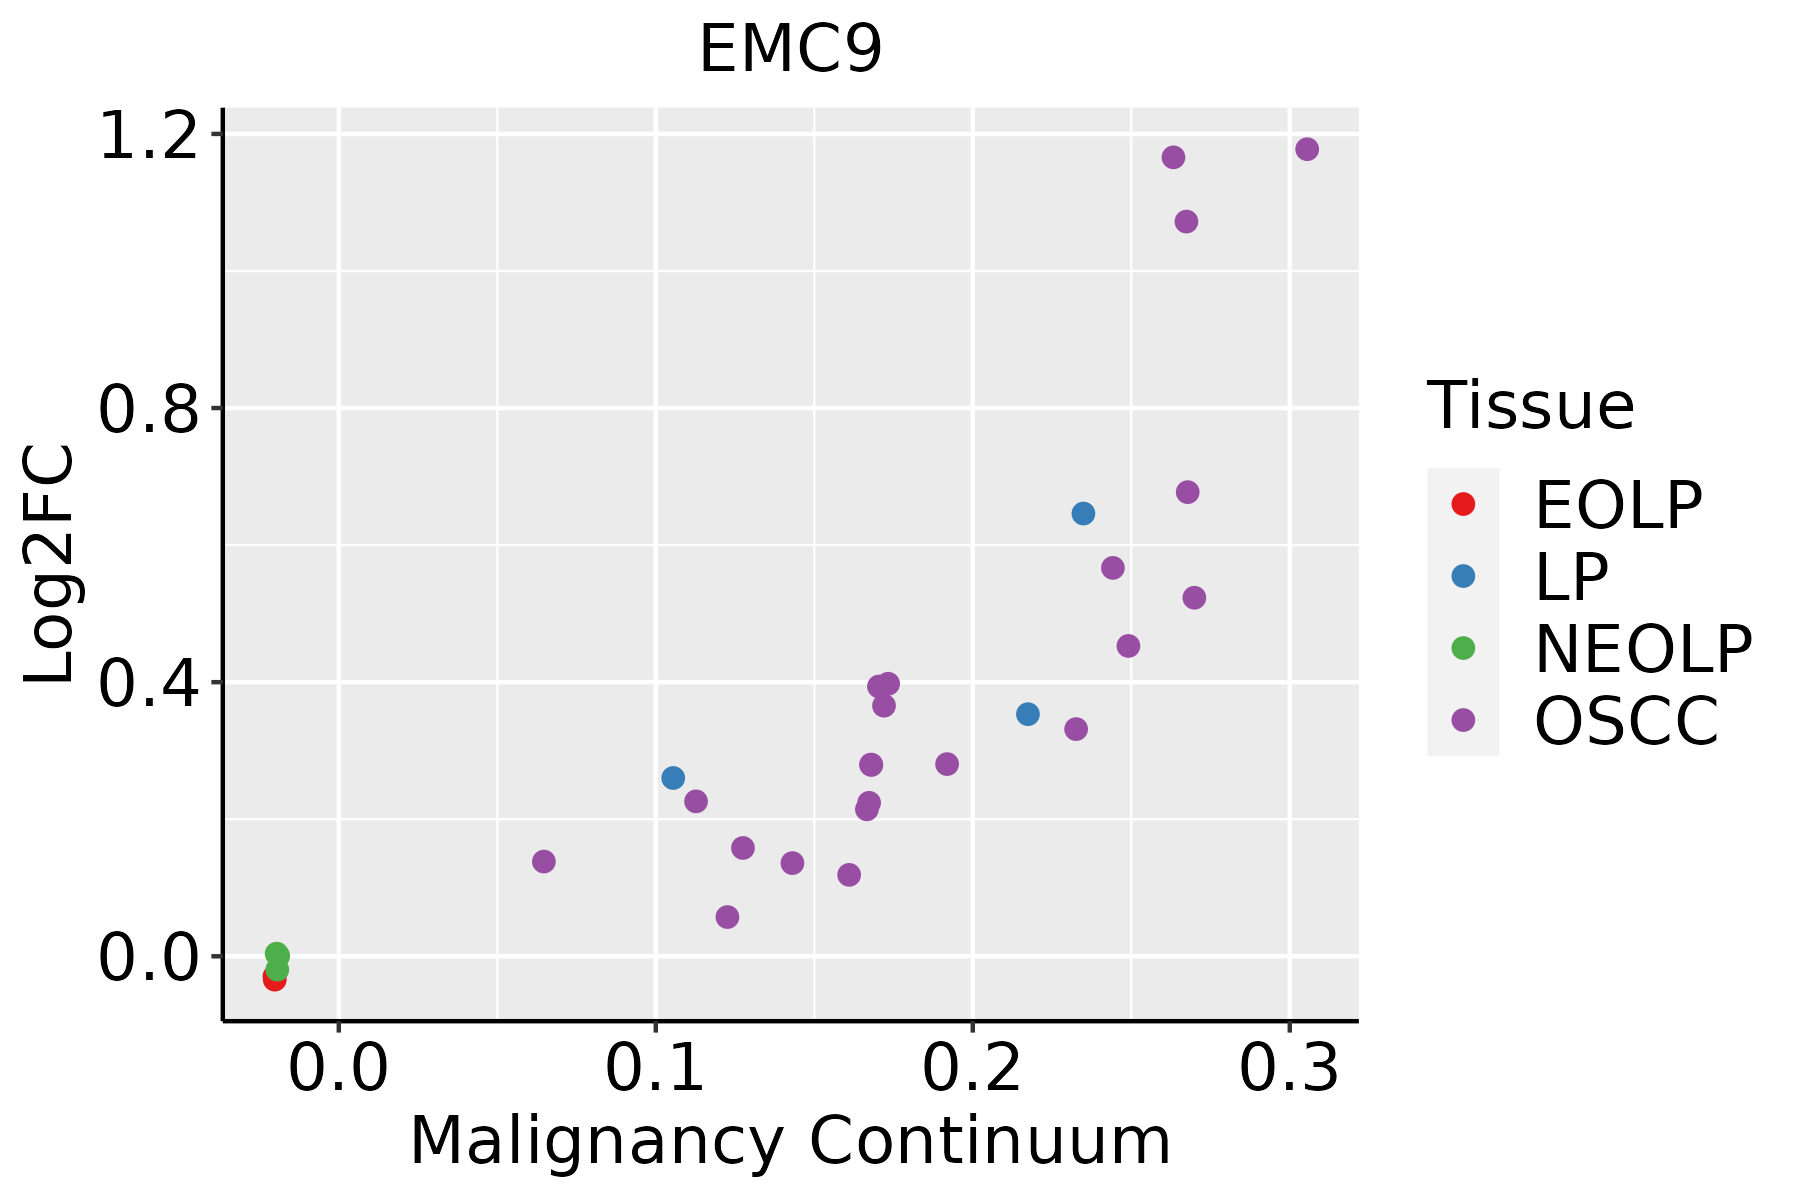
EOLP: Erosive Oral lichen planus
LP: leukoplakia
NEOLP: Non-erosive oral lichen planus
OSCC: Oral squamous cell carcinoma
SkinThe image shows the transcriptomic changes along malignancy continuum.log2FC in expression of this searched gene in stem-like cells from each diseased tissue sample relative to stem-like cells in normal samples in each tissue plotted against the malignancy continuum. Samples are colored based on if they are from different disease stage.AK: Actinic keratosis
cSCC: Cutaneous squamous cell carcinoma
SCCIS:squamous cell carcinoma in situ
∗log2FC in expression of this searched gene in stem-like cells from each diseased tissue sample relative to stem-like cells in normal samples in each tissue plotted against the malignancy continuum. Samples are colored based on if they are from different disease stage.

Top

Malignant transformation related pathway analysis

check buttonFind out the enriched GO biological processes and KEGG pathways involved in transition from healthy to precancer to cancer
check button Figure of enriched GO biological processes.
TissueDisease StageEnriched GO biological Processes
ColorectumADGO analysis - Figure of enriched GO biological processes: Top 15 enriched GO BP terms are showed in the bar plot of each disease state in each tissue. Each row represents a significant GO biological process which is colored according to the -log10(p.adjust).
ColorectumSERGO analysis - Figure of enriched GO biological processes: Top 15 enriched GO BP terms are showed in the bar plot of each disease state in each tissue. Each row represents a significant GO biological process which is colored according to the -log10(p.adjust).
ColorectumMSSGO analysis - Figure of enriched GO biological processes: Top 15 enriched GO BP terms are showed in the bar plot of each disease state in each tissue. Each row represents a significant GO biological process which is colored according to the -log10(p.adjust).
ColorectumMSI-HGO analysis - Figure of enriched GO biological processes: Top 15 enriched GO BP terms are showed in the bar plot of each disease state in each tissue. Each row represents a significant GO biological process which is colored according to the -log10(p.adjust).
ColorectumFAPGO analysis - Figure of enriched GO biological processes: Top 15 enriched GO BP terms are showed in the bar plot of each disease state in each tissue. Each row represents a significant GO biological process which is colored according to the -log10(p.adjust).
∗Top 15 enriched GO BP terms are showed in the bar plot of each disease state in each tissue. Each row represents a significant GO biological process which is colored according to the -log10(p.adjust).
Page: 1 2 3 4 5 6 7 8 9 

check button Enriched GO biological processes.
GO IDTissueDisease StageDescriptionGene RatioBg Ratiopvaluep.adjustCount
GO:0090150110EsophagusESCCestablishment of protein localization to membrane182/8552260/187231.27e-158.19e-14182
GO:000702914EsophagusESCCendoplasmic reticulum organization65/855287/187233.28e-086.08e-0765
GO:005120515EsophagusESCCprotein insertion into membrane46/855257/187235.90e-081.04e-0646
GO:004504812EsophagusESCCprotein insertion into ER membrane21/855222/187238.75e-071.13e-0521
GO:007181611EsophagusESCCtail-anchored membrane protein insertion into ER membrane17/855217/187231.63e-061.95e-0517
GO:00450503EsophagusESCCprotein insertion into ER membrane by stop-transfer membrane-anchor sequence10/855210/187233.94e-042.26e-0310
GO:009015012LiverHCCestablishment of protein localization to membrane168/7958260/187234.07e-132.13e-11168
GO:000702911LiverHCCendoplasmic reticulum organization64/795887/187233.92e-091.04e-0764
GO:005120511LiverHCCprotein insertion into membrane41/795857/187236.42e-067.83e-0541
GO:0071816LiverHCCtail-anchored membrane protein insertion into ER membrane15/795817/187231.31e-041.07e-0315
GO:00450481LiverHCCprotein insertion into ER membrane18/795822/187231.91e-041.49e-0318
GO:0045050LiverHCCprotein insertion into ER membrane by stop-transfer membrane-anchor sequence10/795810/187231.92e-041.49e-0310
GO:009015018Oral cavityOSCCestablishment of protein localization to membrane163/7305260/187237.13e-154.47e-13163
GO:00070294Oral cavityOSCCendoplasmic reticulum organization58/730587/187231.59e-072.61e-0658
GO:00512056Oral cavityOSCCprotein insertion into membrane40/730557/187231.81e-062.34e-0540
GO:00450502Oral cavityOSCCprotein insertion into ER membrane by stop-transfer membrane-anchor sequence10/730510/187238.14e-056.26e-0410
GO:00450482Oral cavityOSCCprotein insertion into ER membrane17/730522/187232.99e-041.87e-0317
GO:00718162Oral cavityOSCCtail-anchored membrane protein insertion into ER membrane14/730517/187233.31e-042.04e-0314
GO:009015024SkincSCCestablishment of protein localization to membrane123/4864260/187238.34e-145.18e-12123
GO:00512058SkincSCCprotein insertion into membrane34/486457/187238.07e-081.96e-0634
Page: 1 2 

check button Enriched KEGG pathways.
Pathway IDTissueDisease StageDescriptionGene RatioBg Ratiopvaluep.adjustqvalueCount
Page: 1 

Top

Cell-cell communication analysis

check buttonIdentification of potential cell-cell interactions between two cell types and their ligand-receptor pairs for different disease states
LigandReceptorLRpairPathwayTissueDisease Stage
Page: 1 

Top

Single-cell gene regulatory network inference analysis

check buttonFind out the significant the regulons (TFs) and the target genes of each regulon across cell types for different disease states
TFCell TypeTissueDisease StageTarget GeneRSSRegulon Activity
∗The dot plots of a searched regulon are shown for all cell subpopulations in each disease state of each tissue based on the regulon specific score inferred using pySCENIC and by calculating the average expression.
Page: 1 

Top

Somatic mutation of malignant transformation related genes

check buttonAnnotation of somatic variants for genes involved in malignant transformation
Hugo SymbolVariant ClassVariant ClassificationdbSNP RSHGVScHGVSpHGVSp ShortSWISSPROTBIOTYPESIFTPolyPhenTumor Sample BarcodeTissueHistologySexAgeStageTherapy TypesDrugsOutcome
EMC9SNVMissense_Mutationc.39N>Cp.Lys13Asnp.K13NQ9Y3B6protein_codingdeleterious(0)probably_damaging(0.999)TCGA-AC-A23H-01Breastbreast invasive carcinomaFemale>=65I/IIUnknownUnknownPD
EMC9SNVMissense_Mutationnovelc.393N>Gp.Ile131Metp.I131MQ9Y3B6protein_codingtolerated(0.22)probably_damaging(0.982)TCGA-BH-A0E2-01Breastbreast invasive carcinomaFemale<65III/IVChemotherapydoxorubicinSD
EMC9SNVMissense_Mutationc.271N>Gp.Gln91Glup.Q91EQ9Y3B6protein_codingtolerated(0.7)benign(0.062)TCGA-D8-A1XQ-01Breastbreast invasive carcinomaFemale>=65I/IIUnknownUnknownSD
EMC9insertionNonsense_Mutationnovelc.466_467insGTCCACATCCCCTGGTGGCTCTTGCACCACCGTAGCAGAGCCp.Ser156delinsCysProHisProLeuValAlaLeuAlaProProTerGlnSerProp.S156delinsCPHPLVALAPP*QSPQ9Y3B6protein_codingTCGA-A2-A0CP-01Breastbreast invasive carcinomaFemale<65I/IIChemotherapycytoxanSD
EMC9insertionFrame_Shift_Insnovelc.126_127insAACCAGCGGCTCAACACTCAAATCACCCAGTGGGTTGGTCCCAp.Leu43AsnfsTer82p.L43Nfs*82Q9Y3B6protein_codingTCGA-AN-A03X-01Breastbreast invasive carcinomaFemale>=65I/IIUnknownUnknownSD
EMC9insertionNonsense_Mutationnovelc.394_395insGTTGGTCCCACTAATGGAAp.Val132GlyfsTer5p.V132Gfs*5Q9Y3B6protein_codingTCGA-BH-A0E2-01Breastbreast invasive carcinomaFemale<65III/IVChemotherapydoxorubicinSD
EMC9SNVMissense_Mutationc.454N>Ap.Asp152Asnp.D152NQ9Y3B6protein_codingtolerated(0.07)benign(0.003)TCGA-C5-A1M6-01Cervixcervical & endocervical cancerFemale<65I/IIChemotherapycisplatinPD
EMC9SNVMissense_Mutationc.121N>Ap.Leu41Metp.L41MQ9Y3B6protein_codingdeleterious(0.04)probably_damaging(0.925)TCGA-D5-6928-01Colorectumcolon adenocarcinomaMale>=65I/IIUnknownUnknownSD
EMC9SNVMissense_Mutationc.566N>Tp.Gln189Leup.Q189LQ9Y3B6protein_codingtolerated(0.1)possibly_damaging(0.673)TCGA-G5-6233-01Colorectumrectum adenocarcinomaMale>=65III/IVChemotherapy5-fluorouracilPD
EMC9SNVMissense_Mutationrs779202856c.499N>Tp.Arg167Trpp.R167WQ9Y3B6protein_codingdeleterious(0)possibly_damaging(0.636)TCGA-AP-A0LM-01Endometriumuterine corpus endometrioid carcinomaFemale<65III/IVChemotherapycisplatinSD
Page: 1 2 

Top

Related drugs of malignant transformation related genes

check buttonIdentification of chemicals and drugs interact with genes involved in malignant transfromation
(DGIdb 4.0)
Entrez IDSymbolCategoryInteraction TypesDrug Claim NameDrug NamePMIDs
Page: 1