
|
|||||
|
 | |
| |
| |
| |
| |
| |
|
Gene: EMC6 |
Gene summary for EMC6 |
| Gene information | Species | Human | Gene symbol | EMC6 | Gene ID | 83460 |
| Gene name | ER membrane protein complex subunit 6 | |
| Gene Alias | RAB5IFL | |
| Cytomap | 17p13.2 | |
| Gene Type | protein-coding | GO ID | GO:0000045 | UniProtAcc | Q9BV81 |
Top |
Malignant transformation analysis |
| Identification of the aberrant gene expression in precancerous and cancerous lesions by comparing the gene expression of stem-like cells in diseased tissues with normal stem cells |
| Entrez ID | Symbol | Replicates | Species | Organ | Tissue | Adj P-value | Log2FC | Malignancy |
| 83460 | EMC6 | HTA11_3410_2000001011 | Human | Colorectum | AD | 2.62e-02 | 1.35e-01 | 0.0155 |
| 83460 | EMC6 | HTA11_2487_2000001011 | Human | Colorectum | SER | 1.08e-06 | 3.37e-01 | -0.1808 |
| 83460 | EMC6 | HTA11_1938_2000001011 | Human | Colorectum | AD | 9.82e-09 | 3.73e-01 | -0.0811 |
| 83460 | EMC6 | HTA11_78_2000001011 | Human | Colorectum | AD | 4.32e-02 | 1.49e-01 | -0.1088 |
| 83460 | EMC6 | HTA11_347_2000001011 | Human | Colorectum | AD | 6.17e-15 | 3.85e-01 | -0.1954 |
| 83460 | EMC6 | HTA11_411_2000001011 | Human | Colorectum | SER | 2.97e-04 | 4.19e-01 | -0.2602 |
| 83460 | EMC6 | HTA11_2112_2000001011 | Human | Colorectum | SER | 5.40e-04 | 5.91e-01 | -0.2196 |
| 83460 | EMC6 | HTA11_3361_2000001011 | Human | Colorectum | AD | 1.55e-05 | 2.49e-01 | -0.1207 |
| 83460 | EMC6 | HTA11_83_2000001011 | Human | Colorectum | SER | 6.21e-04 | 2.91e-01 | -0.1526 |
| 83460 | EMC6 | HTA11_696_2000001011 | Human | Colorectum | AD | 7.63e-19 | 3.36e-01 | -0.1464 |
| 83460 | EMC6 | HTA11_866_2000001011 | Human | Colorectum | AD | 1.61e-06 | 2.02e-01 | -0.1001 |
| 83460 | EMC6 | HTA11_1391_2000001011 | Human | Colorectum | AD | 5.06e-19 | 6.43e-01 | -0.059 |
| 83460 | EMC6 | HTA11_2992_2000001011 | Human | Colorectum | SER | 1.39e-02 | 4.87e-01 | -0.1706 |
| 83460 | EMC6 | HTA11_546_2000001011 | Human | Colorectum | AD | 4.39e-03 | 2.56e-01 | -0.0842 |
| 83460 | EMC6 | HTA11_7862_2000001011 | Human | Colorectum | AD | 4.76e-06 | 3.86e-01 | -0.0179 |
| 83460 | EMC6 | HTA11_866_3004761011 | Human | Colorectum | AD | 1.05e-12 | 4.01e-01 | 0.096 |
| 83460 | EMC6 | HTA11_4255_2000001011 | Human | Colorectum | SER | 4.91e-03 | 3.96e-01 | 0.0446 |
| 83460 | EMC6 | HTA11_8622_2000001021 | Human | Colorectum | SER | 1.15e-05 | 4.56e-01 | 0.0528 |
| 83460 | EMC6 | HTA11_10711_2000001011 | Human | Colorectum | AD | 7.98e-04 | 2.02e-01 | 0.0338 |
| 83460 | EMC6 | HTA11_7696_3000711011 | Human | Colorectum | AD | 5.43e-16 | 3.29e-01 | 0.0674 |
| Page: 1 2 3 4 5 6 7 8 9 |
| Tissue | Expression Dynamics | Abbreviation |
| Colorectum (GSE201348) |  | FAP: Familial adenomatous polyposis |
| CRC: Colorectal cancer | ||
| Colorectum (HTA11) |  | AD: Adenomas |
| SER: Sessile serrated lesions | ||
| MSI-H: Microsatellite-high colorectal cancer | ||
| MSS: Microsatellite stable colorectal cancer | ||
| Esophagus | 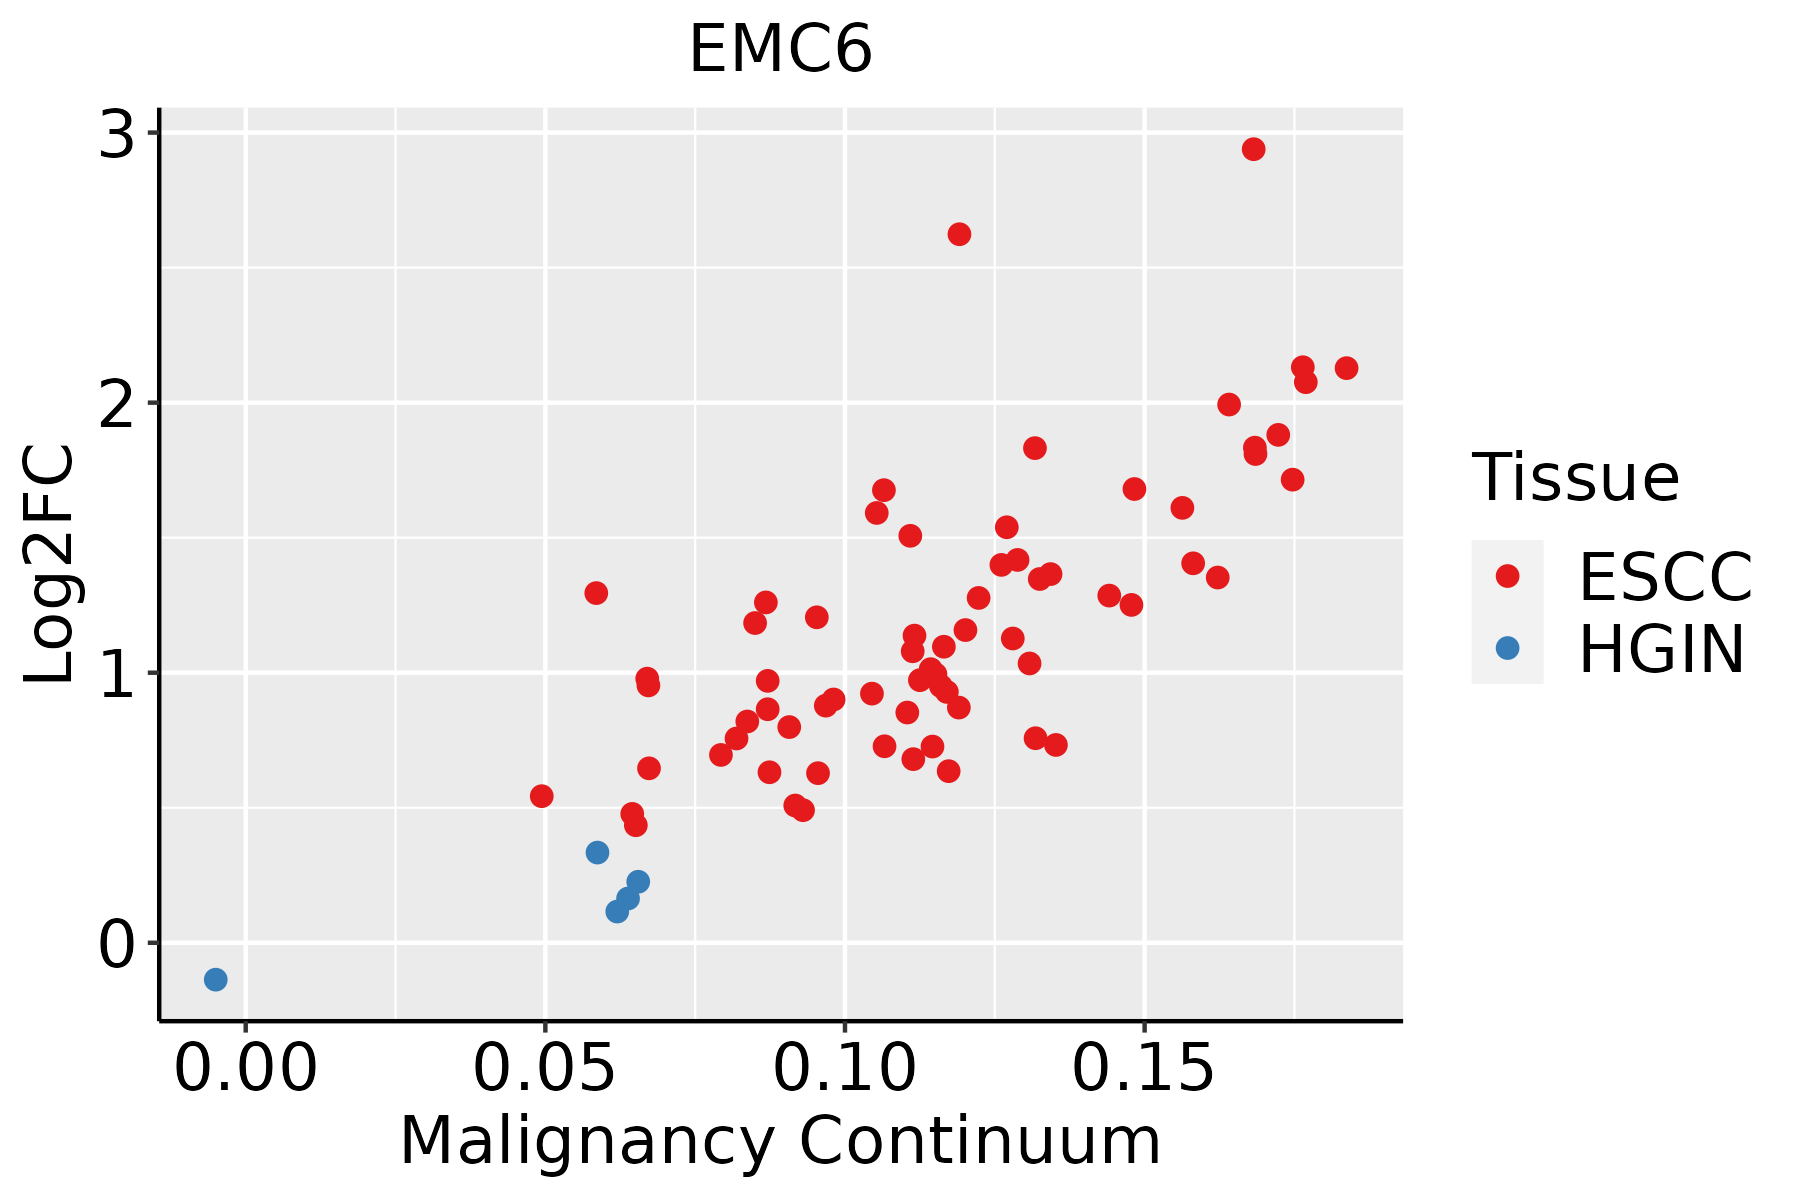 | ESCC: Esophageal squamous cell carcinoma |
| HGIN: High-grade intraepithelial neoplasias | ||
| LGIN: Low-grade intraepithelial neoplasias | ||
| Liver | 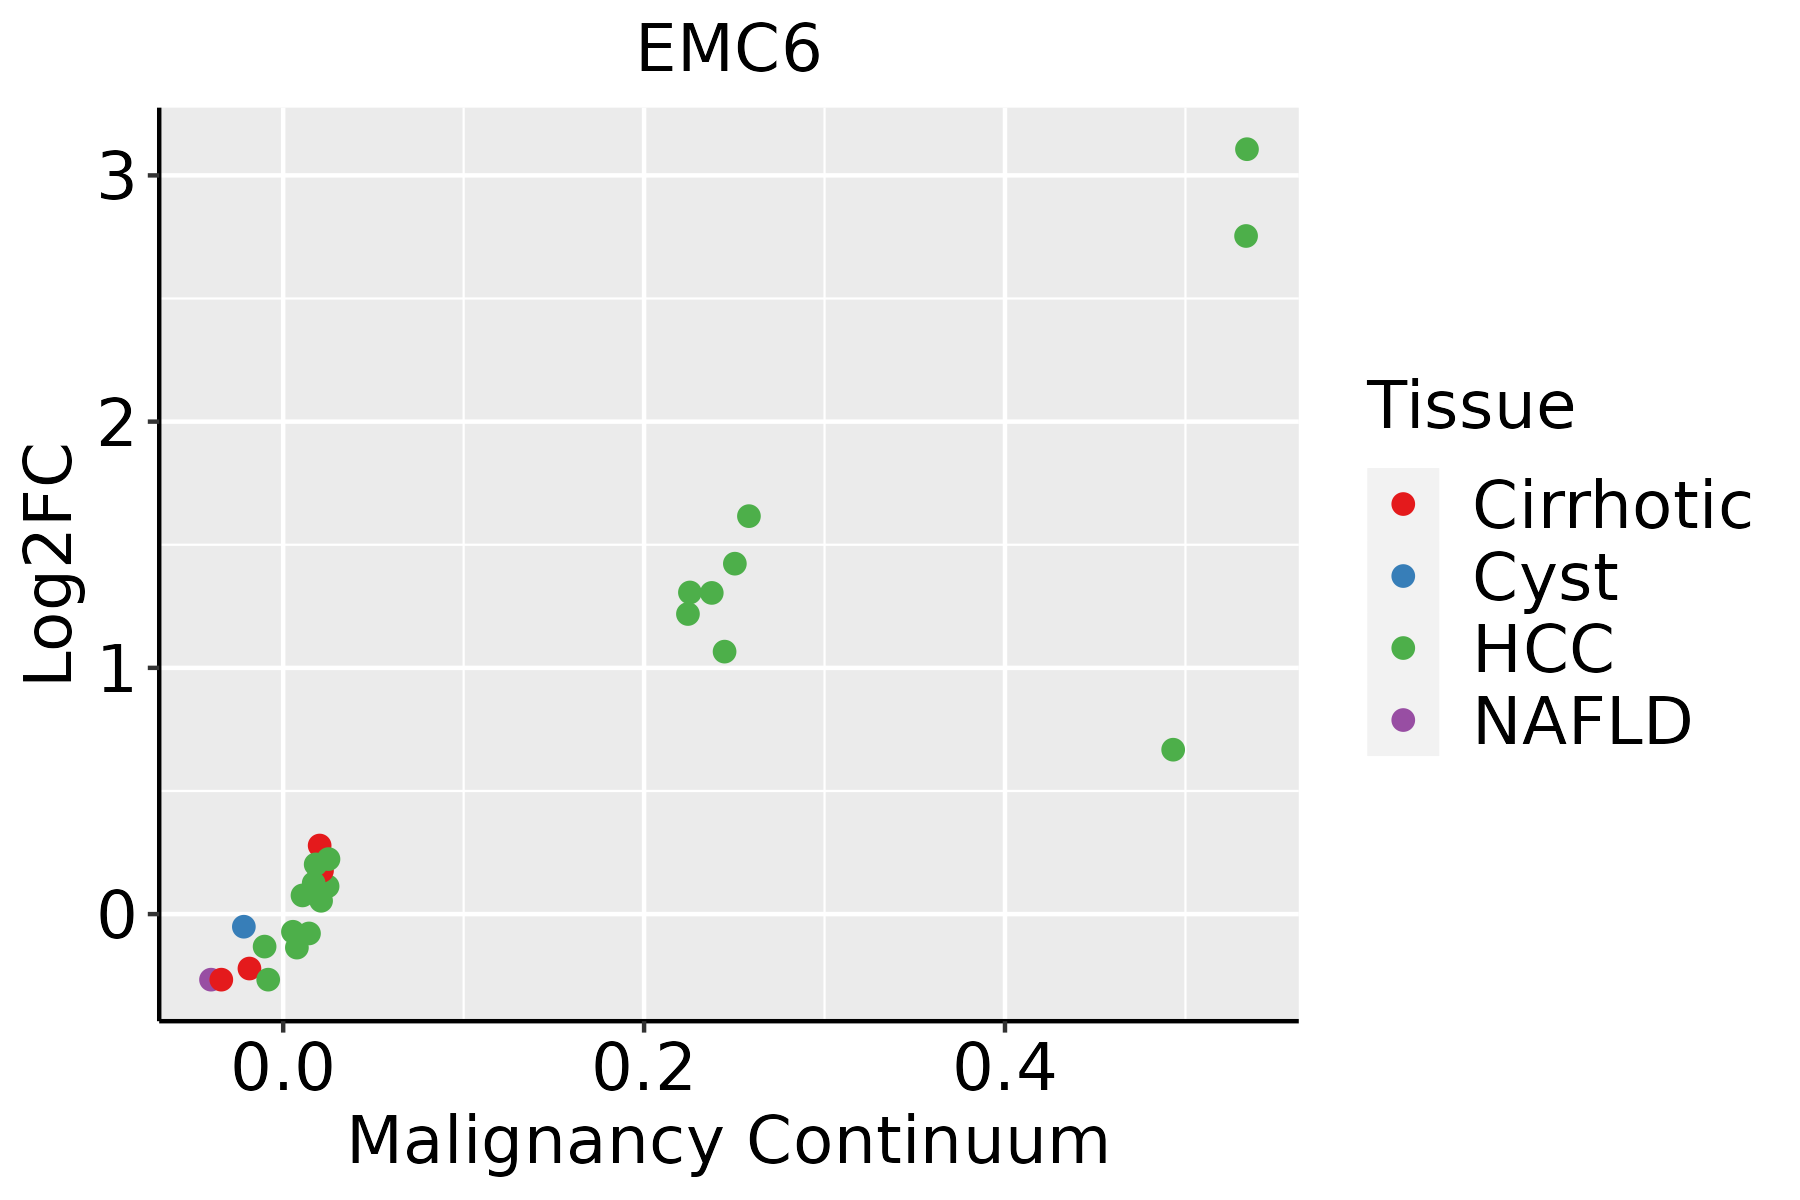 | HCC: Hepatocellular carcinoma |
| NAFLD: Non-alcoholic fatty liver disease | ||
| Oral Cavity |  | EOLP: Erosive Oral lichen planus |
| LP: leukoplakia | ||
| NEOLP: Non-erosive oral lichen planus | ||
| OSCC: Oral squamous cell carcinoma | ||
| Prostate | 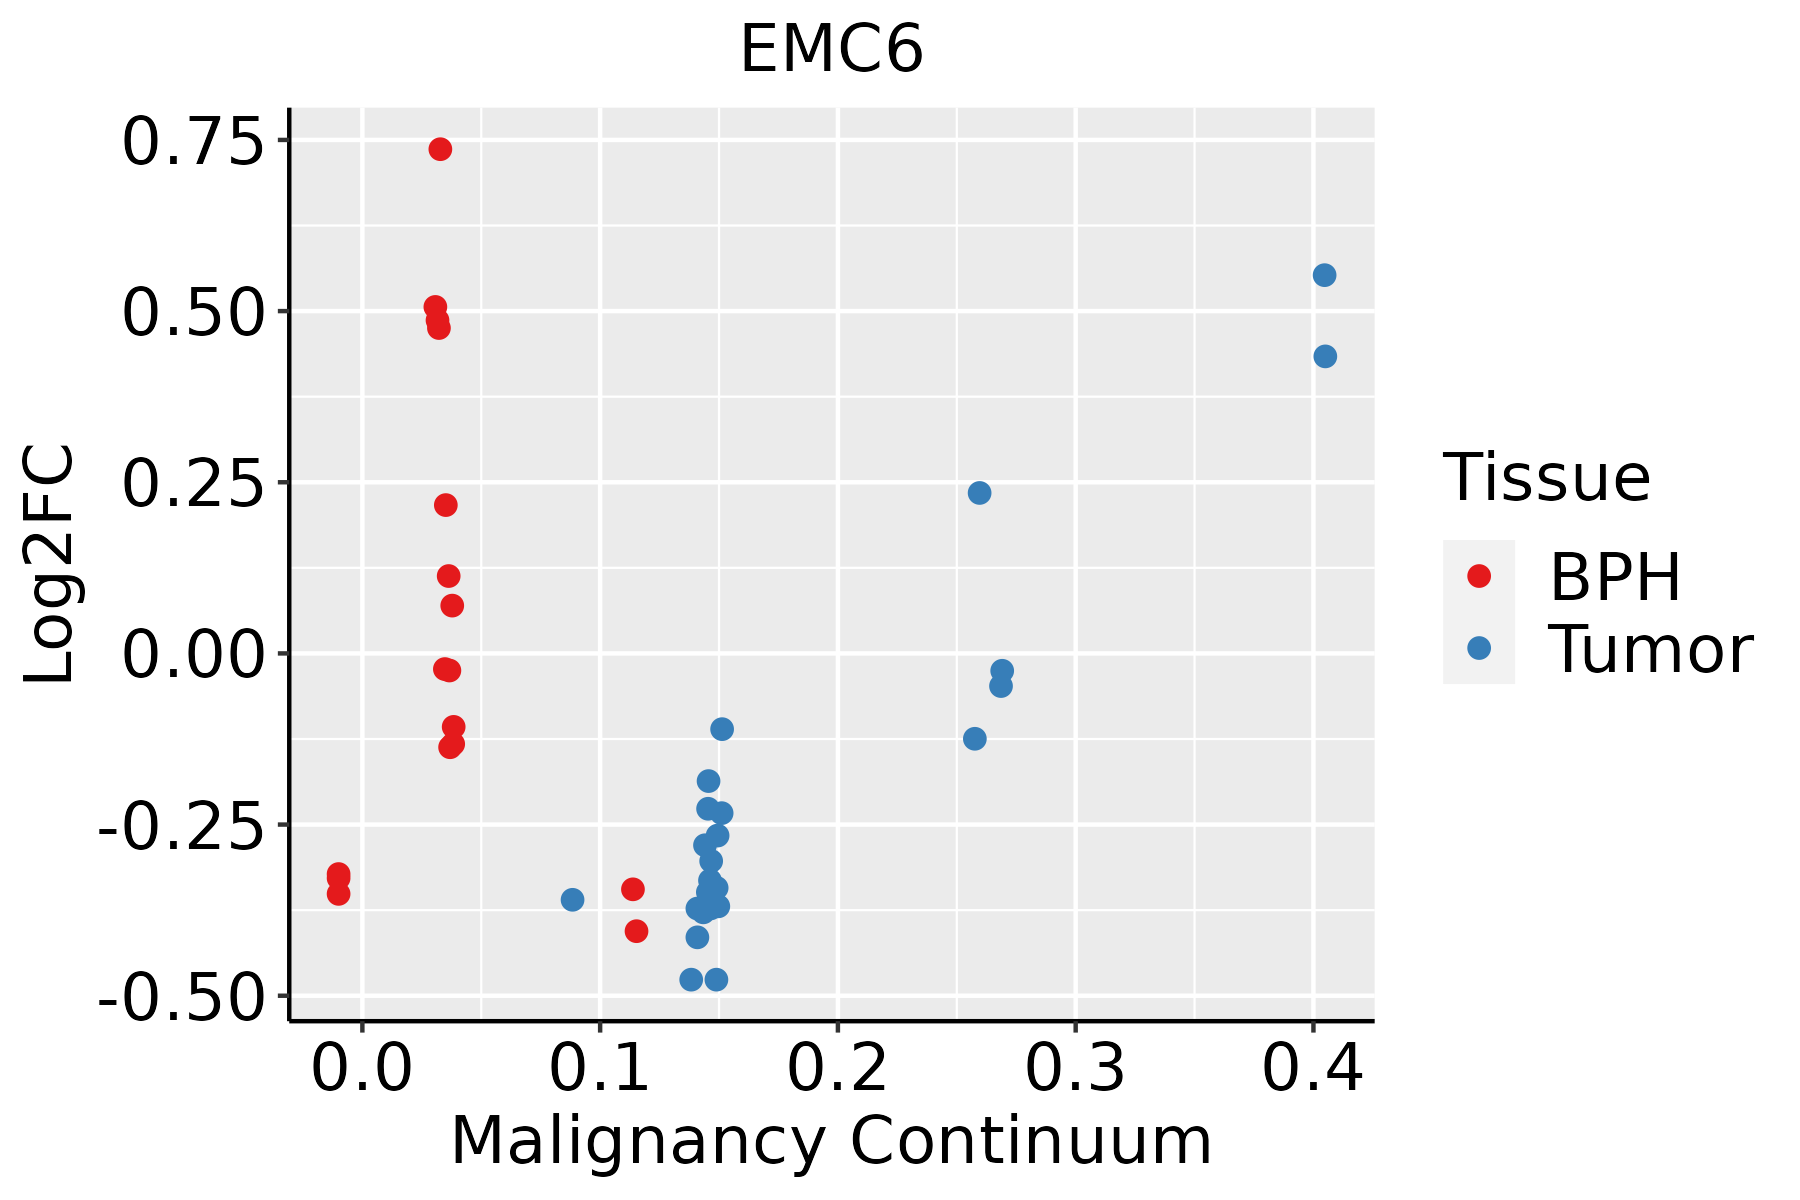 | BPH: Benign Prostatic Hyperplasia |
| Skin | 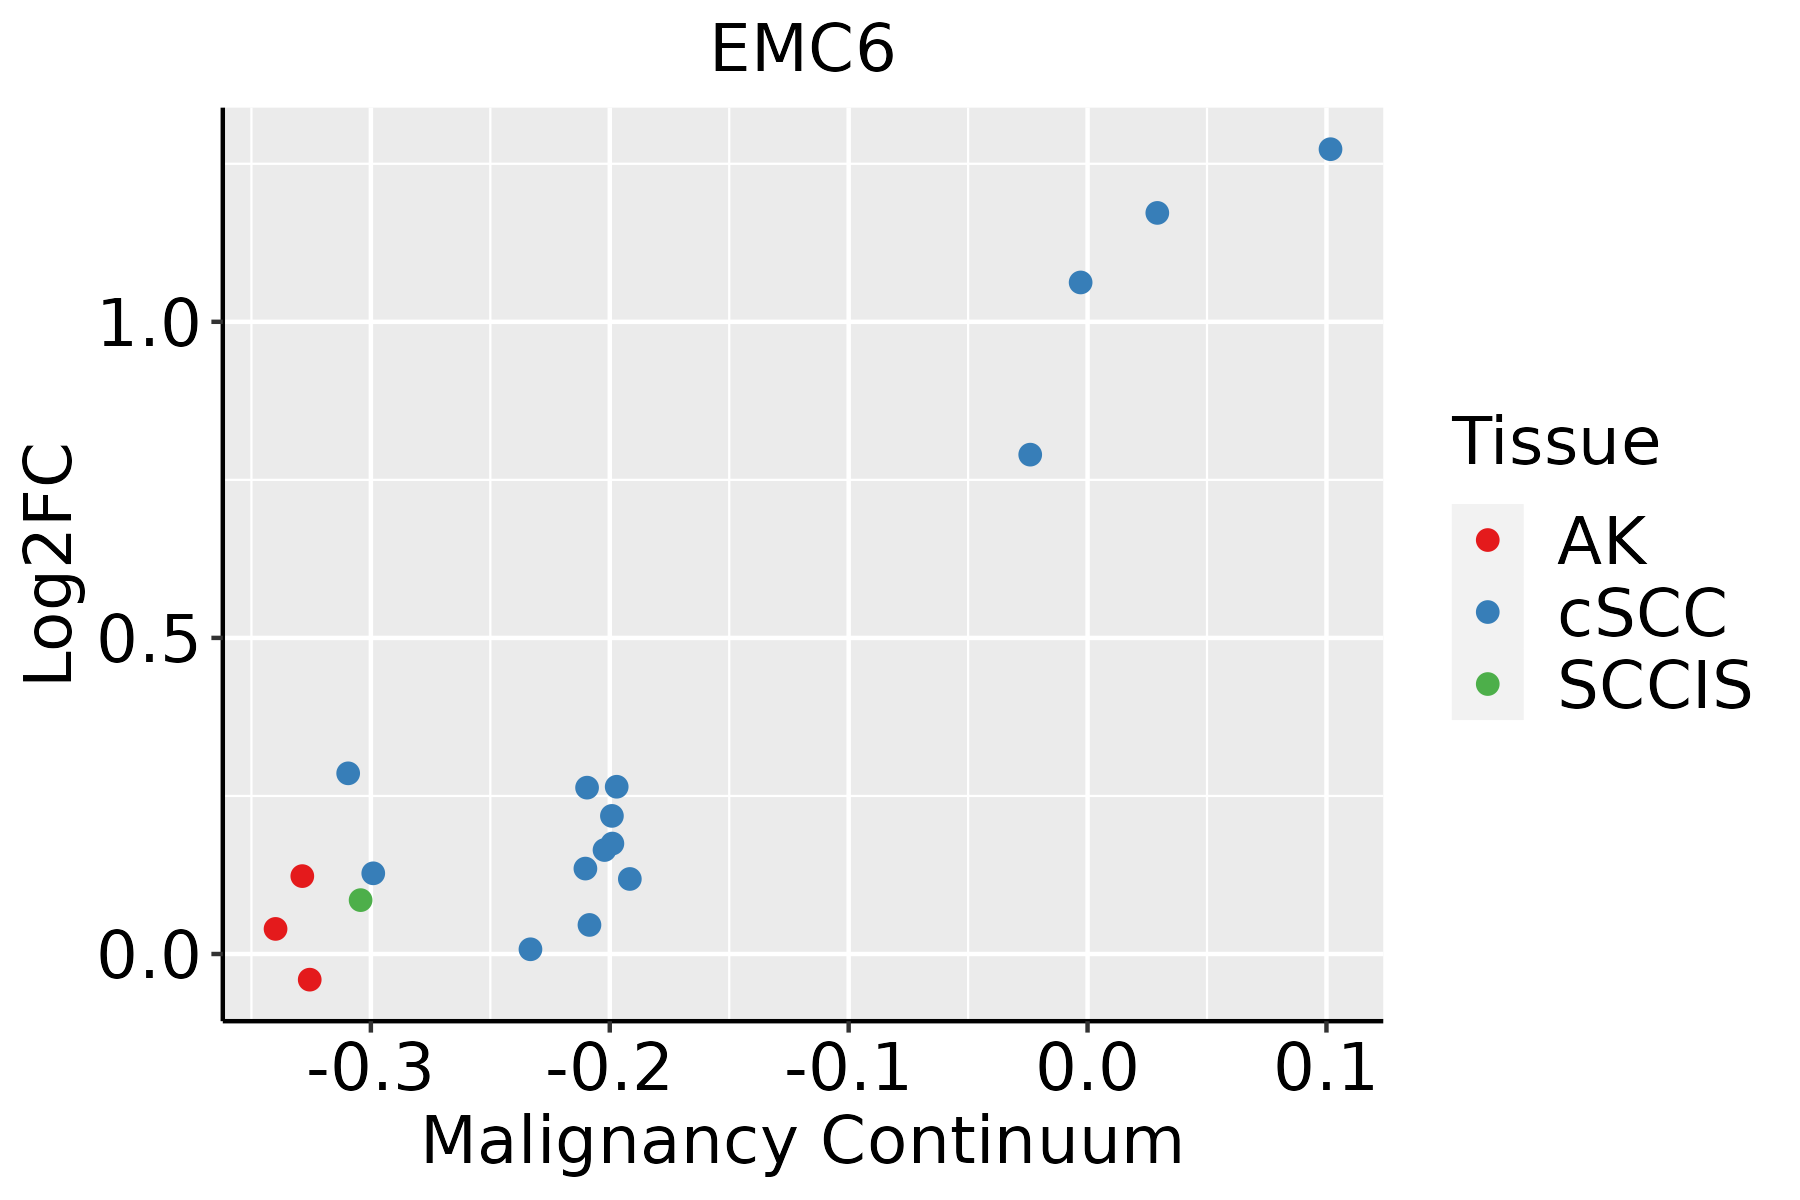 | AK: Actinic keratosis |
| cSCC: Cutaneous squamous cell carcinoma | ||
| SCCIS:squamous cell carcinoma in situ | ||
| Thyroid |  | ATC: Anaplastic thyroid cancer |
| HT: Hashimoto's thyroiditis | ||
| PTC: Papillary thyroid cancer |
| ∗log2FC in expression of this searched gene in stem-like cells from each diseased tissue sample relative to stem-like cells in normal samples in each tissue plotted against the malignancy continuum. Samples are colored based on if they are from different disease stage. |
Top |
Malignant transformation related pathway analysis |
| Find out the enriched GO biological processes and KEGG pathways involved in transition from healthy to precancer to cancer |
| Tissue | Disease Stage | Enriched GO biological Processes |
| Colorectum | AD |  |
| Colorectum | SER |  |
| Colorectum | MSS |  |
| Colorectum | MSI-H |  |
| Colorectum | FAP |  |
| ∗Top 15 enriched GO BP terms are showed in the bar plot of each disease state in each tissue. Each row represents a significant GO biological process which is colored according to the -log10(p.adjust). |
| Page: 1 2 3 4 5 6 7 8 9 |
| GO ID | Tissue | Disease Stage | Description | Gene Ratio | Bg Ratio | pvalue | p.adjust | Count |
| GO:0090150 | Colorectum | AD | establishment of protein localization to membrane | 100/3918 | 260/18723 | 6.01e-11 | 6.33e-09 | 100 |
| GO:0016236 | Colorectum | AD | macroautophagy | 103/3918 | 291/18723 | 6.76e-09 | 4.15e-07 | 103 |
| GO:0051205 | Colorectum | AD | protein insertion into membrane | 23/3918 | 57/18723 | 6.62e-04 | 6.80e-03 | 23 |
| GO:0007029 | Colorectum | AD | endoplasmic reticulum organization | 31/3918 | 87/18723 | 1.08e-03 | 1.00e-02 | 31 |
| GO:0007033 | Colorectum | AD | vacuole organization | 53/3918 | 180/18723 | 4.18e-03 | 2.89e-02 | 53 |
| GO:00162361 | Colorectum | SER | macroautophagy | 79/2897 | 291/18723 | 1.97e-07 | 1.10e-05 | 79 |
| GO:00901501 | Colorectum | SER | establishment of protein localization to membrane | 68/2897 | 260/18723 | 5.55e-06 | 2.01e-04 | 68 |
| GO:00512051 | Colorectum | SER | protein insertion into membrane | 19/2897 | 57/18723 | 6.32e-04 | 8.58e-03 | 19 |
| GO:00070291 | Colorectum | SER | endoplasmic reticulum organization | 23/2897 | 87/18723 | 5.77e-03 | 4.23e-02 | 23 |
| GO:00901502 | Colorectum | MSS | establishment of protein localization to membrane | 90/3467 | 260/18723 | 4.11e-10 | 3.49e-08 | 90 |
| GO:00162362 | Colorectum | MSS | macroautophagy | 93/3467 | 291/18723 | 2.08e-08 | 1.17e-06 | 93 |
| GO:00512052 | Colorectum | MSS | protein insertion into membrane | 21/3467 | 57/18723 | 8.53e-04 | 8.75e-03 | 21 |
| GO:00070331 | Colorectum | MSS | vacuole organization | 48/3467 | 180/18723 | 4.32e-03 | 3.07e-02 | 48 |
| GO:001623616 | Esophagus | HGIN | macroautophagy | 77/2587 | 291/18723 | 7.15e-09 | 4.61e-07 | 77 |
| GO:009015020 | Esophagus | HGIN | establishment of protein localization to membrane | 67/2587 | 260/18723 | 1.96e-07 | 9.57e-06 | 67 |
| GO:00512057 | Esophagus | HGIN | protein insertion into membrane | 21/2587 | 57/18723 | 1.16e-05 | 3.29e-04 | 21 |
| GO:00070336 | Esophagus | HGIN | vacuole organization | 44/2587 | 180/18723 | 8.97e-05 | 1.96e-03 | 44 |
| GO:19050375 | Esophagus | HGIN | autophagosome organization | 28/2587 | 103/18723 | 2.58e-04 | 4.53e-03 | 28 |
| GO:00450483 | Esophagus | HGIN | protein insertion into ER membrane | 10/2587 | 22/18723 | 3.28e-04 | 5.46e-03 | 10 |
| GO:00000455 | Esophagus | HGIN | autophagosome assembly | 26/2587 | 99/18723 | 7.45e-04 | 9.90e-03 | 26 |
| Page: 1 2 3 4 5 6 |
| Pathway ID | Tissue | Disease Stage | Description | Gene Ratio | Bg Ratio | pvalue | p.adjust | qvalue | Count |
| Page: 1 |
Top |
Cell-cell communication analysis |
| Identification of potential cell-cell interactions between two cell types and their ligand-receptor pairs for different disease states |
| Ligand | Receptor | LRpair | Pathway | Tissue | Disease Stage |
| Page: 1 |
Top |
Single-cell gene regulatory network inference analysis |
| Find out the significant the regulons (TFs) and the target genes of each regulon across cell types for different disease states |
| TF | Cell Type | Tissue | Disease Stage | Target Gene | RSS | Regulon Activity |
| ∗The dot plots of a searched regulon are shown for all cell subpopulations in each disease state of each tissue based on the regulon specific score inferred using pySCENIC and by calculating the average expression. |
| Page: 1 |
Top |
Somatic mutation of malignant transformation related genes |
| Annotation of somatic variants for genes involved in malignant transformation |
| Hugo Symbol | Variant Class | Variant Classification | dbSNP RS | HGVSc | HGVSp | HGVSp Short | SWISSPROT | BIOTYPE | SIFT | PolyPhen | Tumor Sample Barcode | Tissue | Histology | Sex | Age | Stage | Therapy Types | Drugs | Outcome |
| EMC6 | insertion | Nonsense_Mutation | novel | c.318_319insAAGATGGAGAGCCATATGCTAAGAAATGTAACCAACACCTAGGA | p.Val107LysfsTer14 | p.V107Kfs*14 | Q9BV81 | protein_coding | TCGA-A2-A0CT-01 | Breast | breast invasive carcinoma | Female | >=65 | I/II | Chemotherapy | cytoxan | SD | ||
| EMC6 | SNV | Missense_Mutation | novel | c.193N>A | p.Leu65Ile | p.L65I | Q9BV81 | protein_coding | tolerated(0.23) | benign(0.076) | TCGA-EO-A22R-01 | Endometrium | uterine corpus endometrioid carcinoma | Female | <65 | I/II | Unknown | Unknown | SD |
| EMC6 | SNV | Missense_Mutation | rs202001960 | c.241N>T | p.Arg81Trp | p.R81W | Q9BV81 | protein_coding | deleterious(0.02) | probably_damaging(0.998) | TCGA-50-5930-01 | Lung | lung adenocarcinoma | Male | <65 | III/IV | Chemotherapy | taxotere | PD |
| EMC6 | SNV | Missense_Mutation | c.140C>T | p.Thr47Ile | p.T47I | Q9BV81 | protein_coding | deleterious(0) | probably_damaging(0.999) | TCGA-F1-6177-01 | Stomach | stomach adenocarcinoma | Male | >=65 | I/II | Unknown | Unknown | SD |
| Page: 1 |
Top |
Related drugs of malignant transformation related genes |
| Identification of chemicals and drugs interact with genes involved in malignant transfromation |
| (DGIdb 4.0) |
| Entrez ID | Symbol | Category | Interaction Types | Drug Claim Name | Drug Name | PMIDs |
| Page: 1 |

Copyright 2023-Present -The University of Texas Health Science Center at Houston |