
|
|||||
|
 | |
| |
| |
| |
| |
| |
|
Gene: EMC4 |
Gene summary for EMC4 |
| Gene information | Species | Human | Gene symbol | EMC4 | Gene ID | 51234 |
| Gene name | ER membrane protein complex subunit 4 | |
| Gene Alias | PIG17 | |
| Cytomap | 15q14 | |
| Gene Type | protein-coding | GO ID | GO:0006915 | UniProtAcc | A0A0S2Z598 |
Top |
Malignant transformation analysis |
| Identification of the aberrant gene expression in precancerous and cancerous lesions by comparing the gene expression of stem-like cells in diseased tissues with normal stem cells |
| Entrez ID | Symbol | Replicates | Species | Organ | Tissue | Adj P-value | Log2FC | Malignancy |
| 51234 | EMC4 | HTA11_2487_2000001011 | Human | Colorectum | SER | 1.13e-03 | 2.08e-01 | -0.1808 |
| 51234 | EMC4 | HTA11_1938_2000001011 | Human | Colorectum | AD | 5.25e-03 | 2.41e-01 | -0.0811 |
| 51234 | EMC4 | HTA11_347_2000001011 | Human | Colorectum | AD | 4.31e-06 | 2.45e-01 | -0.1954 |
| 51234 | EMC4 | HTA11_99999970781_79442 | Human | Colorectum | MSS | 9.73e-15 | 3.85e-01 | 0.294 |
| 51234 | EMC4 | HTA11_99999965104_69814 | Human | Colorectum | MSS | 6.88e-15 | 5.82e-01 | 0.281 |
| 51234 | EMC4 | HTA11_99999971662_82457 | Human | Colorectum | MSS | 3.66e-03 | 1.41e-01 | 0.3859 |
| 51234 | EMC4 | AEH-subject1 | Human | Endometrium | AEH | 3.48e-18 | -3.80e-01 | -0.3059 |
| 51234 | EMC4 | AEH-subject2 | Human | Endometrium | AEH | 3.91e-12 | -3.65e-01 | -0.2525 |
| 51234 | EMC4 | AEH-subject3 | Human | Endometrium | AEH | 3.87e-10 | -2.90e-01 | -0.2576 |
| 51234 | EMC4 | AEH-subject4 | Human | Endometrium | AEH | 1.11e-12 | -4.47e-01 | -0.2657 |
| 51234 | EMC4 | AEH-subject5 | Human | Endometrium | AEH | 3.13e-09 | -3.26e-01 | -0.2953 |
| 51234 | EMC4 | EEC-subject1 | Human | Endometrium | EEC | 3.75e-16 | -3.85e-01 | -0.2682 |
| 51234 | EMC4 | EEC-subject2 | Human | Endometrium | EEC | 2.08e-28 | -4.78e-01 | -0.2607 |
| 51234 | EMC4 | EEC-subject3 | Human | Endometrium | EEC | 4.95e-39 | -4.37e-01 | -0.2525 |
| 51234 | EMC4 | EEC-subject4 | Human | Endometrium | EEC | 2.19e-07 | -2.70e-01 | -0.2571 |
| 51234 | EMC4 | EEC-subject5 | Human | Endometrium | EEC | 6.47e-07 | -2.73e-01 | -0.249 |
| 51234 | EMC4 | GSM5276934 | Human | Endometrium | EEC | 8.14e-03 | 8.28e-03 | -0.0913 |
| 51234 | EMC4 | GSM6177620_NYU_UCEC1_lib1_lib1 | Human | Endometrium | EEC | 2.56e-26 | -1.65e-01 | -0.1869 |
| 51234 | EMC4 | GSM6177620_NYU_UCEC1_lib2_lib2 | Human | Endometrium | EEC | 2.10e-27 | -2.22e-01 | -0.1875 |
| 51234 | EMC4 | GSM6177620_NYU_UCEC1_lib3_lib3 | Human | Endometrium | EEC | 3.06e-32 | -1.53e-01 | -0.1883 |
| Page: 1 2 3 4 5 6 7 8 |
| Tissue | Expression Dynamics | Abbreviation |
| Colorectum (GSE201348) |  | FAP: Familial adenomatous polyposis |
| CRC: Colorectal cancer | ||
| Colorectum (HTA11) |  | AD: Adenomas |
| SER: Sessile serrated lesions | ||
| MSI-H: Microsatellite-high colorectal cancer | ||
| MSS: Microsatellite stable colorectal cancer | ||
| Endometrium | 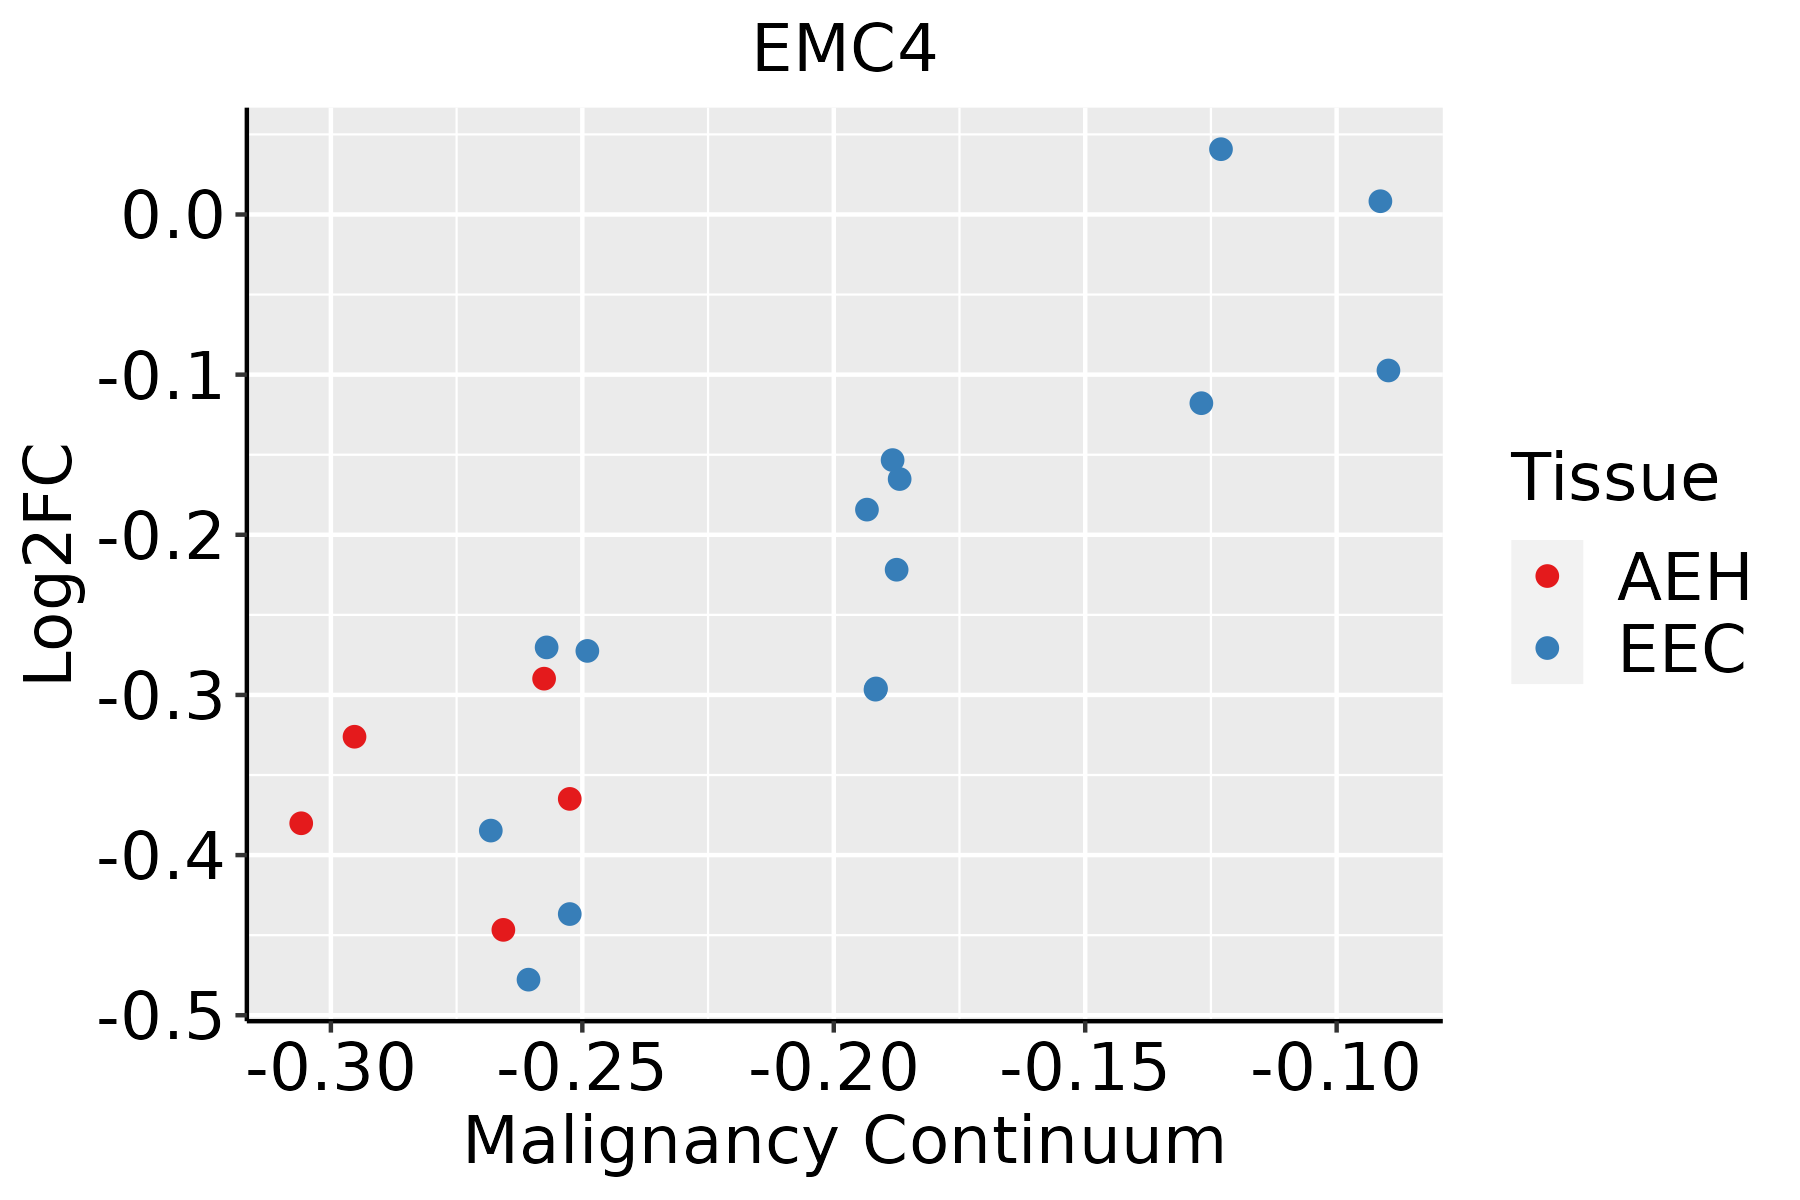 | AEH: Atypical endometrial hyperplasia |
| EEC: Endometrioid Cancer | ||
| Esophagus | 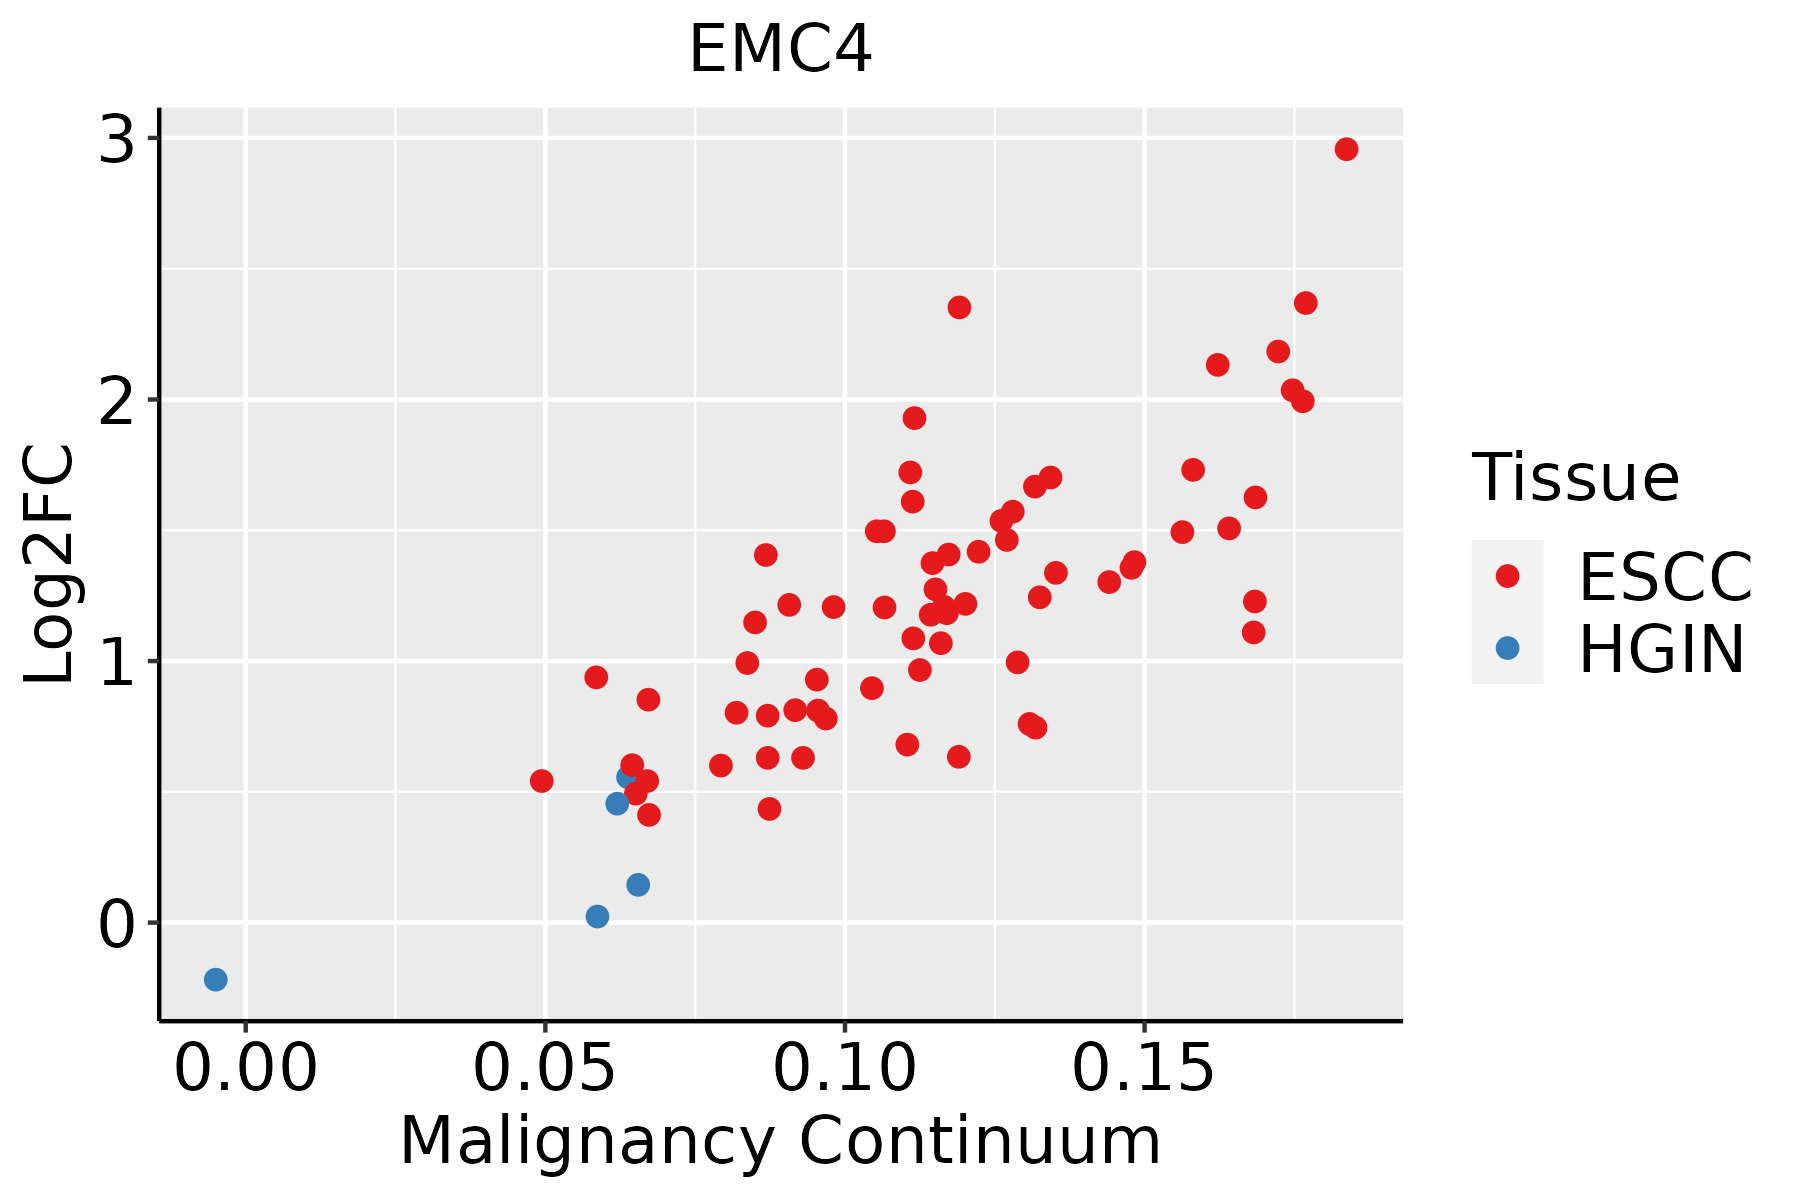 | ESCC: Esophageal squamous cell carcinoma |
| HGIN: High-grade intraepithelial neoplasias | ||
| LGIN: Low-grade intraepithelial neoplasias | ||
| Liver |  | HCC: Hepatocellular carcinoma |
| NAFLD: Non-alcoholic fatty liver disease | ||
| Oral Cavity |  | EOLP: Erosive Oral lichen planus |
| LP: leukoplakia | ||
| NEOLP: Non-erosive oral lichen planus | ||
| OSCC: Oral squamous cell carcinoma | ||
| Prostate | 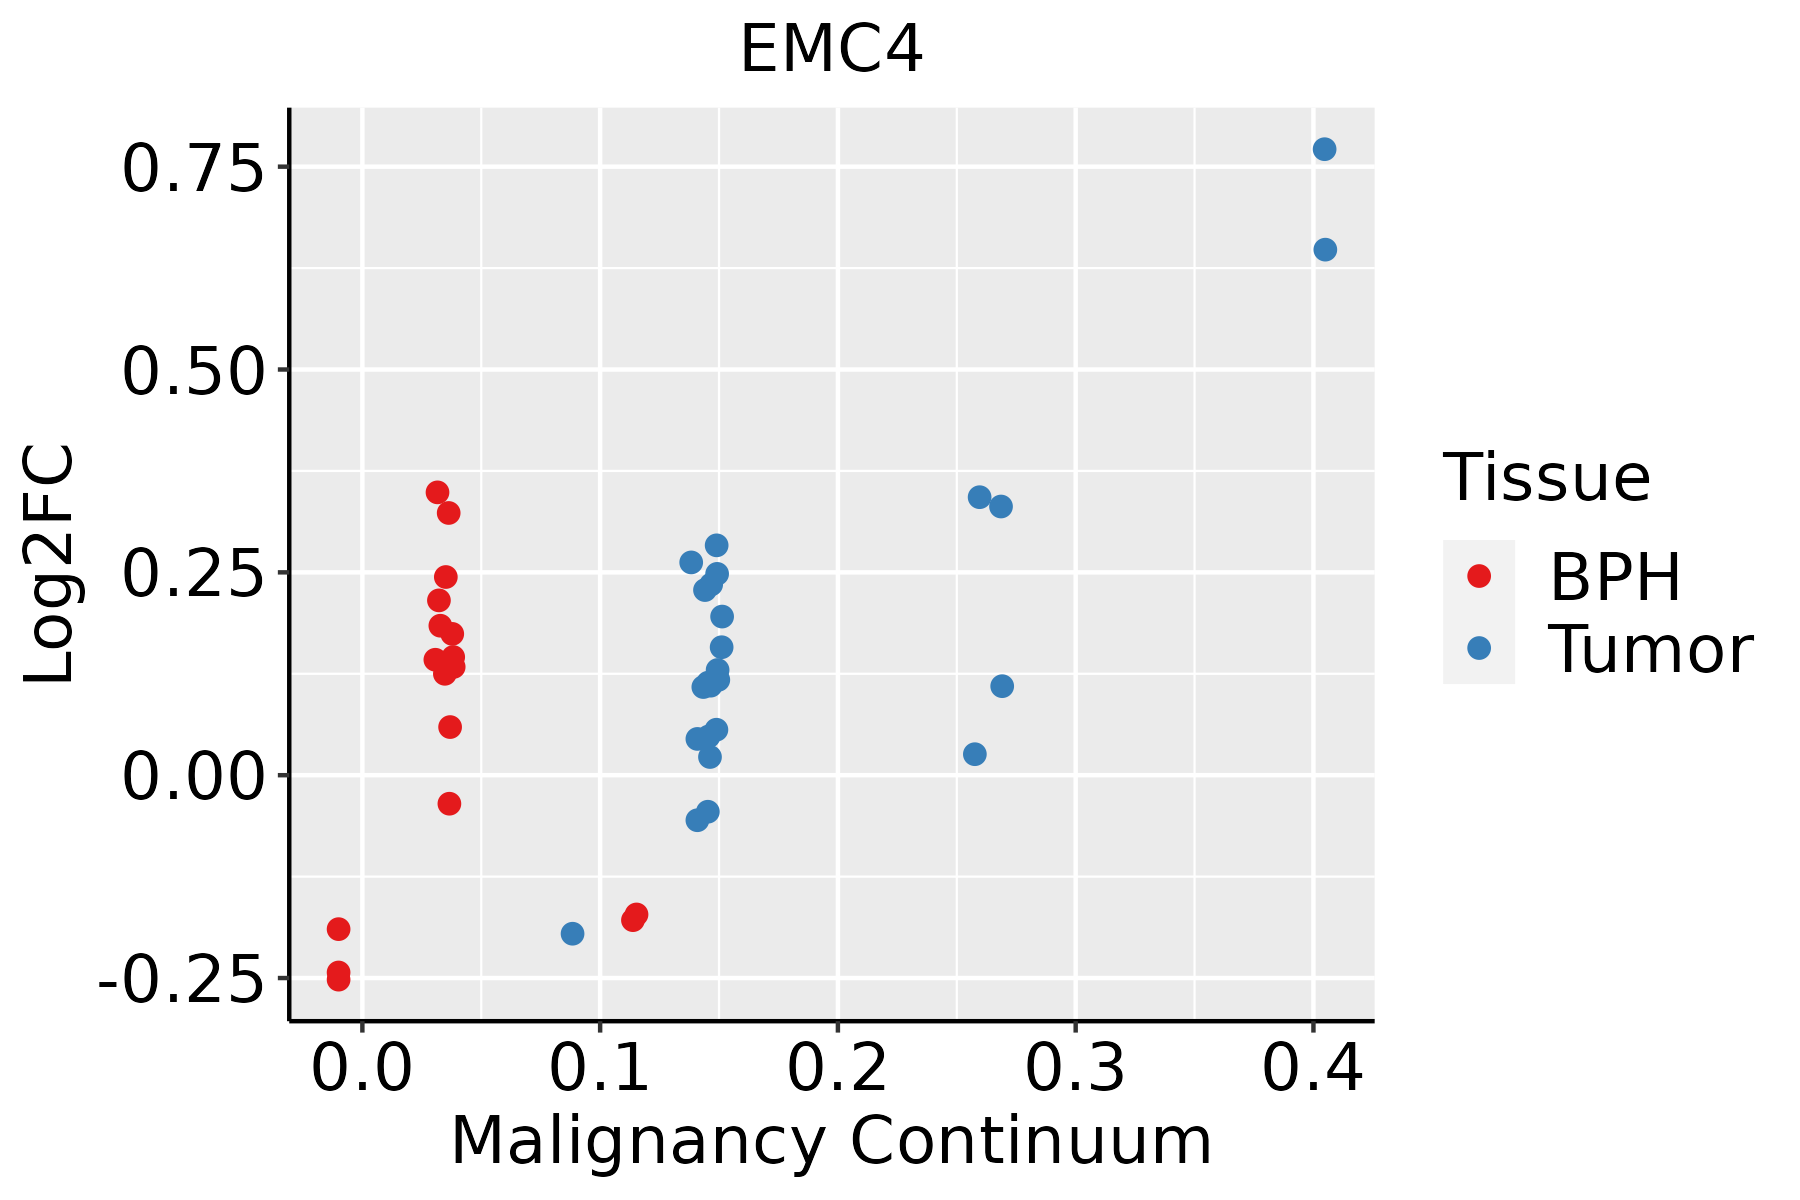 | BPH: Benign Prostatic Hyperplasia |
| Skin | 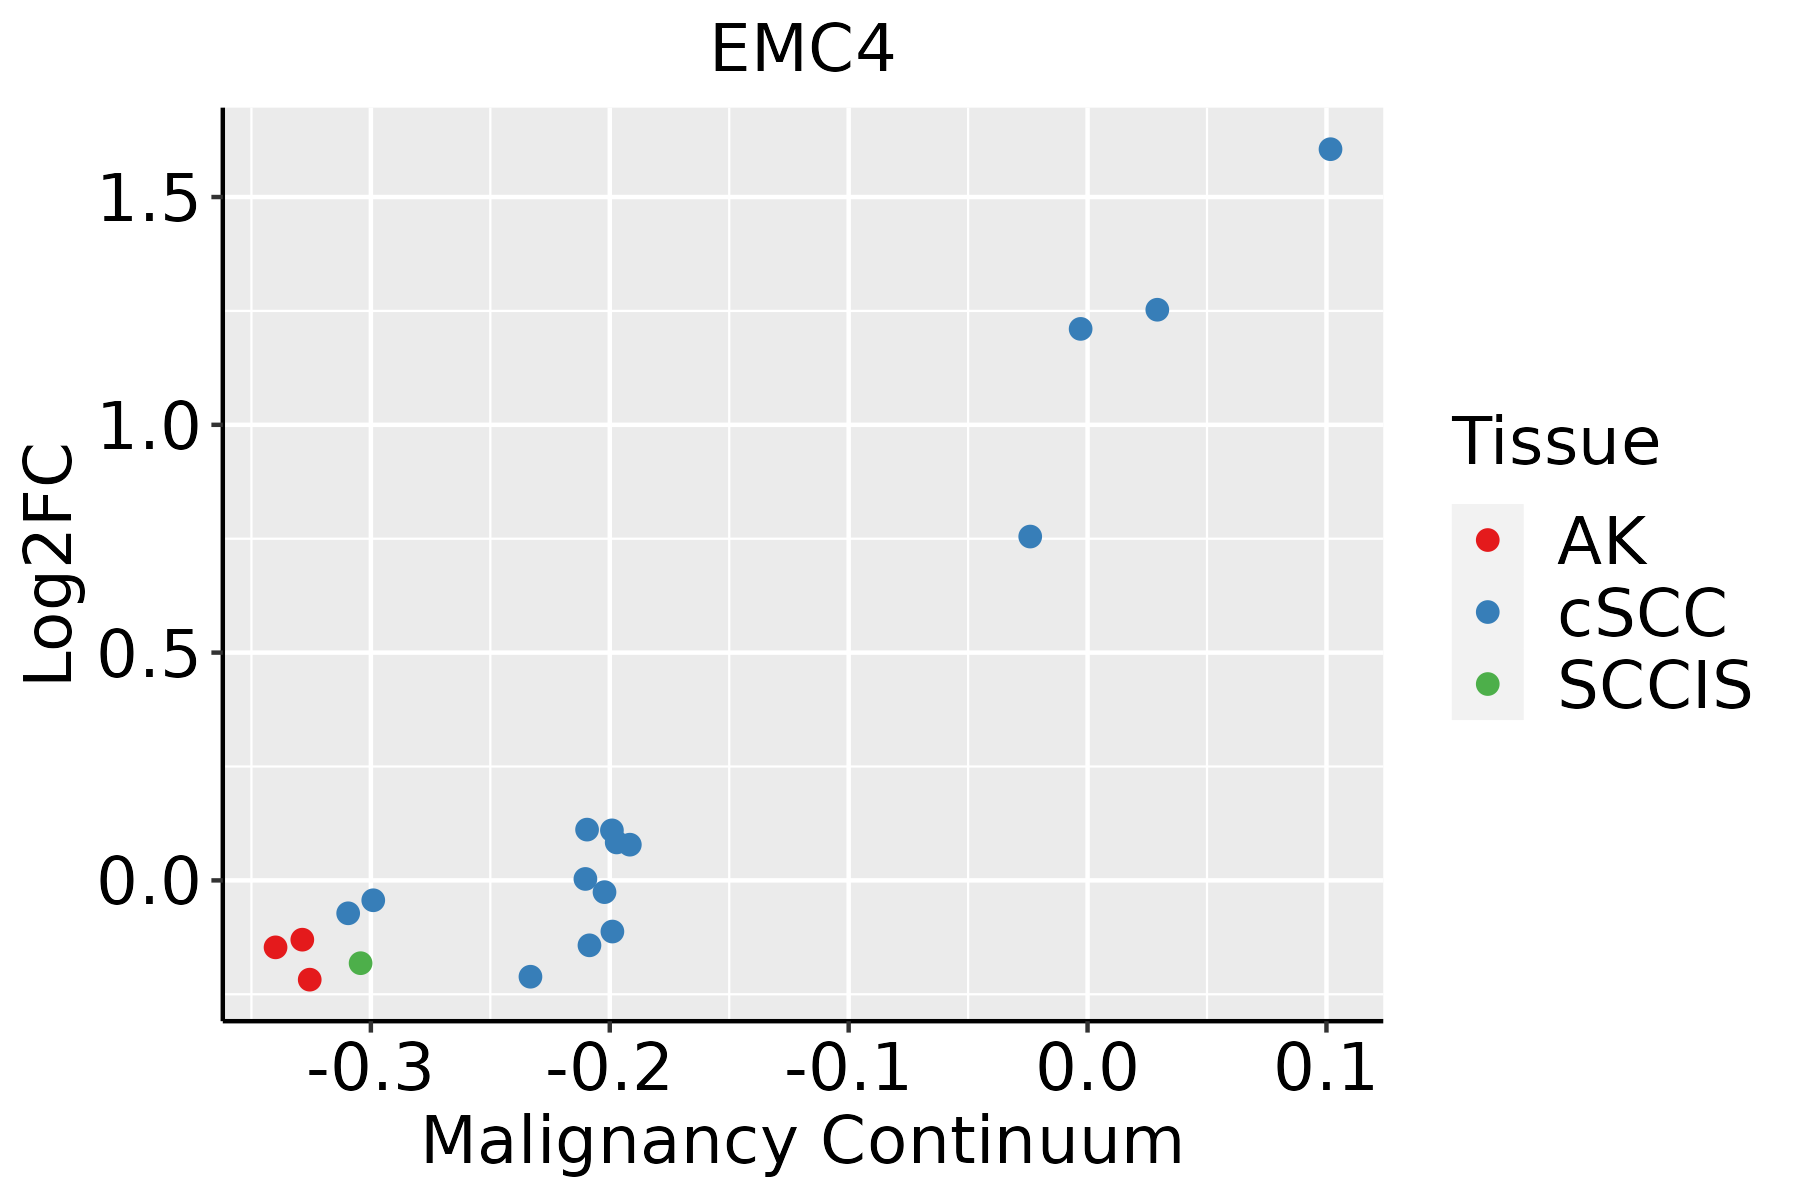 | AK: Actinic keratosis |
| cSCC: Cutaneous squamous cell carcinoma | ||
| SCCIS:squamous cell carcinoma in situ | ||
| Thyroid | 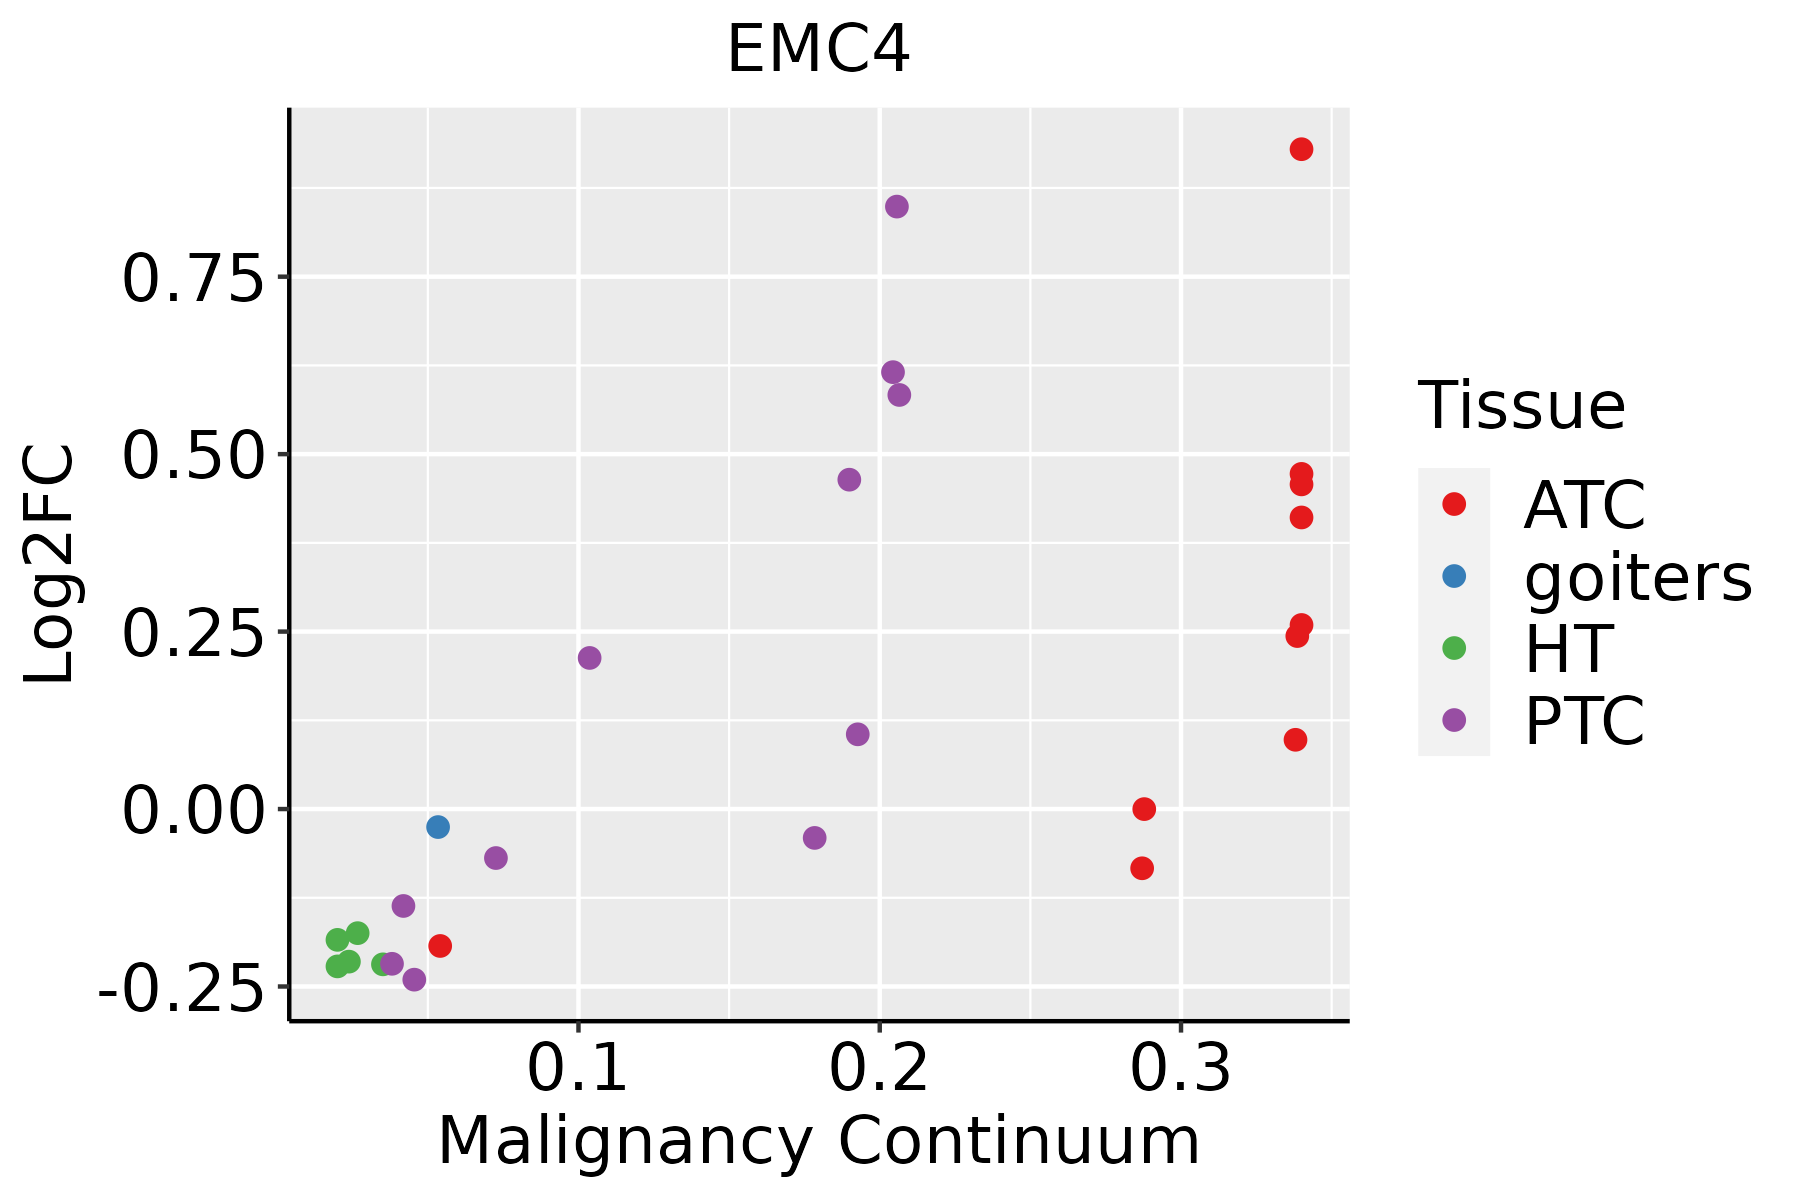 | ATC: Anaplastic thyroid cancer |
| HT: Hashimoto's thyroiditis | ||
| PTC: Papillary thyroid cancer |
| ∗log2FC in expression of this searched gene in stem-like cells from each diseased tissue sample relative to stem-like cells in normal samples in each tissue plotted against the malignancy continuum. Samples are colored based on if they are from different disease stage. |
Top |
Malignant transformation related pathway analysis |
| Find out the enriched GO biological processes and KEGG pathways involved in transition from healthy to precancer to cancer |
| Tissue | Disease Stage | Enriched GO biological Processes |
| Colorectum | AD |  |
| Colorectum | SER |  |
| Colorectum | MSS |  |
| Colorectum | MSI-H |  |
| Colorectum | FAP |  |
| ∗Top 15 enriched GO BP terms are showed in the bar plot of each disease state in each tissue. Each row represents a significant GO biological process which is colored according to the -log10(p.adjust). |
| Page: 1 2 3 4 5 6 7 8 9 |
| GO ID | Tissue | Disease Stage | Description | Gene Ratio | Bg Ratio | pvalue | p.adjust | Count |
| GO:0090150 | Colorectum | AD | establishment of protein localization to membrane | 100/3918 | 260/18723 | 6.01e-11 | 6.33e-09 | 100 |
| GO:0051205 | Colorectum | AD | protein insertion into membrane | 23/3918 | 57/18723 | 6.62e-04 | 6.80e-03 | 23 |
| GO:0007029 | Colorectum | AD | endoplasmic reticulum organization | 31/3918 | 87/18723 | 1.08e-03 | 1.00e-02 | 31 |
| GO:00901501 | Colorectum | SER | establishment of protein localization to membrane | 68/2897 | 260/18723 | 5.55e-06 | 2.01e-04 | 68 |
| GO:00512051 | Colorectum | SER | protein insertion into membrane | 19/2897 | 57/18723 | 6.32e-04 | 8.58e-03 | 19 |
| GO:00070291 | Colorectum | SER | endoplasmic reticulum organization | 23/2897 | 87/18723 | 5.77e-03 | 4.23e-02 | 23 |
| GO:00901502 | Colorectum | MSS | establishment of protein localization to membrane | 90/3467 | 260/18723 | 4.11e-10 | 3.49e-08 | 90 |
| GO:00512052 | Colorectum | MSS | protein insertion into membrane | 21/3467 | 57/18723 | 8.53e-04 | 8.75e-03 | 21 |
| GO:009015010 | Endometrium | AEH | establishment of protein localization to membrane | 51/2100 | 260/18723 | 4.74e-05 | 7.85e-04 | 51 |
| GO:00512054 | Endometrium | AEH | protein insertion into membrane | 14/2100 | 57/18723 | 3.48e-03 | 2.39e-02 | 14 |
| GO:009015015 | Endometrium | EEC | establishment of protein localization to membrane | 52/2168 | 260/18723 | 5.46e-05 | 8.64e-04 | 52 |
| GO:005120512 | Endometrium | EEC | protein insertion into membrane | 14/2168 | 57/18723 | 4.65e-03 | 2.97e-02 | 14 |
| GO:009015020 | Esophagus | HGIN | establishment of protein localization to membrane | 67/2587 | 260/18723 | 1.96e-07 | 9.57e-06 | 67 |
| GO:00512057 | Esophagus | HGIN | protein insertion into membrane | 21/2587 | 57/18723 | 1.16e-05 | 3.29e-04 | 21 |
| GO:00450483 | Esophagus | HGIN | protein insertion into ER membrane | 10/2587 | 22/18723 | 3.28e-04 | 5.46e-03 | 10 |
| GO:00070295 | Esophagus | HGIN | endoplasmic reticulum organization | 22/2587 | 87/18723 | 3.07e-03 | 2.90e-02 | 22 |
| GO:00718163 | Esophagus | HGIN | tail-anchored membrane protein insertion into ER membrane | 7/2587 | 17/18723 | 5.21e-03 | 4.30e-02 | 7 |
| GO:0090150110 | Esophagus | ESCC | establishment of protein localization to membrane | 182/8552 | 260/18723 | 1.27e-15 | 8.19e-14 | 182 |
| GO:000702914 | Esophagus | ESCC | endoplasmic reticulum organization | 65/8552 | 87/18723 | 3.28e-08 | 6.08e-07 | 65 |
| GO:005120515 | Esophagus | ESCC | protein insertion into membrane | 46/8552 | 57/18723 | 5.90e-08 | 1.04e-06 | 46 |
| Page: 1 2 3 4 |
| Pathway ID | Tissue | Disease Stage | Description | Gene Ratio | Bg Ratio | pvalue | p.adjust | qvalue | Count |
| Page: 1 |
Top |
Cell-cell communication analysis |
| Identification of potential cell-cell interactions between two cell types and their ligand-receptor pairs for different disease states |
| Ligand | Receptor | LRpair | Pathway | Tissue | Disease Stage |
| Page: 1 |
Top |
Single-cell gene regulatory network inference analysis |
| Find out the significant the regulons (TFs) and the target genes of each regulon across cell types for different disease states |
| TF | Cell Type | Tissue | Disease Stage | Target Gene | RSS | Regulon Activity |
| ∗The dot plots of a searched regulon are shown for all cell subpopulations in each disease state of each tissue based on the regulon specific score inferred using pySCENIC and by calculating the average expression. |
| Page: 1 |
Top |
Somatic mutation of malignant transformation related genes |
| Annotation of somatic variants for genes involved in malignant transformation |
| Hugo Symbol | Variant Class | Variant Classification | dbSNP RS | HGVSc | HGVSp | HGVSp Short | SWISSPROT | BIOTYPE | SIFT | PolyPhen | Tumor Sample Barcode | Tissue | Histology | Sex | Age | Stage | Therapy Types | Drugs | Outcome |
| EMC4 | SNV | Missense_Mutation | novel | c.175N>C | p.Glu59Gln | p.E59Q | Q5J8M3 | protein_coding | tolerated(0.18) | probably_damaging(0.912) | TCGA-AR-A2LE-01 | Breast | breast invasive carcinoma | Female | >=65 | I/II | Hormone Therapy | tamoxiphen | PD |
| EMC4 | SNV | Missense_Mutation | c.157C>T | p.Pro53Ser | p.P53S | Q5J8M3 | protein_coding | tolerated(0.98) | benign(0.023) | TCGA-AA-3815-01 | Colorectum | colon adenocarcinoma | Female | >=65 | I/II | Unknown | Unknown | SD | |
| EMC4 | SNV | Missense_Mutation | c.518N>T | p.Arg173Ile | p.R173I | Q5J8M3 | protein_coding | deleterious(0.03) | possibly_damaging(0.56) | TCGA-F5-6814-01 | Colorectum | rectum adenocarcinoma | Male | <65 | I/II | Unknown | Unknown | SD | |
| EMC4 | SNV | Missense_Mutation | c.79G>T | p.Gly27Cys | p.G27C | Q5J8M3 | protein_coding | deleterious(0.03) | possibly_damaging(0.829) | TCGA-AP-A0LM-01 | Endometrium | uterine corpus endometrioid carcinoma | Female | <65 | III/IV | Chemotherapy | cisplatin | SD | |
| EMC4 | SNV | Missense_Mutation | rs761614836 | c.203N>A | p.Arg68His | p.R68H | Q5J8M3 | protein_coding | deleterious(0) | probably_damaging(0.992) | TCGA-B5-A3FC-01 | Endometrium | uterine corpus endometrioid carcinoma | Female | <65 | I/II | Unknown | Unknown | SD |
| EMC4 | SNV | Missense_Mutation | novel | c.237N>T | p.Gln79His | p.Q79H | Q5J8M3 | protein_coding | deleterious(0) | probably_damaging(0.995) | TCGA-EO-A22U-01 | Endometrium | uterine corpus endometrioid carcinoma | Female | >=65 | I/II | Unknown | Unknown | SD |
| EMC4 | SNV | Missense_Mutation | novel | c.337N>A | p.Leu113Ile | p.L113I | Q5J8M3 | protein_coding | tolerated(0.14) | benign(0.097) | TCGA-EO-A3KX-01 | Endometrium | uterine corpus endometrioid carcinoma | Female | >=65 | I/II | Unknown | Unknown | SD |
| EMC4 | insertion | Frame_Shift_Ins | novel | c.176_177insCTTAGTGCTTCCTAAAGCCACTTCC | p.Glu59AspfsTer119 | p.E59Dfs*119 | Q5J8M3 | protein_coding | TCGA-BS-A0UF-01 | Endometrium | uterine corpus endometrioid carcinoma | Female | >=65 | I/II | Unknown | Unknown | SD | ||
| EMC4 | SNV | Missense_Mutation | c.518N>C | p.Arg173Thr | p.R173T | Q5J8M3 | protein_coding | deleterious(0.01) | probably_damaging(0.971) | TCGA-93-8067-01 | Lung | lung adenocarcinoma | Male | >=65 | I/II | Unknown | Unknown | SD | |
| EMC4 | SNV | Missense_Mutation | c.323N>C | p.Arg108Pro | p.R108P | Q5J8M3 | protein_coding | deleterious(0) | probably_damaging(0.998) | TCGA-77-6845-01 | Lung | lung squamous cell carcinoma | Male | >=65 | I/II | Unknown | Unknown | SD |
| Page: 1 2 |
Top |
Related drugs of malignant transformation related genes |
| Identification of chemicals and drugs interact with genes involved in malignant transfromation |
| (DGIdb 4.0) |
| Entrez ID | Symbol | Category | Interaction Types | Drug Claim Name | Drug Name | PMIDs |
| Page: 1 |

Copyright 2023-Present -The University of Texas Health Science Center at Houston |