
|
|||||
|
 | |
| |
| |
| |
| |
| |
|
Gene: EMC3 |
Gene summary for EMC3 |
| Gene information | Species | Human | Gene symbol | EMC3 | Gene ID | 55831 |
| Gene name | ER membrane protein complex subunit 3 | |
| Gene Alias | POB | |
| Cytomap | 3p25.3 | |
| Gene Type | protein-coding | GO ID | GO:0006996 | UniProtAcc | Q9P0I2 |
Top |
Malignant transformation analysis |
| Identification of the aberrant gene expression in precancerous and cancerous lesions by comparing the gene expression of stem-like cells in diseased tissues with normal stem cells |
| Entrez ID | Symbol | Replicates | Species | Organ | Tissue | Adj P-value | Log2FC | Malignancy |
| 55831 | EMC3 | HTA11_1938_2000001011 | Human | Colorectum | AD | 2.91e-05 | 3.98e-01 | -0.0811 |
| 55831 | EMC3 | HTA11_347_2000001011 | Human | Colorectum | AD | 1.08e-11 | 4.74e-01 | -0.1954 |
| 55831 | EMC3 | HTA11_696_2000001011 | Human | Colorectum | AD | 2.97e-03 | 3.55e-01 | -0.1464 |
| 55831 | EMC3 | HTA11_1391_2000001011 | Human | Colorectum | AD | 9.86e-04 | 4.08e-01 | -0.059 |
| 55831 | EMC3 | HTA11_99999970781_79442 | Human | Colorectum | MSS | 6.87e-03 | 2.71e-01 | 0.294 |
| 55831 | EMC3 | HTA11_99999965104_69814 | Human | Colorectum | MSS | 1.80e-03 | 2.94e-01 | 0.281 |
| 55831 | EMC3 | HTA11_99999971662_82457 | Human | Colorectum | MSS | 3.26e-04 | 4.41e-01 | 0.3859 |
| 55831 | EMC3 | A001-C-207 | Human | Colorectum | FAP | 3.73e-04 | -2.26e-01 | 0.1278 |
| 55831 | EMC3 | A015-C-203 | Human | Colorectum | FAP | 1.55e-06 | -1.41e-01 | -0.1294 |
| 55831 | EMC3 | A001-C-108 | Human | Colorectum | FAP | 1.30e-02 | -1.31e-01 | -0.0272 |
| 55831 | EMC3 | A002-C-205 | Human | Colorectum | FAP | 1.91e-03 | -2.01e-01 | -0.1236 |
| 55831 | EMC3 | A015-C-106 | Human | Colorectum | FAP | 5.04e-03 | -1.45e-01 | -0.0511 |
| 55831 | EMC3 | A015-C-104 | Human | Colorectum | FAP | 1.70e-08 | -1.54e-01 | -0.1899 |
| 55831 | EMC3 | A001-C-014 | Human | Colorectum | FAP | 4.67e-05 | -1.88e-01 | 0.0135 |
| 55831 | EMC3 | A002-C-016 | Human | Colorectum | FAP | 3.50e-02 | -9.93e-02 | 0.0521 |
| 55831 | EMC3 | A001-C-203 | Human | Colorectum | FAP | 9.48e-06 | -1.72e-01 | -0.0481 |
| 55831 | EMC3 | A002-C-116 | Human | Colorectum | FAP | 1.01e-05 | -1.53e-01 | -0.0452 |
| 55831 | EMC3 | F034 | Human | Colorectum | FAP | 1.62e-04 | -1.25e-01 | -0.0665 |
| 55831 | EMC3 | LZE4T | Human | Esophagus | ESCC | 1.86e-14 | 3.21e-01 | 0.0811 |
| 55831 | EMC3 | LZE7T | Human | Esophagus | ESCC | 2.16e-03 | 1.90e-01 | 0.0667 |
| Page: 1 2 3 4 5 6 7 8 |
| Tissue | Expression Dynamics | Abbreviation |
| Colorectum (GSE201348) |  | FAP: Familial adenomatous polyposis |
| CRC: Colorectal cancer | ||
| Colorectum (HTA11) |  | AD: Adenomas |
| SER: Sessile serrated lesions | ||
| MSI-H: Microsatellite-high colorectal cancer | ||
| MSS: Microsatellite stable colorectal cancer | ||
| Esophagus |  | ESCC: Esophageal squamous cell carcinoma |
| HGIN: High-grade intraepithelial neoplasias | ||
| LGIN: Low-grade intraepithelial neoplasias | ||
| Liver | 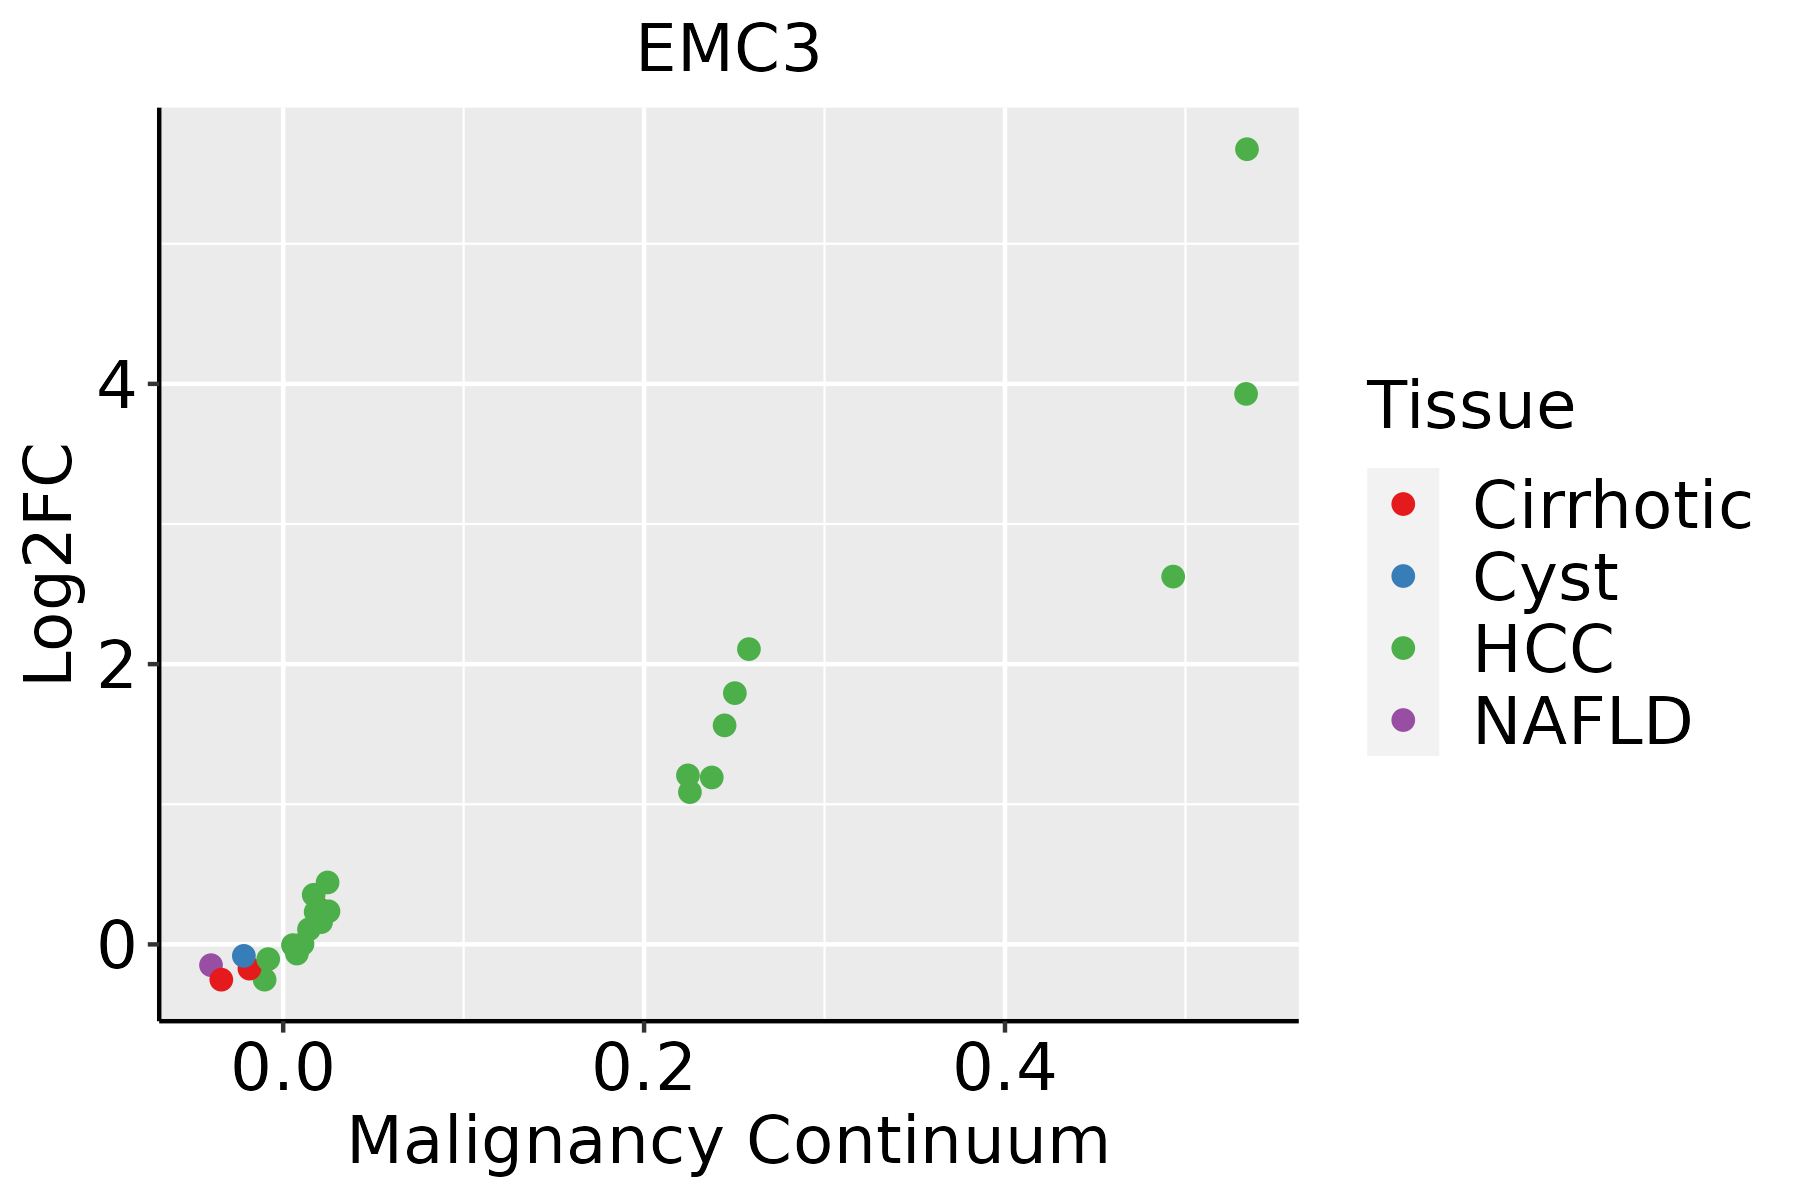 | HCC: Hepatocellular carcinoma |
| NAFLD: Non-alcoholic fatty liver disease | ||
| Oral Cavity | 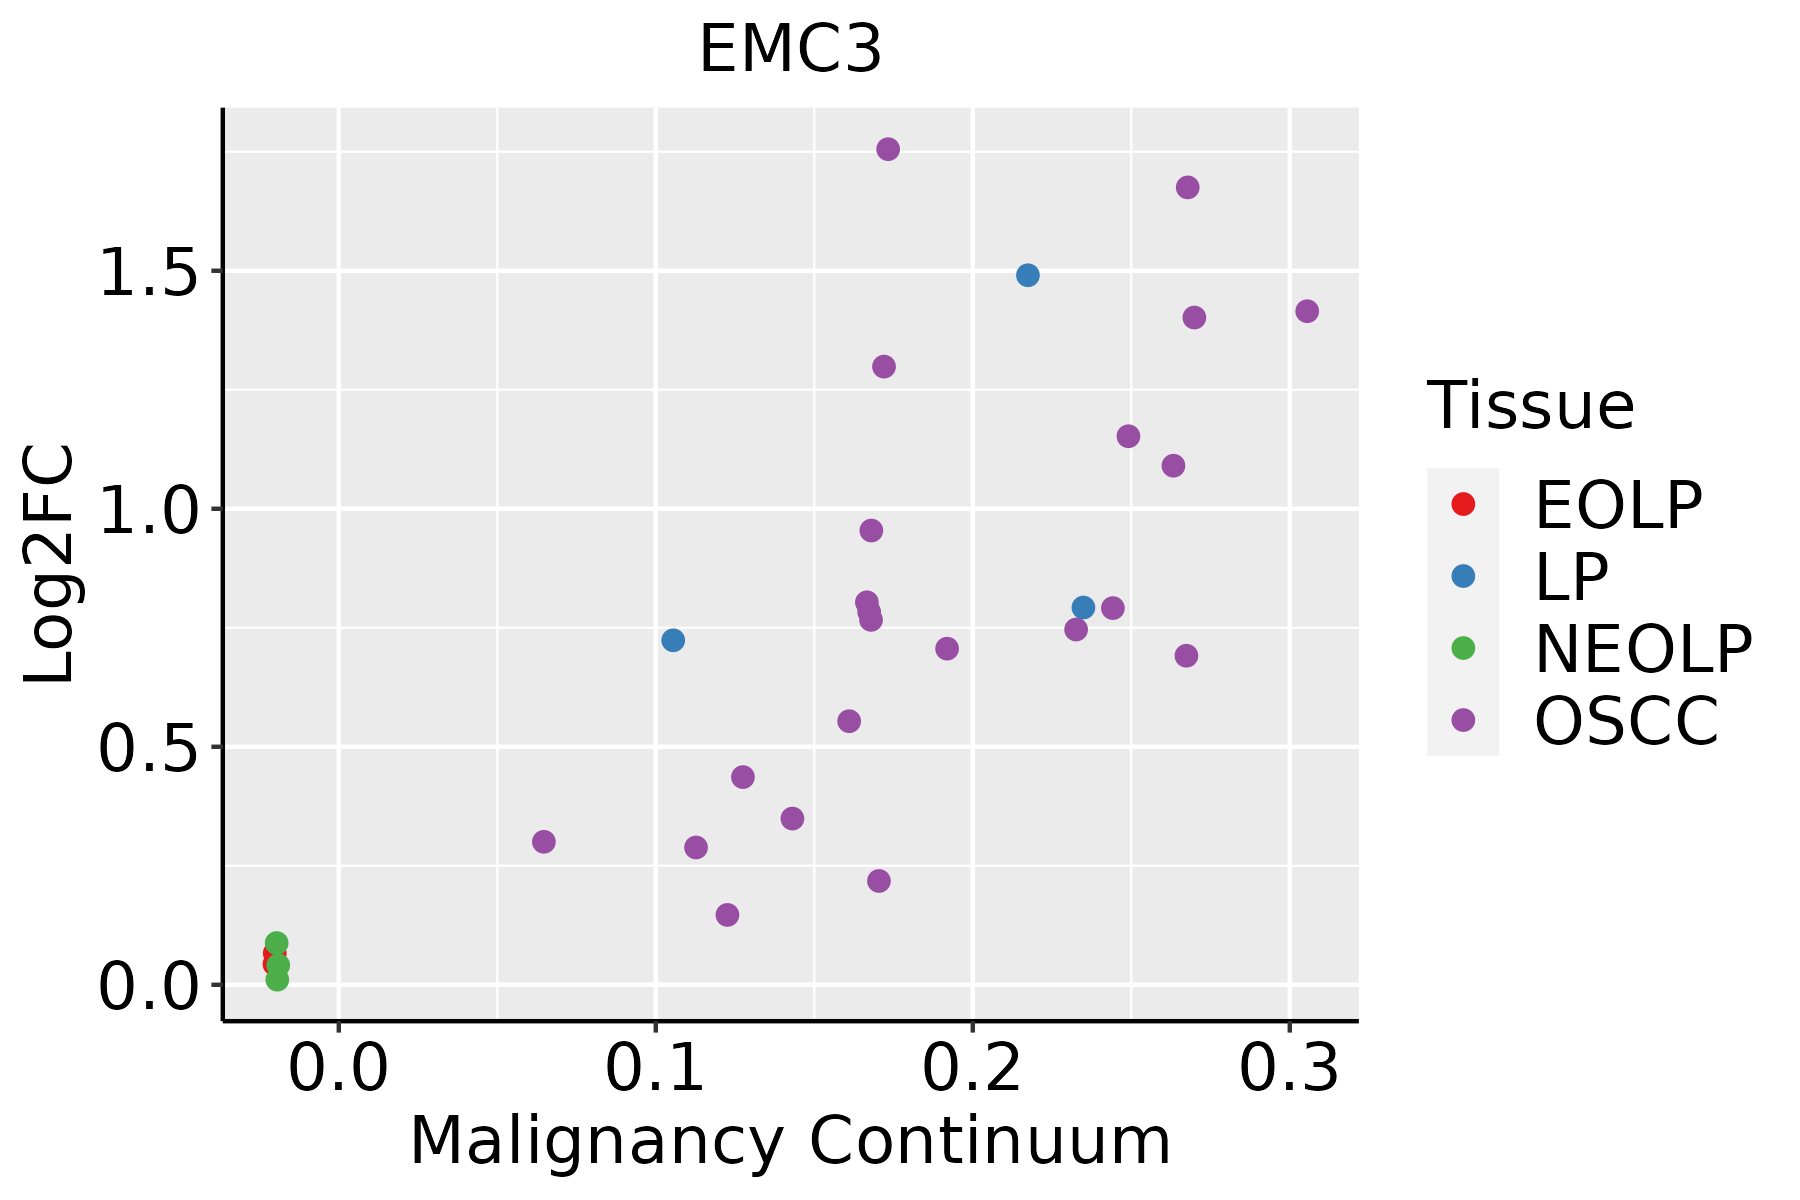 | EOLP: Erosive Oral lichen planus |
| LP: leukoplakia | ||
| NEOLP: Non-erosive oral lichen planus | ||
| OSCC: Oral squamous cell carcinoma | ||
| Prostate |  | BPH: Benign Prostatic Hyperplasia |
| Skin |  | AK: Actinic keratosis |
| cSCC: Cutaneous squamous cell carcinoma | ||
| SCCIS:squamous cell carcinoma in situ | ||
| Thyroid |  | ATC: Anaplastic thyroid cancer |
| HT: Hashimoto's thyroiditis | ||
| PTC: Papillary thyroid cancer |
| ∗log2FC in expression of this searched gene in stem-like cells from each diseased tissue sample relative to stem-like cells in normal samples in each tissue plotted against the malignancy continuum. Samples are colored based on if they are from different disease stage. |
Top |
Malignant transformation related pathway analysis |
| Find out the enriched GO biological processes and KEGG pathways involved in transition from healthy to precancer to cancer |
| Tissue | Disease Stage | Enriched GO biological Processes |
| Colorectum | AD |  |
| Colorectum | SER |  |
| Colorectum | MSS |  |
| Colorectum | MSI-H |  |
| Colorectum | FAP |  |
| ∗Top 15 enriched GO BP terms are showed in the bar plot of each disease state in each tissue. Each row represents a significant GO biological process which is colored according to the -log10(p.adjust). |
| Page: 1 2 3 4 5 6 7 8 9 |
| GO ID | Tissue | Disease Stage | Description | Gene Ratio | Bg Ratio | pvalue | p.adjust | Count |
| GO:0090150 | Colorectum | AD | establishment of protein localization to membrane | 100/3918 | 260/18723 | 6.01e-11 | 6.33e-09 | 100 |
| GO:0051205 | Colorectum | AD | protein insertion into membrane | 23/3918 | 57/18723 | 6.62e-04 | 6.80e-03 | 23 |
| GO:0007029 | Colorectum | AD | endoplasmic reticulum organization | 31/3918 | 87/18723 | 1.08e-03 | 1.00e-02 | 31 |
| GO:00901502 | Colorectum | MSS | establishment of protein localization to membrane | 90/3467 | 260/18723 | 4.11e-10 | 3.49e-08 | 90 |
| GO:00512052 | Colorectum | MSS | protein insertion into membrane | 21/3467 | 57/18723 | 8.53e-04 | 8.75e-03 | 21 |
| GO:00901504 | Colorectum | FAP | establishment of protein localization to membrane | 69/2622 | 260/18723 | 6.40e-08 | 4.54e-06 | 69 |
| GO:0090150110 | Esophagus | ESCC | establishment of protein localization to membrane | 182/8552 | 260/18723 | 1.27e-15 | 8.19e-14 | 182 |
| GO:000702914 | Esophagus | ESCC | endoplasmic reticulum organization | 65/8552 | 87/18723 | 3.28e-08 | 6.08e-07 | 65 |
| GO:005120515 | Esophagus | ESCC | protein insertion into membrane | 46/8552 | 57/18723 | 5.90e-08 | 1.04e-06 | 46 |
| GO:004504812 | Esophagus | ESCC | protein insertion into ER membrane | 21/8552 | 22/18723 | 8.75e-07 | 1.13e-05 | 21 |
| GO:007181611 | Esophagus | ESCC | tail-anchored membrane protein insertion into ER membrane | 17/8552 | 17/18723 | 1.63e-06 | 1.95e-05 | 17 |
| GO:00450503 | Esophagus | ESCC | protein insertion into ER membrane by stop-transfer membrane-anchor sequence | 10/8552 | 10/18723 | 3.94e-04 | 2.26e-03 | 10 |
| GO:00901507 | Liver | Cirrhotic | establishment of protein localization to membrane | 123/4634 | 260/18723 | 1.85e-15 | 2.15e-13 | 123 |
| GO:00070292 | Liver | Cirrhotic | endoplasmic reticulum organization | 42/4634 | 87/18723 | 1.67e-06 | 3.22e-05 | 42 |
| GO:00512053 | Liver | Cirrhotic | protein insertion into membrane | 29/4634 | 57/18723 | 1.88e-05 | 2.53e-04 | 29 |
| GO:0045048 | Liver | Cirrhotic | protein insertion into ER membrane | 11/4634 | 22/18723 | 9.18e-03 | 4.21e-02 | 11 |
| GO:009015012 | Liver | HCC | establishment of protein localization to membrane | 168/7958 | 260/18723 | 4.07e-13 | 2.13e-11 | 168 |
| GO:000702911 | Liver | HCC | endoplasmic reticulum organization | 64/7958 | 87/18723 | 3.92e-09 | 1.04e-07 | 64 |
| GO:005120511 | Liver | HCC | protein insertion into membrane | 41/7958 | 57/18723 | 6.42e-06 | 7.83e-05 | 41 |
| GO:0071816 | Liver | HCC | tail-anchored membrane protein insertion into ER membrane | 15/7958 | 17/18723 | 1.31e-04 | 1.07e-03 | 15 |
| Page: 1 2 3 |
| Pathway ID | Tissue | Disease Stage | Description | Gene Ratio | Bg Ratio | pvalue | p.adjust | qvalue | Count |
| Page: 1 |
Top |
Cell-cell communication analysis |
| Identification of potential cell-cell interactions between two cell types and their ligand-receptor pairs for different disease states |
| Ligand | Receptor | LRpair | Pathway | Tissue | Disease Stage |
| Page: 1 |
Top |
Single-cell gene regulatory network inference analysis |
| Find out the significant the regulons (TFs) and the target genes of each regulon across cell types for different disease states |
| TF | Cell Type | Tissue | Disease Stage | Target Gene | RSS | Regulon Activity |
| ∗The dot plots of a searched regulon are shown for all cell subpopulations in each disease state of each tissue based on the regulon specific score inferred using pySCENIC and by calculating the average expression. |
| Page: 1 |
Top |
Somatic mutation of malignant transformation related genes |
| Annotation of somatic variants for genes involved in malignant transformation |
| Hugo Symbol | Variant Class | Variant Classification | dbSNP RS | HGVSc | HGVSp | HGVSp Short | SWISSPROT | BIOTYPE | SIFT | PolyPhen | Tumor Sample Barcode | Tissue | Histology | Sex | Age | Stage | Therapy Types | Drugs | Outcome |
| EMC3 | SNV | Missense_Mutation | c.593N>C | p.Met198Thr | p.M198T | Q9P0I2 | protein_coding | tolerated(0.35) | benign(0) | TCGA-D8-A1XK-01 | Breast | breast invasive carcinoma | Female | <65 | I/II | Chemotherapy | doxorubicine+cyclophosphamide | SD | |
| EMC3 | insertion | Frame_Shift_Ins | novel | c.271_272insA | p.Thr91AsnfsTer2 | p.T91Nfs*2 | Q9P0I2 | protein_coding | TCGA-D8-A1XQ-01 | Breast | breast invasive carcinoma | Female | >=65 | I/II | Unknown | Unknown | SD | ||
| EMC3 | SNV | Missense_Mutation | c.538N>T | p.Arg180Trp | p.R180W | Q9P0I2 | protein_coding | deleterious(0) | probably_damaging(1) | TCGA-C5-A2LZ-01 | Cervix | cervical & endocervical cancer | Female | >=65 | III/IV | Unknown | Unknown | PD | |
| EMC3 | SNV | Missense_Mutation | novel | c.469N>A | p.Glu157Lys | p.E157K | Q9P0I2 | protein_coding | tolerated(0.07) | benign(0.432) | TCGA-AA-3984-01 | Colorectum | colon adenocarcinoma | Female | <65 | I/II | Unknown | Unknown | SD |
| EMC3 | SNV | Missense_Mutation | rs761023207 | c.634N>A | p.Ala212Thr | p.A212T | Q9P0I2 | protein_coding | tolerated(0.34) | benign(0.037) | TCGA-AA-A02R-01 | Colorectum | colon adenocarcinoma | Female | >=65 | I/II | Unknown | Unknown | PD |
| EMC3 | SNV | Missense_Mutation | novel | c.260N>A | p.Phe87Tyr | p.F87Y | Q9P0I2 | protein_coding | tolerated(0.8) | benign(0.009) | TCGA-AZ-4315-01 | Colorectum | colon adenocarcinoma | Male | <65 | I/II | Unknown | Unknown | SD |
| EMC3 | SNV | Missense_Mutation | c.323N>T | p.Thr108Ile | p.T108I | Q9P0I2 | protein_coding | deleterious(0.02) | benign(0.424) | TCGA-G4-6588-01 | Colorectum | colon adenocarcinoma | Female | <65 | I/II | Unknown | Unknown | SD | |
| EMC3 | SNV | Missense_Mutation | novel | c.459N>T | p.Gln153His | p.Q153H | Q9P0I2 | protein_coding | deleterious(0.04) | possibly_damaging(0.861) | TCGA-A5-A0G1-01 | Endometrium | uterine corpus endometrioid carcinoma | Female | >=65 | I/II | Unknown | Unknown | SD |
| EMC3 | SNV | Missense_Mutation | novel | c.296N>A | p.Ser99Tyr | p.S99Y | Q9P0I2 | protein_coding | deleterious(0) | possibly_damaging(0.808) | TCGA-A5-A2K5-01 | Endometrium | uterine corpus endometrioid carcinoma | Female | >=65 | I/II | Unknown | Unknown | SD |
| EMC3 | SNV | Missense_Mutation | novel | c.181C>T | p.Leu61Phe | p.L61F | Q9P0I2 | protein_coding | deleterious(0) | probably_damaging(1) | TCGA-AX-A06F-01 | Endometrium | uterine corpus endometrioid carcinoma | Female | <65 | III/IV | Chemotherapy | carboplatin | SD |
| Page: 1 2 3 |
Top |
Related drugs of malignant transformation related genes |
| Identification of chemicals and drugs interact with genes involved in malignant transfromation |
| (DGIdb 4.0) |
| Entrez ID | Symbol | Category | Interaction Types | Drug Claim Name | Drug Name | PMIDs |
| Page: 1 |

Copyright 2023-Present -The University of Texas Health Science Center at Houston |