
|
|||||
|
 | |
| |
| |
| |
| |
| |
|
Gene: EMC2 |
Gene summary for EMC2 |
| Gene information | Species | Human | Gene symbol | EMC2 | Gene ID | 9694 |
| Gene name | ER membrane protein complex subunit 2 | |
| Gene Alias | KIAA0103 | |
| Cytomap | 8q23.1 | |
| Gene Type | protein-coding | GO ID | GO:0006996 | UniProtAcc | Q15006 |
Top |
Malignant transformation analysis |
| Identification of the aberrant gene expression in precancerous and cancerous lesions by comparing the gene expression of stem-like cells in diseased tissues with normal stem cells |
| Entrez ID | Symbol | Replicates | Species | Organ | Tissue | Adj P-value | Log2FC | Malignancy |
| 9694 | EMC2 | LZE2T | Human | Esophagus | ESCC | 6.60e-06 | 8.63e-01 | 0.082 |
| 9694 | EMC2 | LZE4T | Human | Esophagus | ESCC | 1.10e-17 | 6.00e-01 | 0.0811 |
| 9694 | EMC2 | LZE7T | Human | Esophagus | ESCC | 2.28e-06 | 1.64e-01 | 0.0667 |
| 9694 | EMC2 | LZE8T | Human | Esophagus | ESCC | 2.63e-14 | 4.64e-01 | 0.067 |
| 9694 | EMC2 | LZE20T | Human | Esophagus | ESCC | 1.84e-15 | 6.63e-01 | 0.0662 |
| 9694 | EMC2 | LZE22T | Human | Esophagus | ESCC | 8.74e-05 | 5.15e-01 | 0.068 |
| 9694 | EMC2 | LZE24T | Human | Esophagus | ESCC | 1.99e-21 | 6.28e-01 | 0.0596 |
| 9694 | EMC2 | LZE21T | Human | Esophagus | ESCC | 1.72e-02 | 4.84e-01 | 0.0655 |
| 9694 | EMC2 | LZE6T | Human | Esophagus | ESCC | 1.06e-05 | 1.59e-01 | 0.0845 |
| 9694 | EMC2 | P1T-E | Human | Esophagus | ESCC | 2.32e-02 | 4.18e-01 | 0.0875 |
| 9694 | EMC2 | P2T-E | Human | Esophagus | ESCC | 4.09e-23 | 4.46e-01 | 0.1177 |
| 9694 | EMC2 | P4T-E | Human | Esophagus | ESCC | 1.39e-41 | 7.62e-01 | 0.1323 |
| 9694 | EMC2 | P5T-E | Human | Esophagus | ESCC | 3.89e-42 | 8.36e-01 | 0.1327 |
| 9694 | EMC2 | P8T-E | Human | Esophagus | ESCC | 3.71e-23 | 4.77e-01 | 0.0889 |
| 9694 | EMC2 | P9T-E | Human | Esophagus | ESCC | 9.70e-27 | 6.28e-01 | 0.1131 |
| 9694 | EMC2 | P10T-E | Human | Esophagus | ESCC | 2.26e-34 | 5.96e-01 | 0.116 |
| 9694 | EMC2 | P11T-E | Human | Esophagus | ESCC | 1.98e-21 | 6.99e-01 | 0.1426 |
| 9694 | EMC2 | P12T-E | Human | Esophagus | ESCC | 3.54e-61 | 1.02e+00 | 0.1122 |
| 9694 | EMC2 | P15T-E | Human | Esophagus | ESCC | 1.36e-31 | 6.89e-01 | 0.1149 |
| 9694 | EMC2 | P16T-E | Human | Esophagus | ESCC | 4.62e-39 | 7.43e-01 | 0.1153 |
| Page: 1 2 3 4 5 6 |
| Tissue | Expression Dynamics | Abbreviation |
| Esophagus |  | ESCC: Esophageal squamous cell carcinoma |
| HGIN: High-grade intraepithelial neoplasias | ||
| LGIN: Low-grade intraepithelial neoplasias | ||
| Liver | 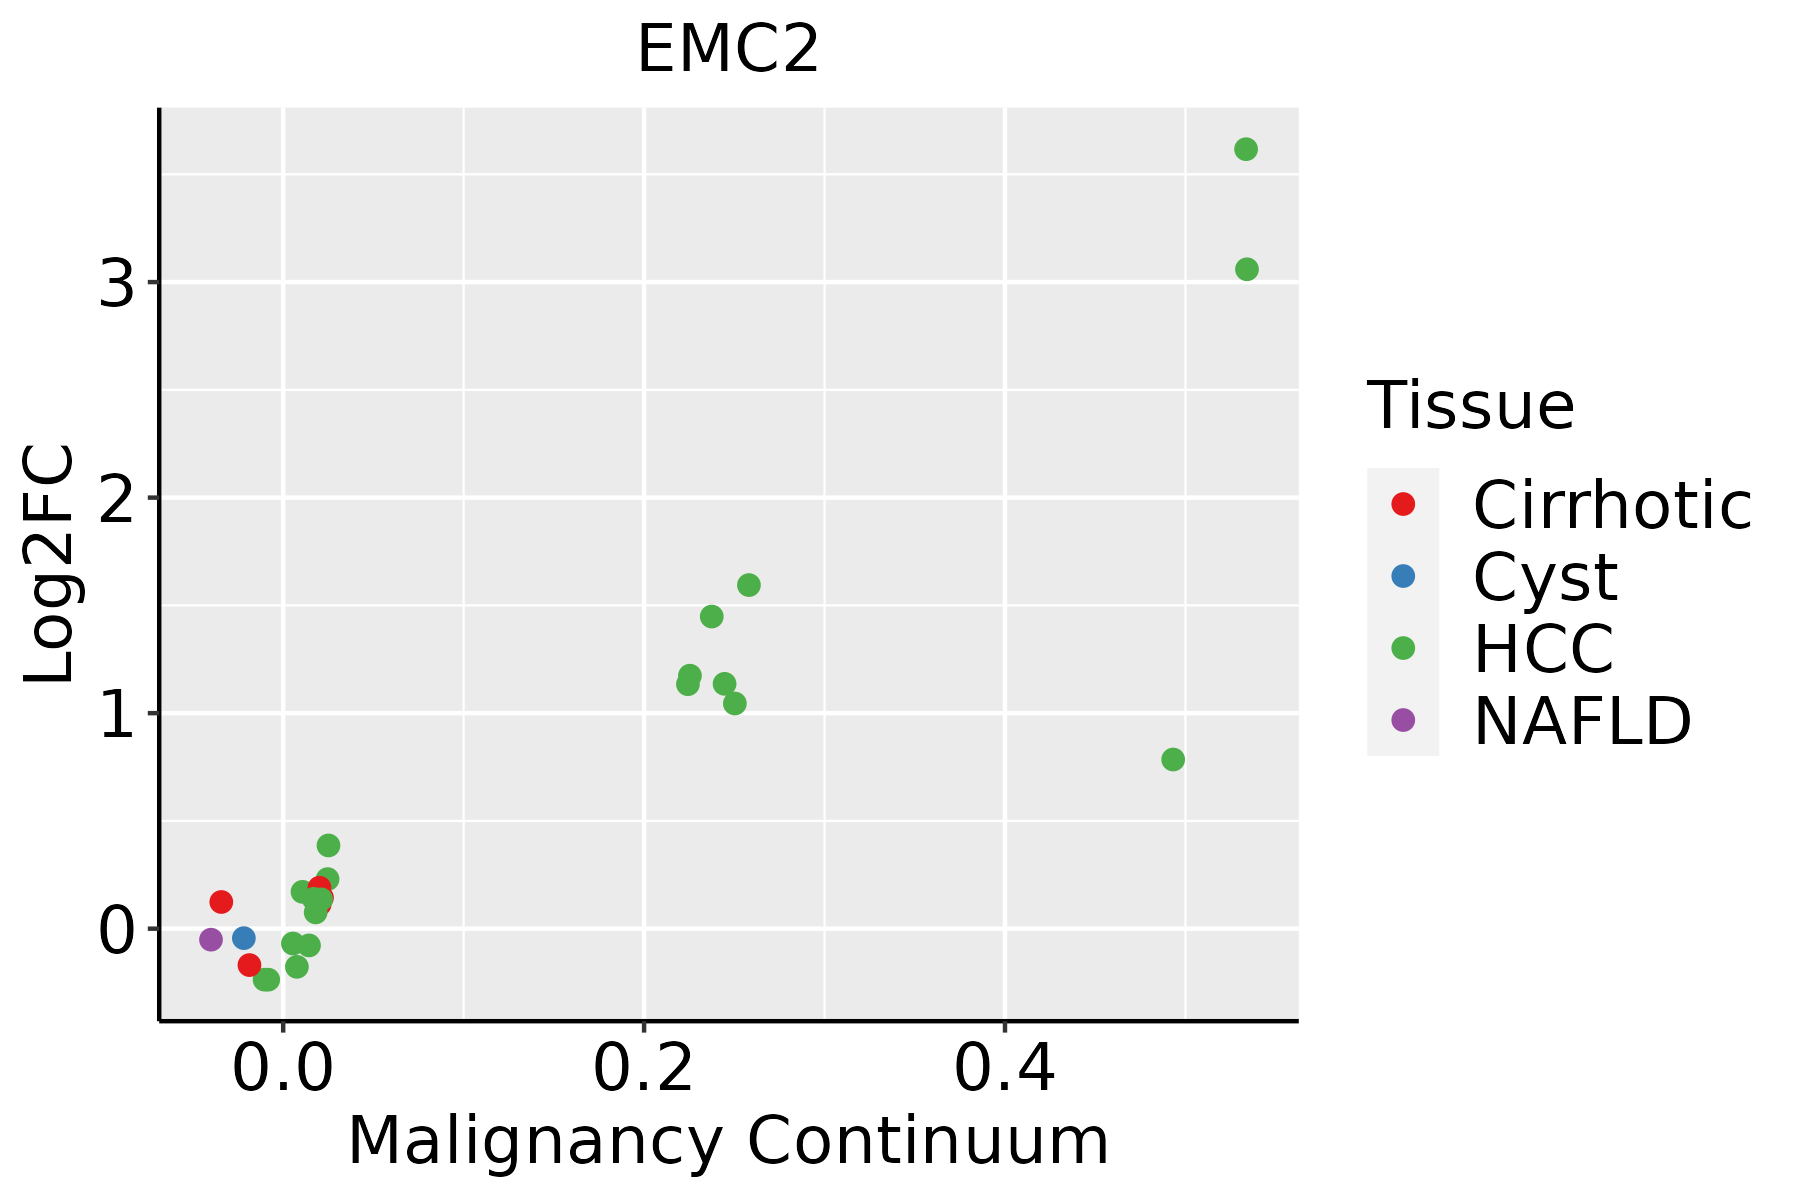 | HCC: Hepatocellular carcinoma |
| NAFLD: Non-alcoholic fatty liver disease | ||
| Oral Cavity |  | EOLP: Erosive Oral lichen planus |
| LP: leukoplakia | ||
| NEOLP: Non-erosive oral lichen planus | ||
| OSCC: Oral squamous cell carcinoma | ||
| Skin | 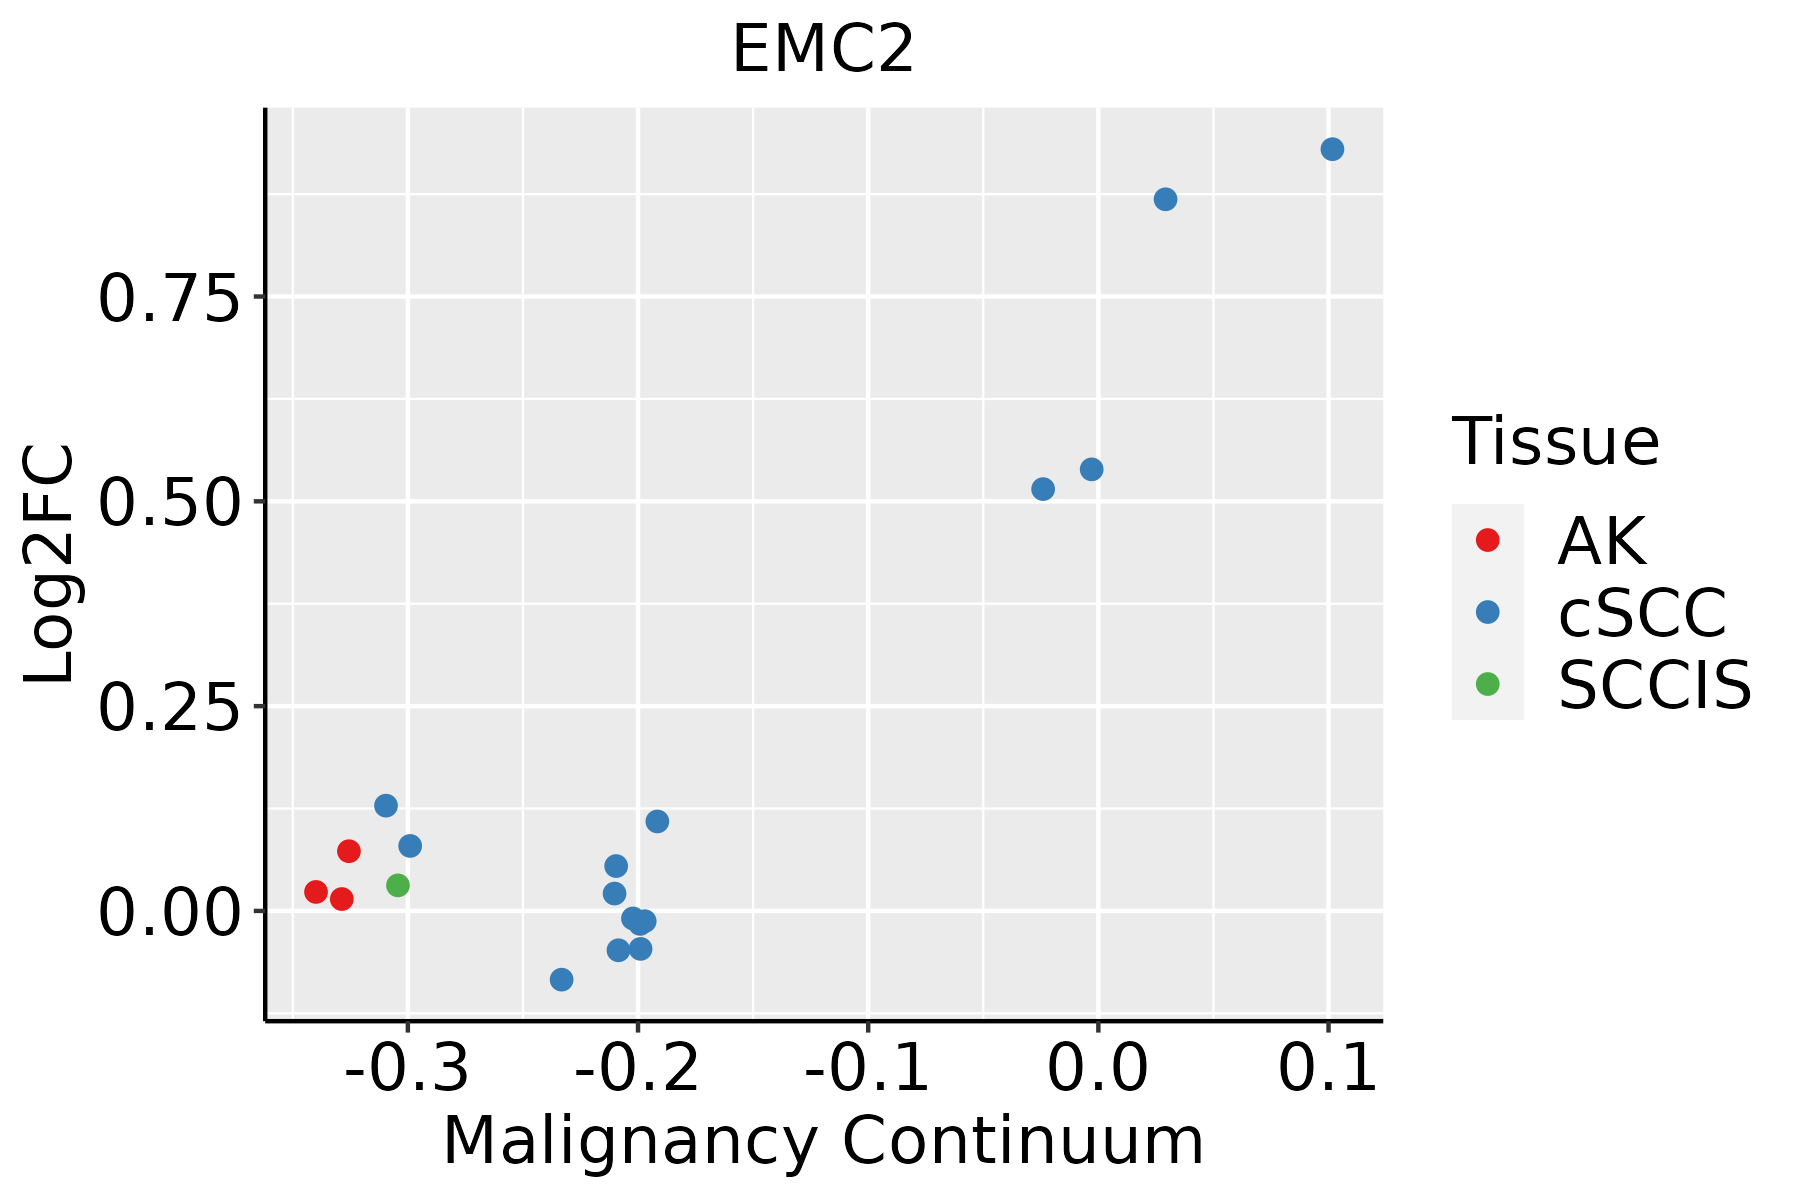 | AK: Actinic keratosis |
| cSCC: Cutaneous squamous cell carcinoma | ||
| SCCIS:squamous cell carcinoma in situ | ||
| Thyroid | 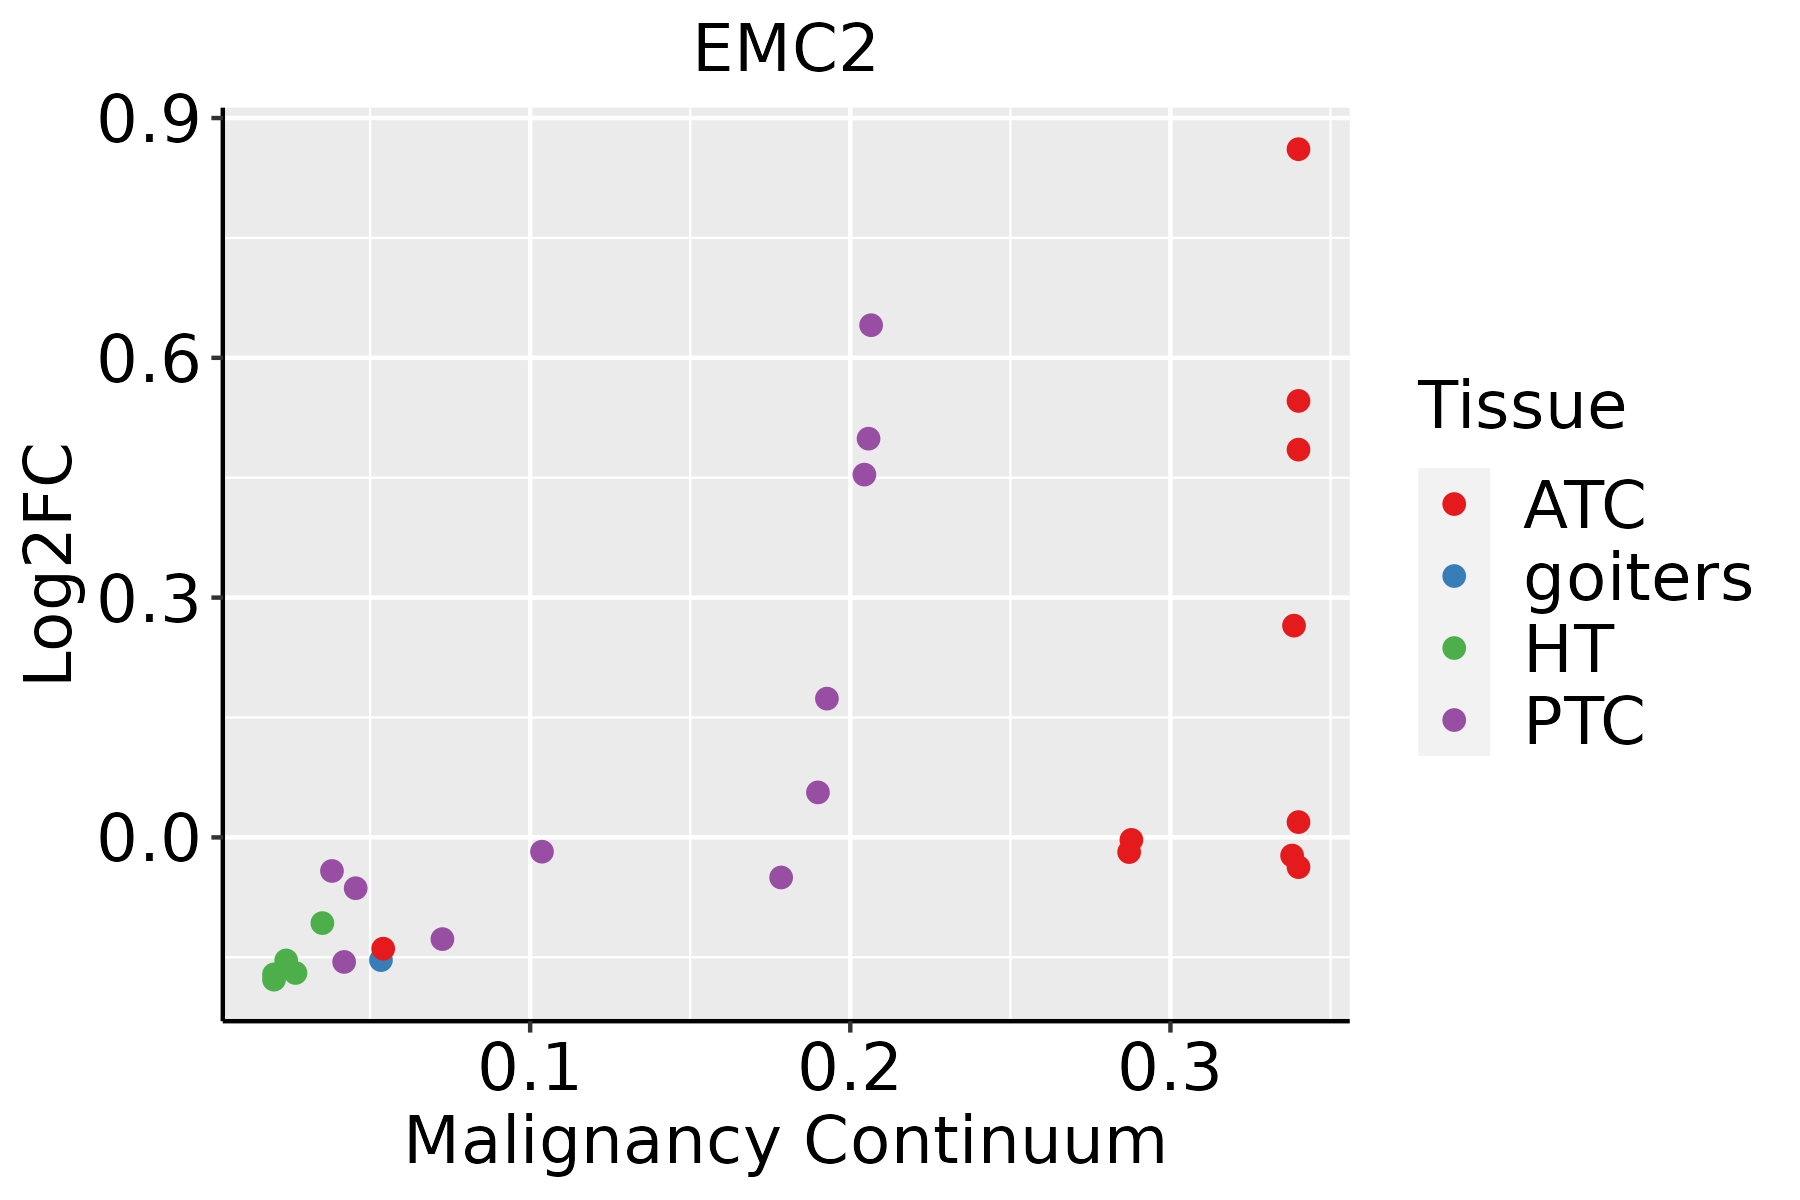 | ATC: Anaplastic thyroid cancer |
| HT: Hashimoto's thyroiditis | ||
| PTC: Papillary thyroid cancer |
| ∗log2FC in expression of this searched gene in stem-like cells from each diseased tissue sample relative to stem-like cells in normal samples in each tissue plotted against the malignancy continuum. Samples are colored based on if they are from different disease stage. |
Top |
Malignant transformation related pathway analysis |
| Find out the enriched GO biological processes and KEGG pathways involved in transition from healthy to precancer to cancer |
| Tissue | Disease Stage | Enriched GO biological Processes |
| Colorectum | AD |  |
| Colorectum | SER |  |
| Colorectum | MSS |  |
| Colorectum | MSI-H |  |
| Colorectum | FAP |  |
| ∗Top 15 enriched GO BP terms are showed in the bar plot of each disease state in each tissue. Each row represents a significant GO biological process which is colored according to the -log10(p.adjust). |
| Page: 1 2 3 4 5 6 7 8 9 |
| GO ID | Tissue | Disease Stage | Description | Gene Ratio | Bg Ratio | pvalue | p.adjust | Count |
| GO:0090150110 | Esophagus | ESCC | establishment of protein localization to membrane | 182/8552 | 260/18723 | 1.27e-15 | 8.19e-14 | 182 |
| GO:000702914 | Esophagus | ESCC | endoplasmic reticulum organization | 65/8552 | 87/18723 | 3.28e-08 | 6.08e-07 | 65 |
| GO:005120515 | Esophagus | ESCC | protein insertion into membrane | 46/8552 | 57/18723 | 5.90e-08 | 1.04e-06 | 46 |
| GO:004504812 | Esophagus | ESCC | protein insertion into ER membrane | 21/8552 | 22/18723 | 8.75e-07 | 1.13e-05 | 21 |
| GO:007181611 | Esophagus | ESCC | tail-anchored membrane protein insertion into ER membrane | 17/8552 | 17/18723 | 1.63e-06 | 1.95e-05 | 17 |
| GO:00450503 | Esophagus | ESCC | protein insertion into ER membrane by stop-transfer membrane-anchor sequence | 10/8552 | 10/18723 | 3.94e-04 | 2.26e-03 | 10 |
| GO:00901507 | Liver | Cirrhotic | establishment of protein localization to membrane | 123/4634 | 260/18723 | 1.85e-15 | 2.15e-13 | 123 |
| GO:00070292 | Liver | Cirrhotic | endoplasmic reticulum organization | 42/4634 | 87/18723 | 1.67e-06 | 3.22e-05 | 42 |
| GO:00512053 | Liver | Cirrhotic | protein insertion into membrane | 29/4634 | 57/18723 | 1.88e-05 | 2.53e-04 | 29 |
| GO:0045048 | Liver | Cirrhotic | protein insertion into ER membrane | 11/4634 | 22/18723 | 9.18e-03 | 4.21e-02 | 11 |
| GO:009015012 | Liver | HCC | establishment of protein localization to membrane | 168/7958 | 260/18723 | 4.07e-13 | 2.13e-11 | 168 |
| GO:000702911 | Liver | HCC | endoplasmic reticulum organization | 64/7958 | 87/18723 | 3.92e-09 | 1.04e-07 | 64 |
| GO:005120511 | Liver | HCC | protein insertion into membrane | 41/7958 | 57/18723 | 6.42e-06 | 7.83e-05 | 41 |
| GO:0071816 | Liver | HCC | tail-anchored membrane protein insertion into ER membrane | 15/7958 | 17/18723 | 1.31e-04 | 1.07e-03 | 15 |
| GO:00450481 | Liver | HCC | protein insertion into ER membrane | 18/7958 | 22/18723 | 1.91e-04 | 1.49e-03 | 18 |
| GO:0045050 | Liver | HCC | protein insertion into ER membrane by stop-transfer membrane-anchor sequence | 10/7958 | 10/18723 | 1.92e-04 | 1.49e-03 | 10 |
| GO:009015018 | Oral cavity | OSCC | establishment of protein localization to membrane | 163/7305 | 260/18723 | 7.13e-15 | 4.47e-13 | 163 |
| GO:00070294 | Oral cavity | OSCC | endoplasmic reticulum organization | 58/7305 | 87/18723 | 1.59e-07 | 2.61e-06 | 58 |
| GO:00512056 | Oral cavity | OSCC | protein insertion into membrane | 40/7305 | 57/18723 | 1.81e-06 | 2.34e-05 | 40 |
| GO:00450502 | Oral cavity | OSCC | protein insertion into ER membrane by stop-transfer membrane-anchor sequence | 10/7305 | 10/18723 | 8.14e-05 | 6.26e-04 | 10 |
| Page: 1 2 3 |
| Pathway ID | Tissue | Disease Stage | Description | Gene Ratio | Bg Ratio | pvalue | p.adjust | qvalue | Count |
| Page: 1 |
Top |
Cell-cell communication analysis |
| Identification of potential cell-cell interactions between two cell types and their ligand-receptor pairs for different disease states |
| Ligand | Receptor | LRpair | Pathway | Tissue | Disease Stage |
| Page: 1 |
Top |
Single-cell gene regulatory network inference analysis |
| Find out the significant the regulons (TFs) and the target genes of each regulon across cell types for different disease states |
| TF | Cell Type | Tissue | Disease Stage | Target Gene | RSS | Regulon Activity |
| ∗The dot plots of a searched regulon are shown for all cell subpopulations in each disease state of each tissue based on the regulon specific score inferred using pySCENIC and by calculating the average expression. |
| Page: 1 |
Top |
Somatic mutation of malignant transformation related genes |
| Annotation of somatic variants for genes involved in malignant transformation |
| Hugo Symbol | Variant Class | Variant Classification | dbSNP RS | HGVSc | HGVSp | HGVSp Short | SWISSPROT | BIOTYPE | SIFT | PolyPhen | Tumor Sample Barcode | Tissue | Histology | Sex | Age | Stage | Therapy Types | Drugs | Outcome |
| EMC2 | SNV | Missense_Mutation | c.169G>A | p.Glu57Lys | p.E57K | Q15006 | protein_coding | deleterious(0) | probably_damaging(0.994) | TCGA-A7-A26H-01 | Breast | breast invasive carcinoma | Female | >=65 | I/II | Hormone Therapy | anastrozole | PD | |
| EMC2 | SNV | Missense_Mutation | novel | c.844N>G | p.Leu282Val | p.L282V | Q15006 | protein_coding | tolerated(0.85) | benign(0) | TCGA-A8-A099-01 | Breast | breast invasive carcinoma | Female | >=65 | III/IV | Hormone Therapy | exemestane | SD |
| EMC2 | SNV | Missense_Mutation | c.458N>C | p.Gly153Ala | p.G153A | Q15006 | protein_coding | tolerated(0.46) | benign(0.007) | TCGA-AC-A23H-01 | Breast | breast invasive carcinoma | Female | >=65 | I/II | Unknown | Unknown | PD | |
| EMC2 | SNV | Missense_Mutation | c.601N>G | p.Thr201Ala | p.T201A | Q15006 | protein_coding | deleterious(0) | possibly_damaging(0.751) | TCGA-D8-A1XK-01 | Breast | breast invasive carcinoma | Female | <65 | I/II | Chemotherapy | doxorubicine+cyclophosphamide | SD | |
| EMC2 | SNV | Missense_Mutation | novel | c.844N>A | p.Leu282Ile | p.L282I | Q15006 | protein_coding | tolerated(0.63) | benign(0.011) | TCGA-DG-A2KK-01 | Cervix | cervical & endocervical cancer | Female | <65 | III/IV | Chemotherapy | cisplatin | SD |
| EMC2 | SNV | Missense_Mutation | c.842N>T | p.Ser281Phe | p.S281F | Q15006 | protein_coding | deleterious(0.01) | possibly_damaging(0.648) | TCGA-EA-A3QD-01 | Cervix | cervical & endocervical cancer | Female | <65 | III/IV | Chemotherapy | cisplatin | CR | |
| EMC2 | SNV | Missense_Mutation | c.202N>G | p.Arg68Gly | p.R68G | Q15006 | protein_coding | deleterious(0.03) | benign(0.323) | TCGA-AA-3715-01 | Colorectum | colon adenocarcinoma | Male | >=65 | I/II | Unknown | Unknown | PD | |
| EMC2 | SNV | Missense_Mutation | c.187N>A | p.Ala63Thr | p.A63T | Q15006 | protein_coding | deleterious(0) | possibly_damaging(0.711) | TCGA-AA-3833-01 | Colorectum | colon adenocarcinoma | Female | <65 | I/II | Unknown | Unknown | SD | |
| EMC2 | SNV | Missense_Mutation | c.635G>T | p.Arg212Ile | p.R212I | Q15006 | protein_coding | deleterious(0.03) | probably_damaging(0.923) | TCGA-AA-A010-01 | Colorectum | colon adenocarcinoma | Female | <65 | I/II | Chemotherapy | folinic | CR | |
| EMC2 | SNV | Missense_Mutation | novel | c.809N>G | p.Phe270Cys | p.F270C | Q15006 | protein_coding | tolerated(0.19) | benign(0.053) | TCGA-F5-6814-01 | Colorectum | rectum adenocarcinoma | Male | <65 | I/II | Unknown | Unknown | SD |
| Page: 1 2 3 4 5 |
Top |
Related drugs of malignant transformation related genes |
| Identification of chemicals and drugs interact with genes involved in malignant transfromation |
| (DGIdb 4.0) |
| Entrez ID | Symbol | Category | Interaction Types | Drug Claim Name | Drug Name | PMIDs |
| Page: 1 |

Copyright 2023-Present -The University of Texas Health Science Center at Houston |