
|
|||||
|
 | |
| |
| |
| |
| |
| |
|
Gene: EMC10 |
Gene summary for EMC10 |
| Gene information | Species | Human | Gene symbol | EMC10 | Gene ID | 284361 |
| Gene name | ER membrane protein complex subunit 10 | |
| Gene Alias | C19orf63 | |
| Cytomap | 19q13.33 | |
| Gene Type | protein-coding | GO ID | GO:0000165 | UniProtAcc | Q5UCC4 |
Top |
Malignant transformation analysis |
| Identification of the aberrant gene expression in precancerous and cancerous lesions by comparing the gene expression of stem-like cells in diseased tissues with normal stem cells |
| Entrez ID | Symbol | Replicates | Species | Organ | Tissue | Adj P-value | Log2FC | Malignancy |
| 284361 | EMC10 | AEH-subject1 | Human | Endometrium | AEH | 9.77e-09 | -2.52e-01 | -0.3059 |
| 284361 | EMC10 | AEH-subject2 | Human | Endometrium | AEH | 5.29e-14 | -3.15e-01 | -0.2525 |
| 284361 | EMC10 | AEH-subject3 | Human | Endometrium | AEH | 2.84e-13 | -3.45e-01 | -0.2576 |
| 284361 | EMC10 | AEH-subject4 | Human | Endometrium | AEH | 1.01e-14 | -4.47e-01 | -0.2657 |
| 284361 | EMC10 | AEH-subject5 | Human | Endometrium | AEH | 4.56e-18 | -4.49e-01 | -0.2953 |
| 284361 | EMC10 | EEC-subject1 | Human | Endometrium | EEC | 1.28e-14 | -3.32e-01 | -0.2682 |
| 284361 | EMC10 | EEC-subject2 | Human | Endometrium | EEC | 5.85e-17 | -3.91e-01 | -0.2607 |
| 284361 | EMC10 | EEC-subject3 | Human | Endometrium | EEC | 1.64e-34 | -4.22e-01 | -0.2525 |
| 284361 | EMC10 | EEC-subject4 | Human | Endometrium | EEC | 1.53e-11 | -4.03e-01 | -0.2571 |
| 284361 | EMC10 | EEC-subject5 | Human | Endometrium | EEC | 1.46e-07 | -2.87e-01 | -0.249 |
| 284361 | EMC10 | GSM5276934 | Human | Endometrium | EEC | 7.12e-15 | -3.38e-01 | -0.0913 |
| 284361 | EMC10 | GSM5276937 | Human | Endometrium | EEC | 1.87e-15 | -4.21e-01 | -0.0897 |
| 284361 | EMC10 | GSM6177620_NYU_UCEC1_lib1_lib1 | Human | Endometrium | EEC | 4.34e-32 | -3.04e-01 | -0.1869 |
| 284361 | EMC10 | GSM6177620_NYU_UCEC1_lib2_lib2 | Human | Endometrium | EEC | 4.25e-32 | -2.28e-01 | -0.1875 |
| 284361 | EMC10 | GSM6177620_NYU_UCEC1_lib3_lib3 | Human | Endometrium | EEC | 2.00e-39 | -1.79e-01 | -0.1883 |
| 284361 | EMC10 | GSM6177621_NYU_UCEC2_lib1_lib1 | Human | Endometrium | EEC | 1.19e-30 | -1.24e-01 | -0.1934 |
| 284361 | EMC10 | GSM6177622_NYU_UCEC3_lib1_lib1 | Human | Endometrium | EEC | 1.64e-47 | -2.00e-01 | -0.1917 |
| 284361 | EMC10 | GSM6177622_NYU_UCEC3_lib2_lib2 | Human | Endometrium | EEC | 7.44e-50 | -2.28e-01 | -0.1916 |
| 284361 | EMC10 | GSM6177623_NYU_UCEC3_Vis | Human | Endometrium | EEC | 1.39e-04 | 1.05e-01 | -0.1269 |
| 284361 | EMC10 | LZE2T | Human | Esophagus | ESCC | 2.31e-04 | 8.59e-01 | 0.082 |
| Page: 1 2 3 4 5 6 7 8 |
| Tissue | Expression Dynamics | Abbreviation |
| Endometrium | 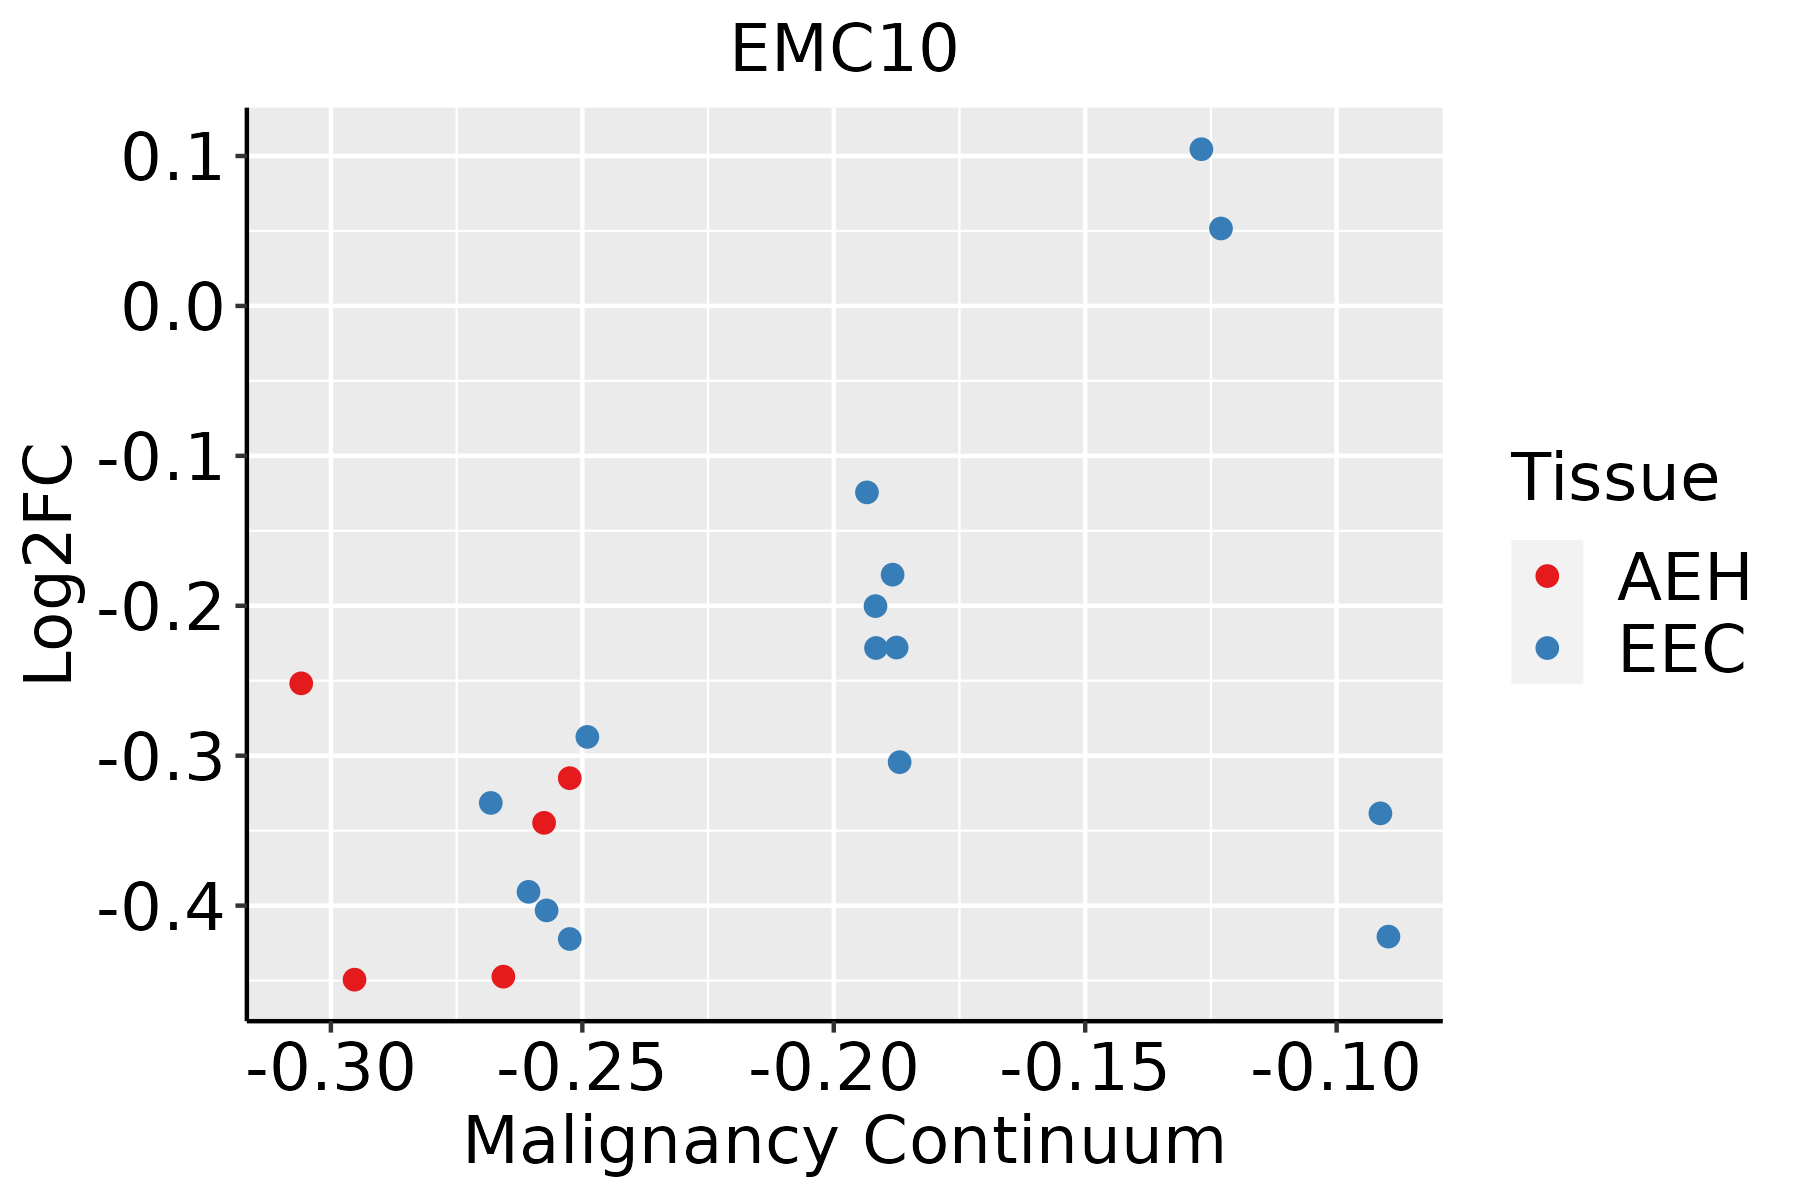 | AEH: Atypical endometrial hyperplasia |
| EEC: Endometrioid Cancer | ||
| Esophagus | 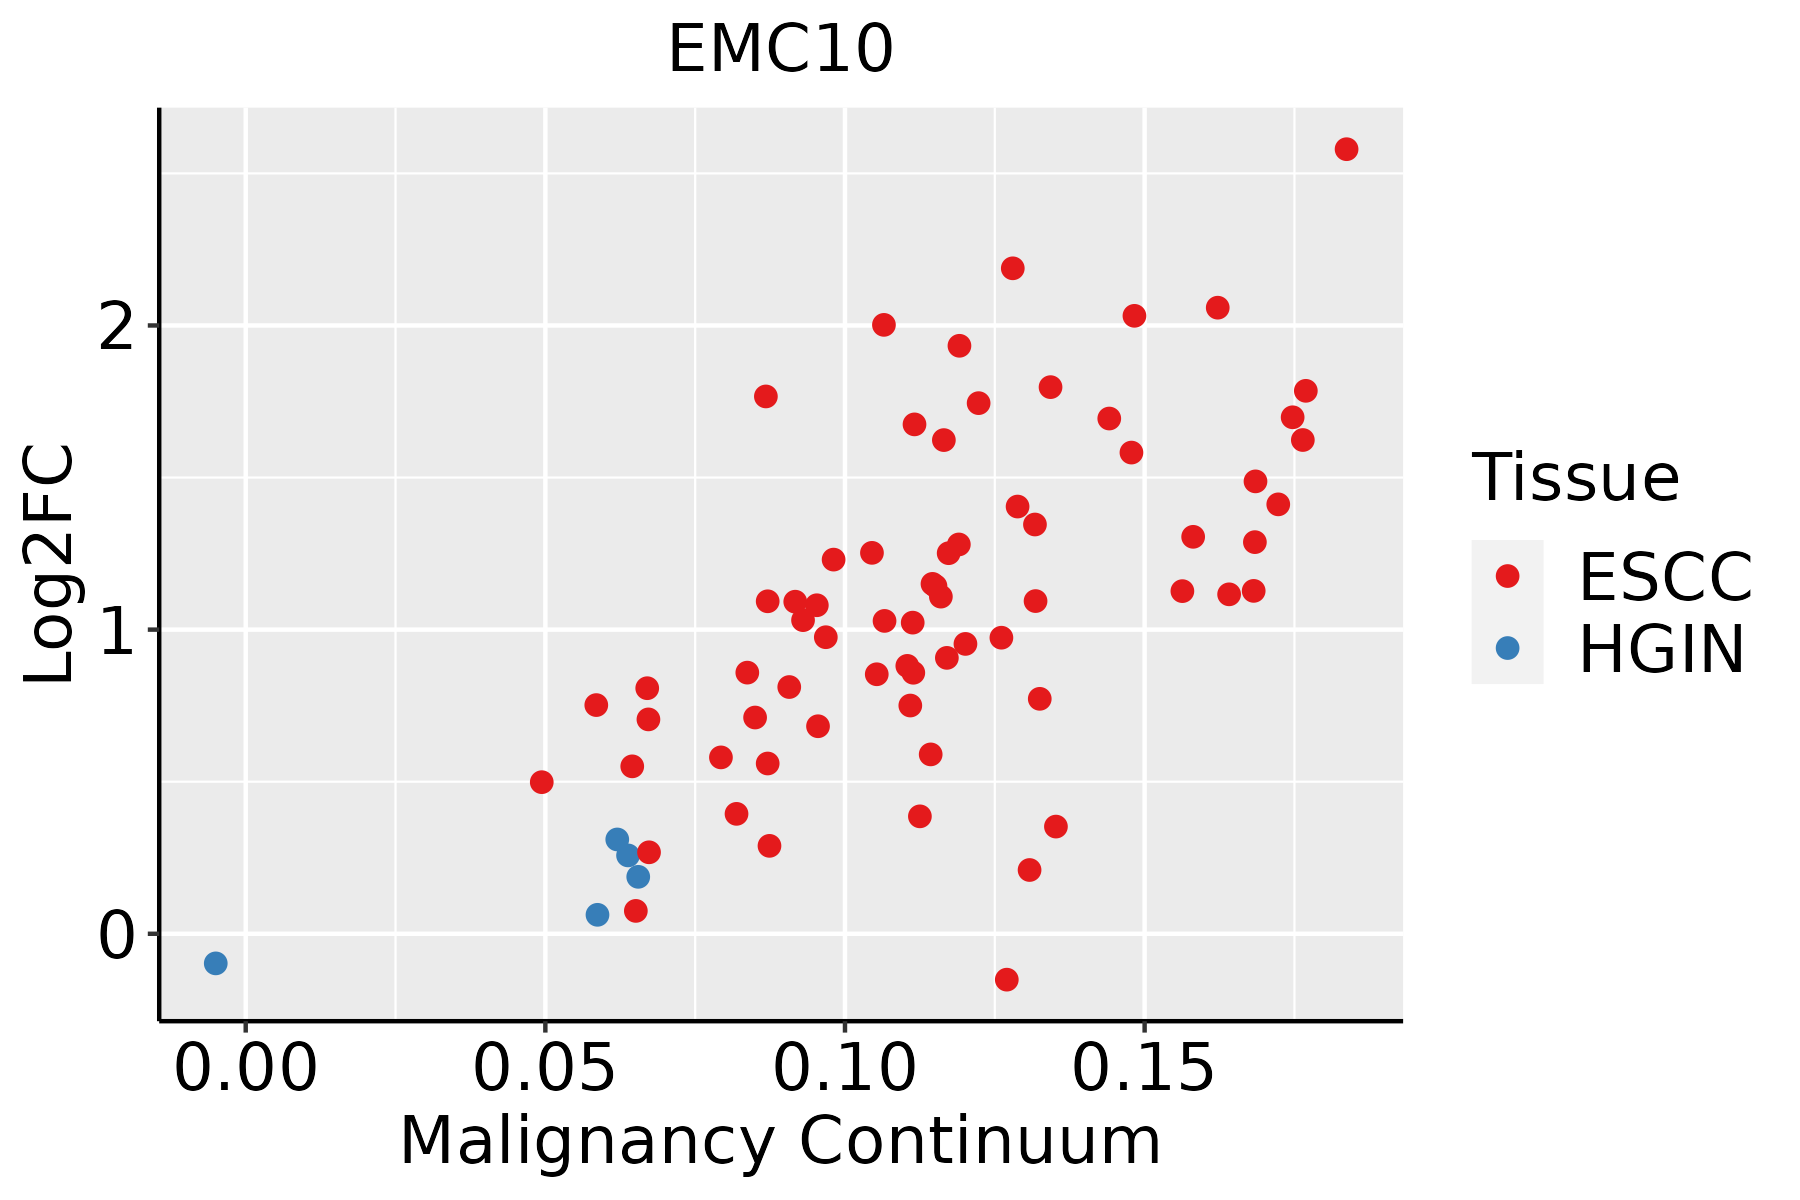 | ESCC: Esophageal squamous cell carcinoma |
| HGIN: High-grade intraepithelial neoplasias | ||
| LGIN: Low-grade intraepithelial neoplasias | ||
| Liver | 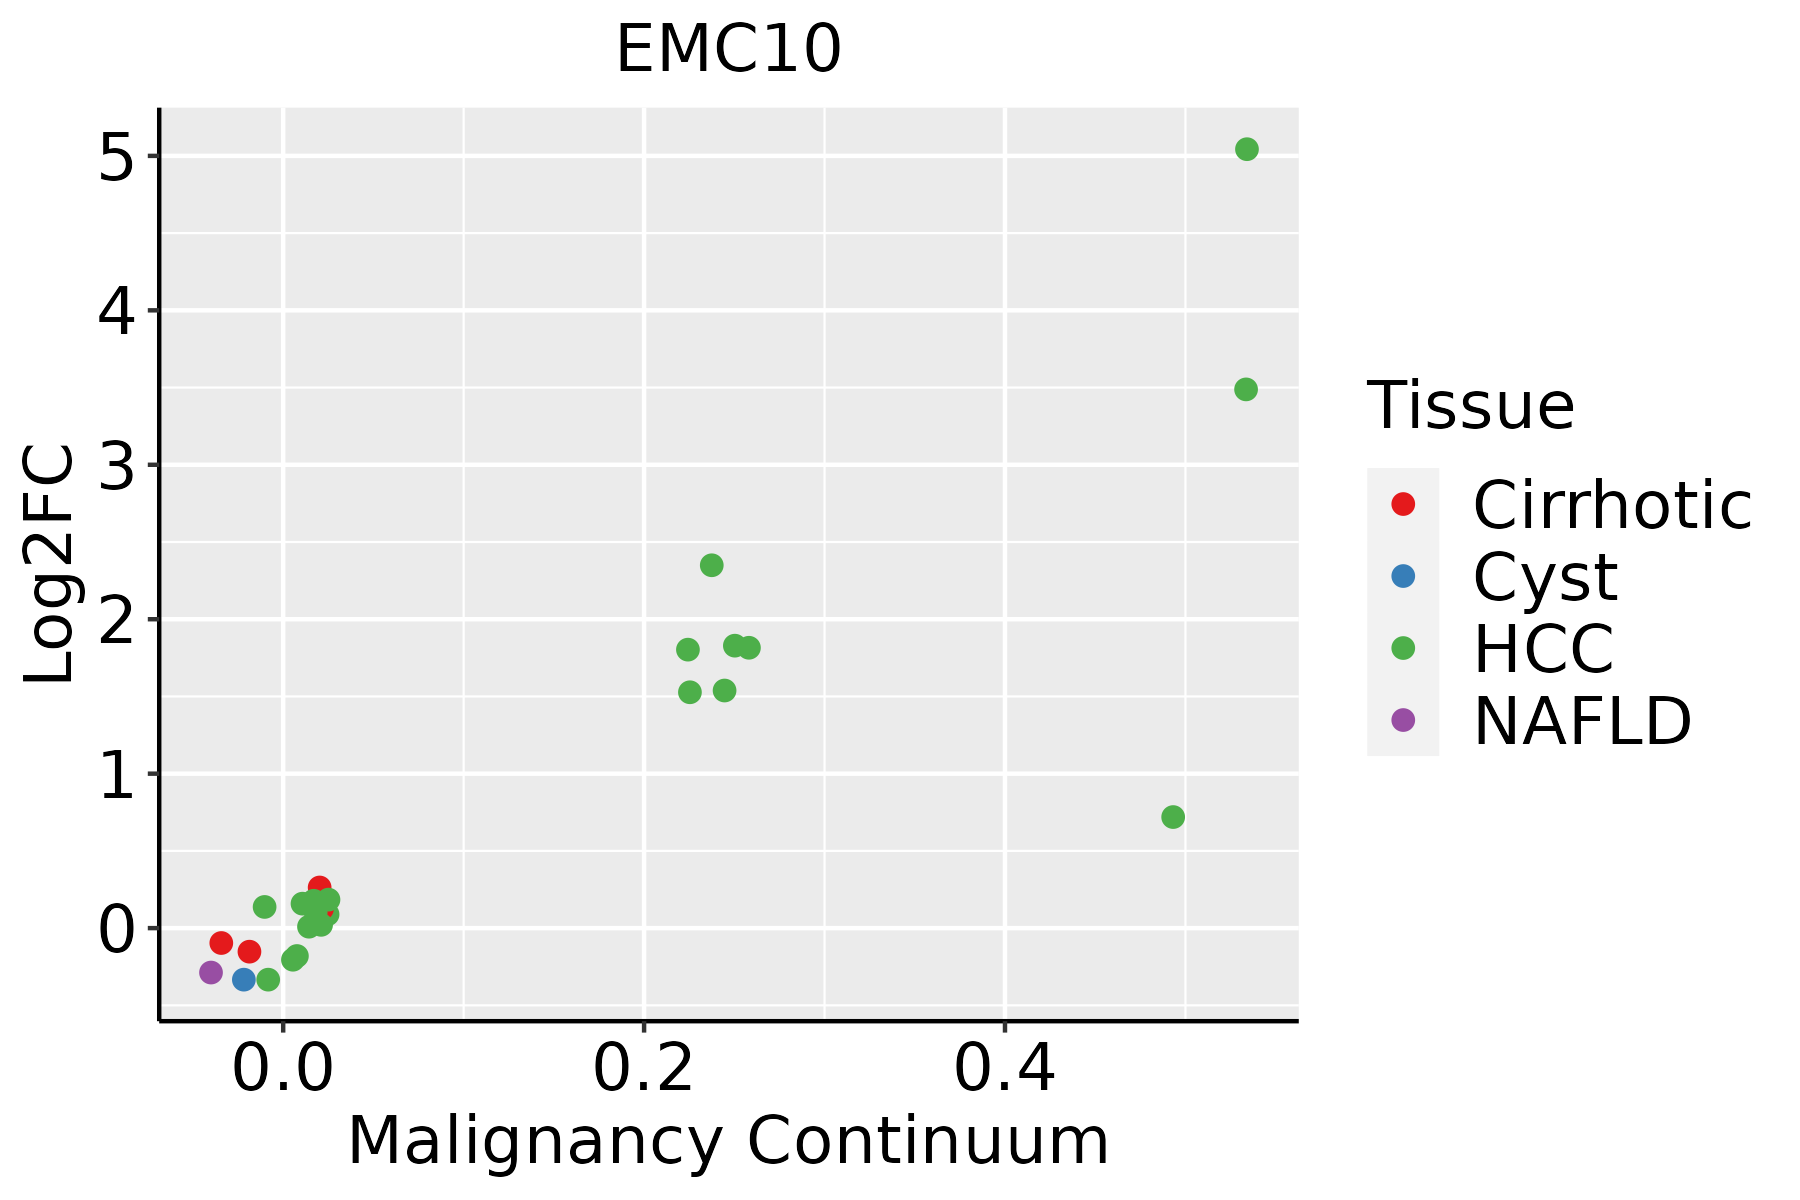 | HCC: Hepatocellular carcinoma |
| NAFLD: Non-alcoholic fatty liver disease | ||
| Oral Cavity | 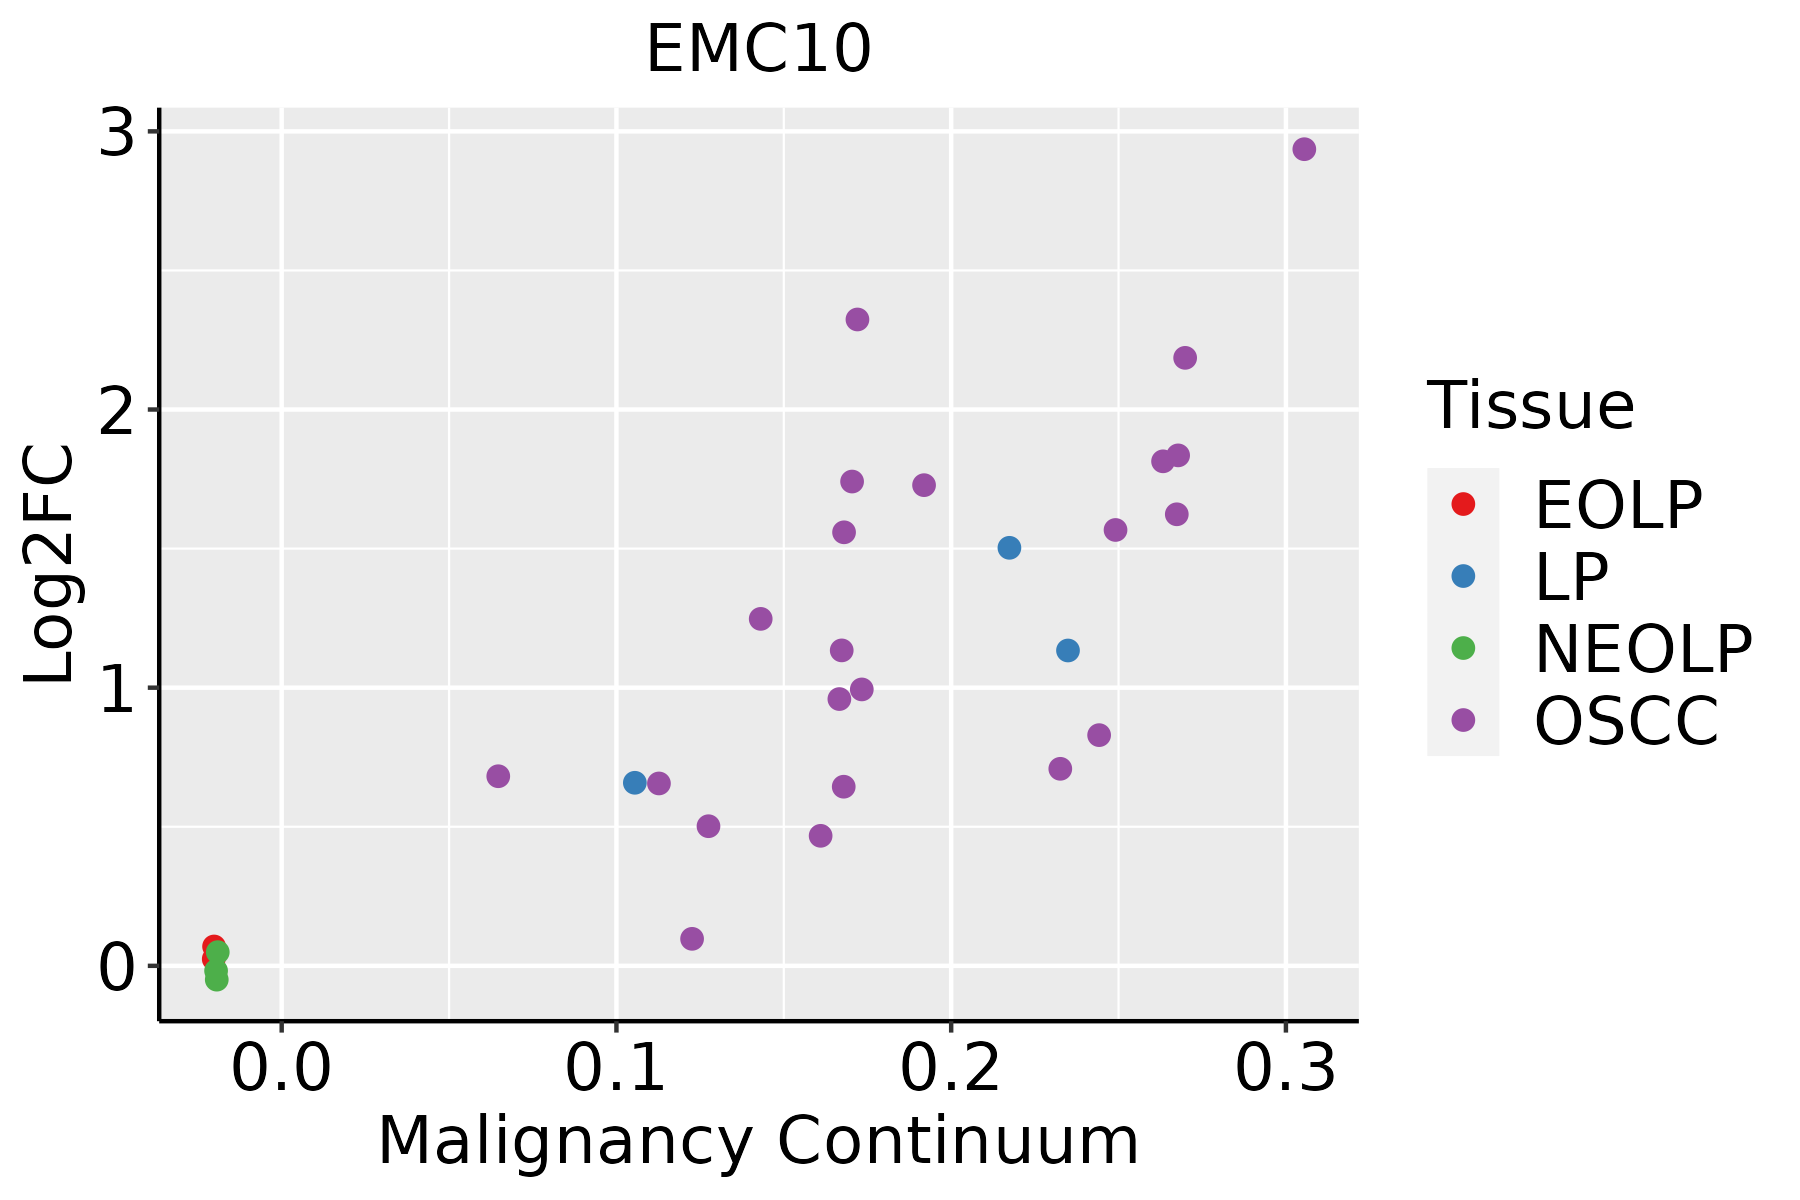 | EOLP: Erosive Oral lichen planus |
| LP: leukoplakia | ||
| NEOLP: Non-erosive oral lichen planus | ||
| OSCC: Oral squamous cell carcinoma | ||
| Skin | 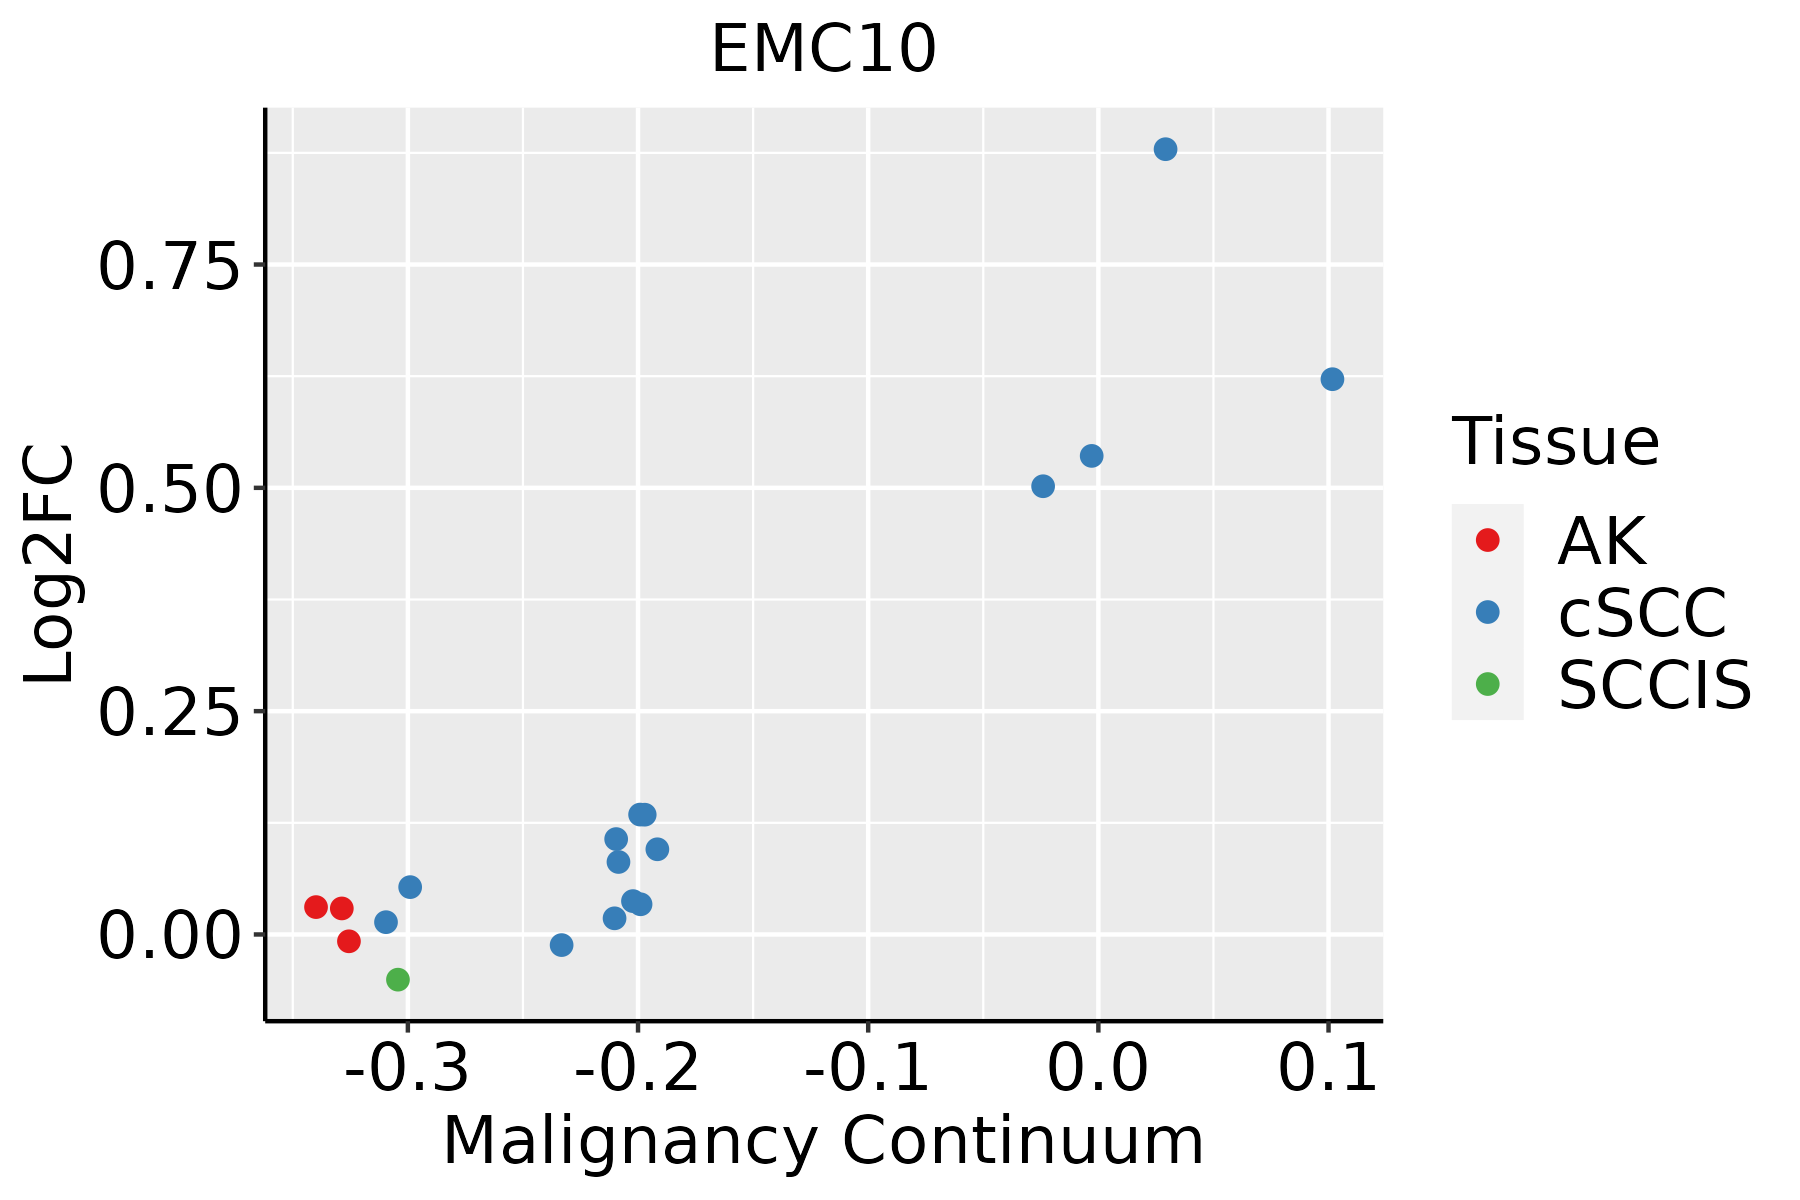 | AK: Actinic keratosis |
| cSCC: Cutaneous squamous cell carcinoma | ||
| SCCIS:squamous cell carcinoma in situ | ||
| Thyroid | 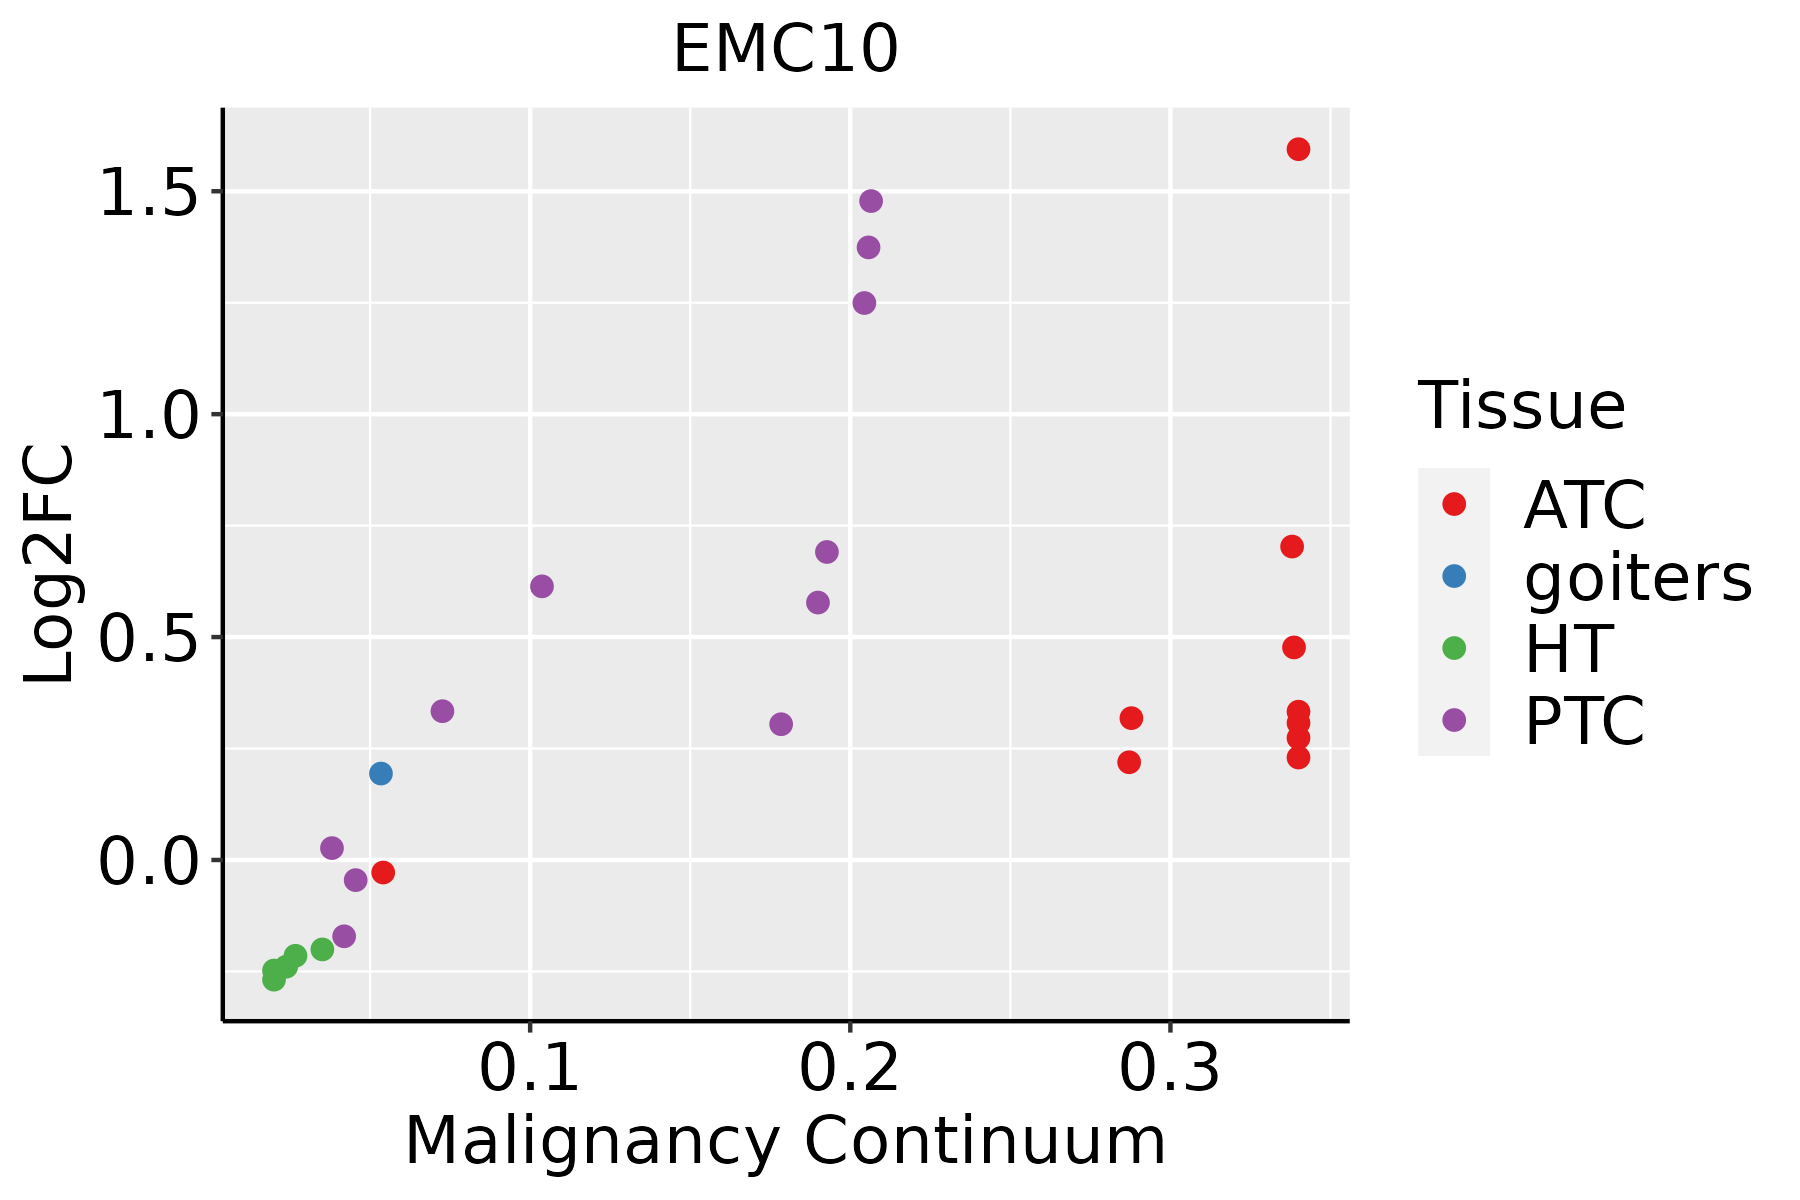 | ATC: Anaplastic thyroid cancer |
| HT: Hashimoto's thyroiditis | ||
| PTC: Papillary thyroid cancer |
| ∗log2FC in expression of this searched gene in stem-like cells from each diseased tissue sample relative to stem-like cells in normal samples in each tissue plotted against the malignancy continuum. Samples are colored based on if they are from different disease stage. |
Top |
Malignant transformation related pathway analysis |
| Find out the enriched GO biological processes and KEGG pathways involved in transition from healthy to precancer to cancer |
| Tissue | Disease Stage | Enriched GO biological Processes |
| Colorectum | AD |  |
| Colorectum | SER |  |
| Colorectum | MSS |  |
| Colorectum | MSI-H |  |
| Colorectum | FAP |  |
| ∗Top 15 enriched GO BP terms are showed in the bar plot of each disease state in each tissue. Each row represents a significant GO biological process which is colored according to the -log10(p.adjust). |
| Page: 1 2 3 4 5 6 7 8 9 |
| GO ID | Tissue | Disease Stage | Description | Gene Ratio | Bg Ratio | pvalue | p.adjust | Count |
| GO:000166710 | Endometrium | AEH | ameboidal-type cell migration | 90/2100 | 475/18723 | 3.73e-07 | 1.57e-05 | 90 |
| GO:00506738 | Endometrium | AEH | epithelial cell proliferation | 84/2100 | 437/18723 | 4.88e-07 | 1.94e-05 | 84 |
| GO:009013014 | Endometrium | AEH | tissue migration | 73/2100 | 365/18723 | 5.79e-07 | 2.20e-05 | 73 |
| GO:009013214 | Endometrium | AEH | epithelium migration | 72/2100 | 360/18723 | 6.90e-07 | 2.55e-05 | 72 |
| GO:001063114 | Endometrium | AEH | epithelial cell migration | 71/2100 | 357/18723 | 1.02e-06 | 3.52e-05 | 71 |
| GO:001063214 | Endometrium | AEH | regulation of epithelial cell migration | 60/2100 | 292/18723 | 2.31e-06 | 6.77e-05 | 60 |
| GO:00506788 | Endometrium | AEH | regulation of epithelial cell proliferation | 73/2100 | 381/18723 | 3.04e-06 | 8.44e-05 | 73 |
| GO:001063410 | Endometrium | AEH | positive regulation of epithelial cell migration | 41/2100 | 176/18723 | 3.79e-06 | 1.01e-04 | 41 |
| GO:00514039 | Endometrium | AEH | stress-activated MAPK cascade | 50/2100 | 239/18723 | 9.33e-06 | 2.18e-04 | 50 |
| GO:00310989 | Endometrium | AEH | stress-activated protein kinase signaling cascade | 51/2100 | 247/18723 | 1.12e-05 | 2.52e-04 | 51 |
| GO:00328728 | Endometrium | AEH | regulation of stress-activated MAPK cascade | 42/2100 | 192/18723 | 1.53e-05 | 3.23e-04 | 42 |
| GO:00380665 | Endometrium | AEH | p38MAPK cascade | 18/2100 | 55/18723 | 1.77e-05 | 3.65e-04 | 18 |
| GO:00435428 | Endometrium | AEH | endothelial cell migration | 55/2100 | 279/18723 | 2.11e-05 | 4.15e-04 | 55 |
| GO:00105955 | Endometrium | AEH | positive regulation of endothelial cell migration | 32/2100 | 133/18723 | 2.12e-05 | 4.15e-04 | 32 |
| GO:00434105 | Endometrium | AEH | positive regulation of MAPK cascade | 84/2100 | 480/18723 | 2.19e-05 | 4.25e-04 | 84 |
| GO:00703028 | Endometrium | AEH | regulation of stress-activated protein kinase signaling cascade | 42/2100 | 195/18723 | 2.27e-05 | 4.35e-04 | 42 |
| GO:00105945 | Endometrium | AEH | regulation of endothelial cell migration | 47/2100 | 232/18723 | 4.02e-05 | 6.91e-04 | 47 |
| GO:00506795 | Endometrium | AEH | positive regulation of epithelial cell proliferation | 43/2100 | 207/18723 | 4.55e-05 | 7.61e-04 | 43 |
| GO:009015010 | Endometrium | AEH | establishment of protein localization to membrane | 51/2100 | 260/18723 | 4.74e-05 | 7.85e-04 | 51 |
| GO:19007443 | Endometrium | AEH | regulation of p38MAPK cascade | 15/2100 | 47/18723 | 1.21e-04 | 1.67e-03 | 15 |
| Page: 1 2 3 4 5 6 7 8 9 10 11 12 |
| Pathway ID | Tissue | Disease Stage | Description | Gene Ratio | Bg Ratio | pvalue | p.adjust | qvalue | Count |
| Page: 1 |
Top |
Cell-cell communication analysis |
| Identification of potential cell-cell interactions between two cell types and their ligand-receptor pairs for different disease states |
| Ligand | Receptor | LRpair | Pathway | Tissue | Disease Stage |
| Page: 1 |
Top |
Single-cell gene regulatory network inference analysis |
| Find out the significant the regulons (TFs) and the target genes of each regulon across cell types for different disease states |
| TF | Cell Type | Tissue | Disease Stage | Target Gene | RSS | Regulon Activity |
| ∗The dot plots of a searched regulon are shown for all cell subpopulations in each disease state of each tissue based on the regulon specific score inferred using pySCENIC and by calculating the average expression. |
| Page: 1 |
Top |
Somatic mutation of malignant transformation related genes |
| Annotation of somatic variants for genes involved in malignant transformation |
| Hugo Symbol | Variant Class | Variant Classification | dbSNP RS | HGVSc | HGVSp | HGVSp Short | SWISSPROT | BIOTYPE | SIFT | PolyPhen | Tumor Sample Barcode | Tissue | Histology | Sex | Age | Stage | Therapy Types | Drugs | Outcome |
| EMC10 | SNV | Missense_Mutation | novel | c.664N>C | p.Phe222Leu | p.F222L | Q5UCC4 | protein_coding | deleterious(0.01) | probably_damaging(0.997) | TCGA-A8-A08G-01 | Breast | breast invasive carcinoma | Female | <65 | I/II | Chemotherapy | 5-fluorouracil | CR |
| EMC10 | SNV | Missense_Mutation | rs369893864 | c.551N>T | p.Ser184Leu | p.S184L | Q5UCC4 | protein_coding | deleterious(0.01) | possibly_damaging(0.508) | TCGA-AR-A0TT-01 | Breast | breast invasive carcinoma | Female | <65 | III/IV | Chemotherapy | doxorubicin | SD |
| EMC10 | SNV | Missense_Mutation | rs200217945 | c.610C>T | p.Arg204Cys | p.R204C | Q5UCC4 | protein_coding | deleterious(0) | probably_damaging(0.917) | TCGA-EA-A410-01 | Cervix | cervical & endocervical cancer | Female | <65 | I/II | Unknown | Unknown | SD |
| EMC10 | SNV | Missense_Mutation | rs369893864 | c.551C>T | p.Ser184Leu | p.S184L | Q5UCC4 | protein_coding | deleterious(0.01) | possibly_damaging(0.508) | TCGA-Q1-A73O-01 | Cervix | cervical & endocervical cancer | Female | <65 | I/II | Chemotherapy | cisplatin | CR |
| EMC10 | SNV | Missense_Mutation | novel | c.526N>A | p.Val176Met | p.V176M | Q5UCC4 | protein_coding | tolerated(0.1) | probably_damaging(0.916) | TCGA-VS-A9UB-01 | Cervix | cervical & endocervical cancer | Female | <65 | I/II | Chemotherapy | cisplatin | CR |
| EMC10 | SNV | Missense_Mutation | rs200217945 | c.610N>T | p.Arg204Cys | p.R204C | Q5UCC4 | protein_coding | deleterious(0) | probably_damaging(0.917) | TCGA-AA-3713-01 | Colorectum | colon adenocarcinoma | Male | >=65 | III/IV | Chemotherapy | 5-fluorouracil | PR |
| EMC10 | SNV | Missense_Mutation | c.487N>G | p.Thr163Ala | p.T163A | Q5UCC4 | protein_coding | tolerated(0.13) | benign(0.067) | TCGA-CK-4951-01 | Colorectum | colon adenocarcinoma | Female | >=65 | I/II | Unknown | Unknown | PD | |
| EMC10 | deletion | Frame_Shift_Del | novel | c.578delN | p.Pro194GlnfsTer45 | p.P194Qfs*45 | Q5UCC4 | protein_coding | TCGA-A6-5661-01 | Colorectum | colon adenocarcinoma | Female | >=65 | I/II | Unknown | Unknown | SD | ||
| EMC10 | SNV | Missense_Mutation | novel | c.152C>T | p.Thr51Met | p.T51M | Q5UCC4 | protein_coding | tolerated(0.09) | possibly_damaging(0.556) | TCGA-A5-A0G2-01 | Endometrium | uterine corpus endometrioid carcinoma | Female | <65 | III/IV | Unknown | Unknown | SD |
| EMC10 | SNV | Missense_Mutation | novel | c.370G>A | p.Ala124Thr | p.A124T | Q5UCC4 | protein_coding | tolerated(0.37) | benign(0.012) | TCGA-A5-A0G2-01 | Endometrium | uterine corpus endometrioid carcinoma | Female | <65 | III/IV | Unknown | Unknown | SD |
| Page: 1 2 3 |
Top |
Related drugs of malignant transformation related genes |
| Identification of chemicals and drugs interact with genes involved in malignant transfromation |
| (DGIdb 4.0) |
| Entrez ID | Symbol | Category | Interaction Types | Drug Claim Name | Drug Name | PMIDs |
| Page: 1 |

Copyright 2023-Present -The University of Texas Health Science Center at Houston |