Schematic overview of the cellular and molecular mechanisms involved in the cancer progression, including the proposed cellular and molecular mechanisms in cancer cells trajectory. AT1: alveolar type 1 cells; AT2: alveolar type 2 cells; AAH: atypical adenomatous hyperplasia; AIS: adenocarcinoma in situ; MIA: minimally invasive adenocarcinoma; IA: invasive adenocarcinoma; EMT: epithelial-mesenchymal transition

Home

Download

Statistics

Help

Contact

Center for Computational Systems Medicine
leaf

Gene summary

leaf

Malignant transformation analysis

leaf

Malignant transformation related pathway analysis

leaf

Cell-cell communication analysis

leaf

Single-cell gene regulatory network inference analysis

leaf

Somatic mutation of malignant transformation related genes

leaf

Related drugs of malignant transformation related genes

Gene: EMC1

Gene summary for EMC1

check button Gene summary.

Gene informationSpeciesHuman
Gene symbol

EMC1

Gene ID

23065

Gene nameER membrane protein complex subunit 1
Gene AliasCAVIPMR
Cytomap1p36.13
Gene Typeprotein-coding
GO ID

GO:0006996

UniProtAcc

Q8N766


Top

Malignant transformation analysis

check button Identification of the aberrant gene expression in precancerous and cancerous lesions by comparing the gene expression of stem-like cells in diseased tissues with normal stem cells
check button Malignant transformation involving gene list.
Entrez IDSymbolReplicatesSpeciesOrganTissueAdj P-valueLog2FCMalignancy
23065EMC1LZE7THumanEsophagusESCC1.81e-041.97e-010.0667
23065EMC1LZE8THumanEsophagusESCC1.65e-036.35e-020.067
23065EMC1LZE24THumanEsophagusESCC2.18e-101.29e-010.0596
23065EMC1P2T-EHumanEsophagusESCC1.09e-334.53e-010.1177
23065EMC1P4T-EHumanEsophagusESCC1.43e-052.18e-010.1323
23065EMC1P5T-EHumanEsophagusESCC3.47e-113.30e-020.1327
23065EMC1P8T-EHumanEsophagusESCC4.48e-171.90e-010.0889
23065EMC1P9T-EHumanEsophagusESCC3.31e-093.19e-020.1131
23065EMC1P10T-EHumanEsophagusESCC9.75e-202.82e-010.116
23065EMC1P11T-EHumanEsophagusESCC1.63e-205.04e-010.1426
23065EMC1P12T-EHumanEsophagusESCC2.95e-212.41e-010.1122
23065EMC1P15T-EHumanEsophagusESCC5.28e-266.56e-010.1149
23065EMC1P16T-EHumanEsophagusESCC1.02e-263.79e-010.1153
23065EMC1P17T-EHumanEsophagusESCC1.30e-084.18e-010.1278
23065EMC1P19T-EHumanEsophagusESCC8.91e-043.87e-010.1662
23065EMC1P20T-EHumanEsophagusESCC1.24e-103.34e-010.1124
23065EMC1P21T-EHumanEsophagusESCC4.54e-326.72e-010.1617
23065EMC1P22T-EHumanEsophagusESCC3.31e-211.18e-010.1236
23065EMC1P23T-EHumanEsophagusESCC1.46e-121.93e-010.108
23065EMC1P24T-EHumanEsophagusESCC1.35e-162.05e-010.1287
Page: 1 2 3 4 5 

check button Transcriptomic changes along malignancy continuum.
TissueExpression DynamicsAbbreviation
EsophagusThe image shows the transcriptomic changes along malignancy continuum.log2FC in expression of this searched gene in stem-like cells from each diseased tissue sample relative to stem-like cells in normal samples in each tissue plotted against the malignancy continuum. Samples are colored based on if they are from different disease stage.
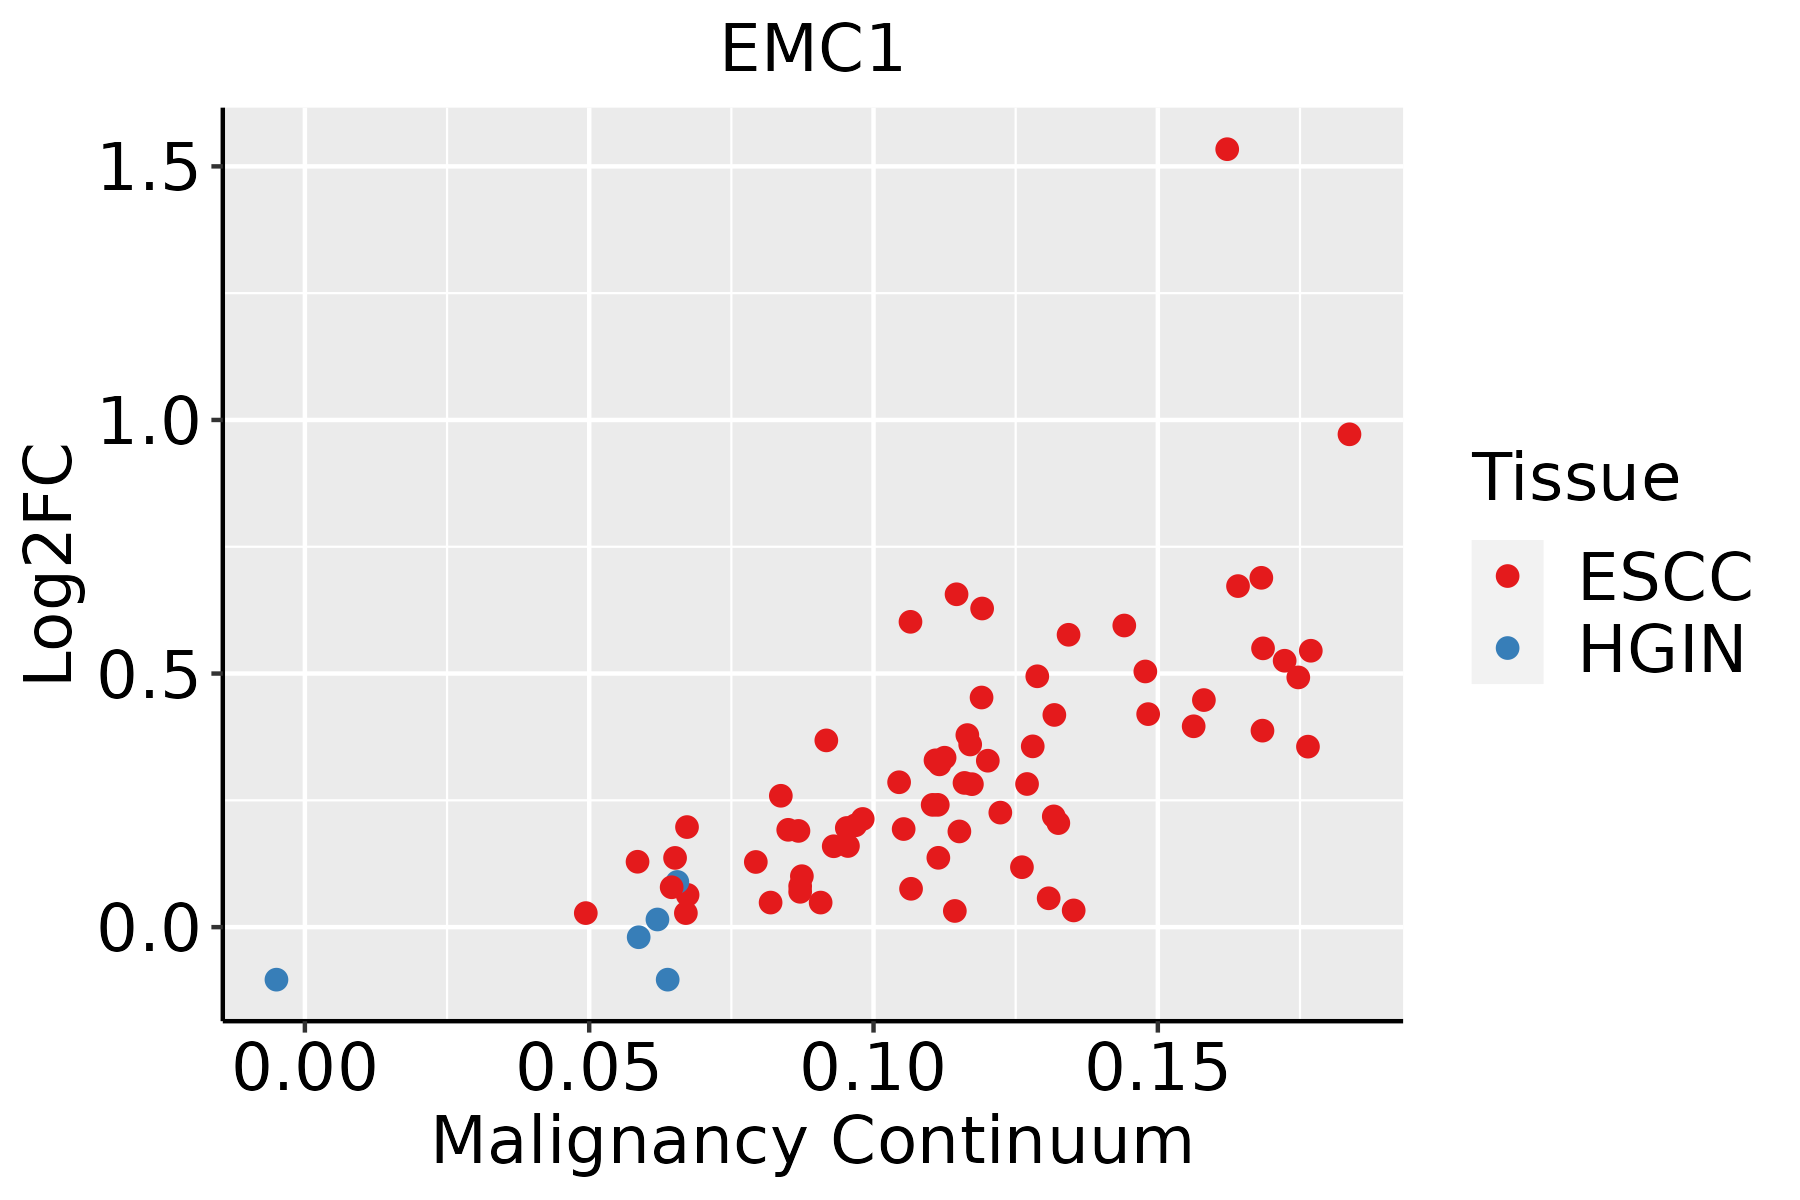
ESCC: Esophageal squamous cell carcinoma
HGIN: High-grade intraepithelial neoplasias
LGIN: Low-grade intraepithelial neoplasias
LiverThe image shows the transcriptomic changes along malignancy continuum.log2FC in expression of this searched gene in stem-like cells from each diseased tissue sample relative to stem-like cells in normal samples in each tissue plotted against the malignancy continuum. Samples are colored based on if they are from different disease stage.HCC: Hepatocellular carcinoma
NAFLD: Non-alcoholic fatty liver disease
Oral CavityThe image shows the transcriptomic changes along malignancy continuum.log2FC in expression of this searched gene in stem-like cells from each diseased tissue sample relative to stem-like cells in normal samples in each tissue plotted against the malignancy continuum. Samples are colored based on if they are from different disease stage.EOLP: Erosive Oral lichen planus
LP: leukoplakia
NEOLP: Non-erosive oral lichen planus
OSCC: Oral squamous cell carcinoma
SkinThe image shows the transcriptomic changes along malignancy continuum.log2FC in expression of this searched gene in stem-like cells from each diseased tissue sample relative to stem-like cells in normal samples in each tissue plotted against the malignancy continuum. Samples are colored based on if they are from different disease stage.
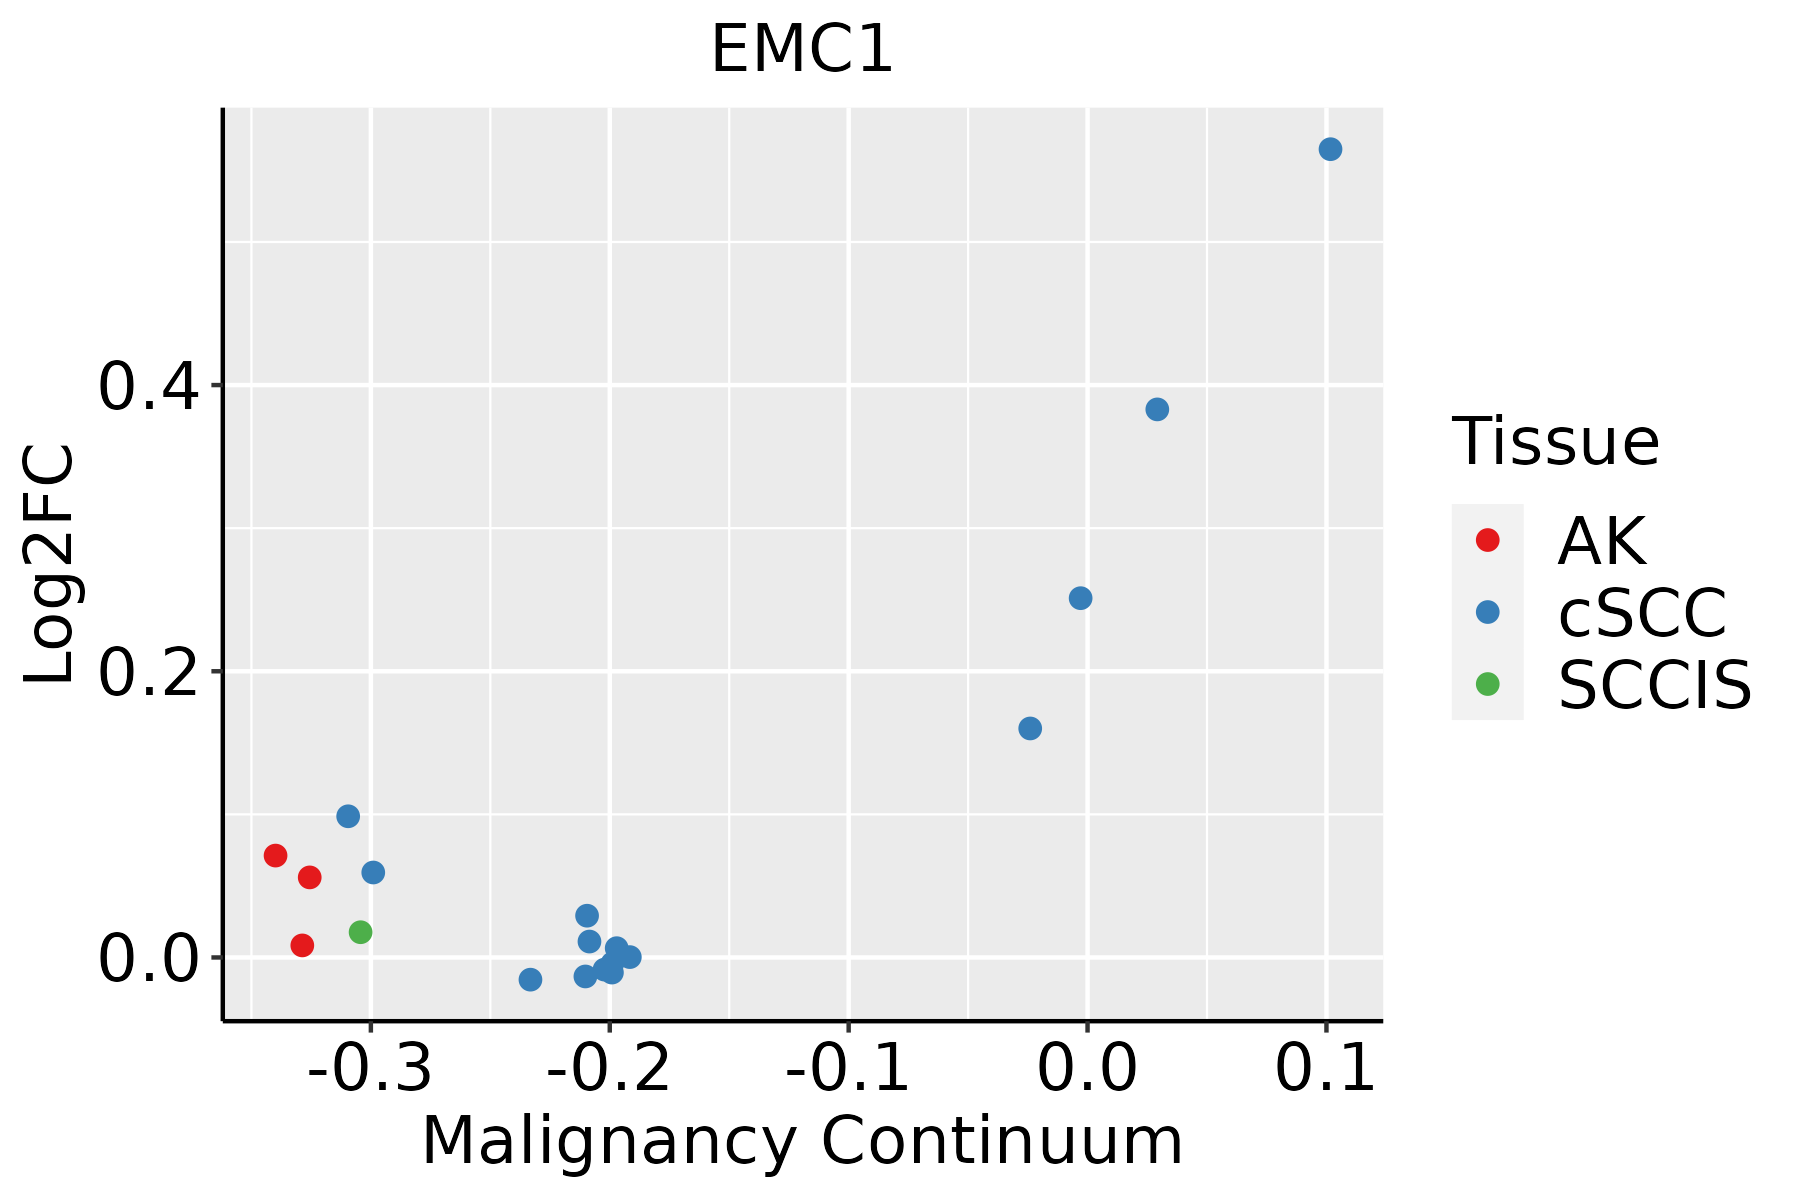
AK: Actinic keratosis
cSCC: Cutaneous squamous cell carcinoma
SCCIS:squamous cell carcinoma in situ
ThyroidThe image shows the transcriptomic changes along malignancy continuum.log2FC in expression of this searched gene in stem-like cells from each diseased tissue sample relative to stem-like cells in normal samples in each tissue plotted against the malignancy continuum. Samples are colored based on if they are from different disease stage.
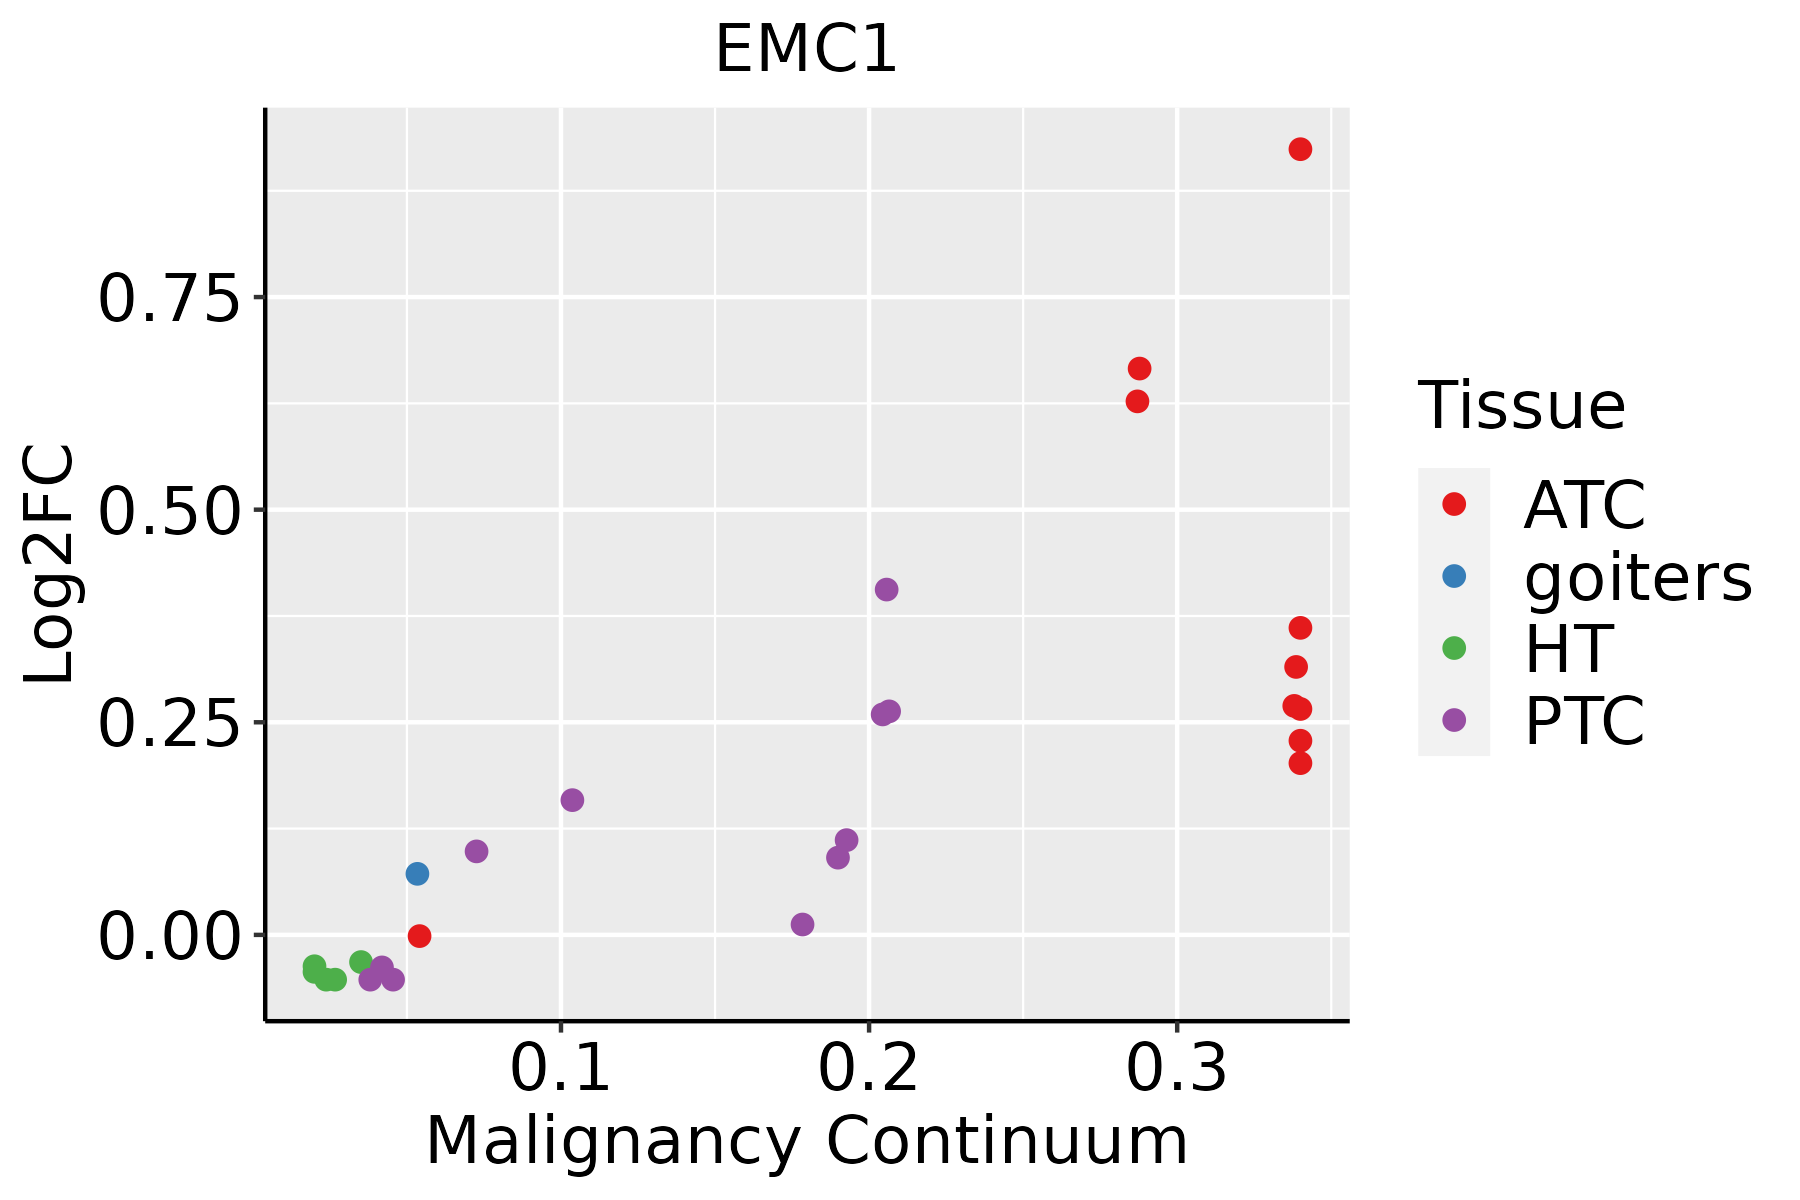
ATC: Anaplastic thyroid cancer
HT: Hashimoto's thyroiditis
PTC: Papillary thyroid cancer
∗log2FC in expression of this searched gene in stem-like cells from each diseased tissue sample relative to stem-like cells in normal samples in each tissue plotted against the malignancy continuum. Samples are colored based on if they are from different disease stage.

Top

Malignant transformation related pathway analysis

check buttonFind out the enriched GO biological processes and KEGG pathways involved in transition from healthy to precancer to cancer
check button Figure of enriched GO biological processes.
TissueDisease StageEnriched GO biological Processes
ColorectumADGO analysis - Figure of enriched GO biological processes: Top 15 enriched GO BP terms are showed in the bar plot of each disease state in each tissue. Each row represents a significant GO biological process which is colored according to the -log10(p.adjust).
ColorectumSERGO analysis - Figure of enriched GO biological processes: Top 15 enriched GO BP terms are showed in the bar plot of each disease state in each tissue. Each row represents a significant GO biological process which is colored according to the -log10(p.adjust).
ColorectumMSSGO analysis - Figure of enriched GO biological processes: Top 15 enriched GO BP terms are showed in the bar plot of each disease state in each tissue. Each row represents a significant GO biological process which is colored according to the -log10(p.adjust).
ColorectumMSI-HGO analysis - Figure of enriched GO biological processes: Top 15 enriched GO BP terms are showed in the bar plot of each disease state in each tissue. Each row represents a significant GO biological process which is colored according to the -log10(p.adjust).
ColorectumFAPGO analysis - Figure of enriched GO biological processes: Top 15 enriched GO BP terms are showed in the bar plot of each disease state in each tissue. Each row represents a significant GO biological process which is colored according to the -log10(p.adjust).
∗Top 15 enriched GO BP terms are showed in the bar plot of each disease state in each tissue. Each row represents a significant GO biological process which is colored according to the -log10(p.adjust).
Page: 1 2 3 4 5 6 7 8 9 

check button Enriched GO biological processes.
GO IDTissueDisease StageDescriptionGene RatioBg Ratiopvaluep.adjustCount
GO:000166710EndometriumAEHameboidal-type cell migration90/2100475/187233.73e-071.57e-0590
GO:00506738EndometriumAEHepithelial cell proliferation84/2100437/187234.88e-071.94e-0584
GO:009013014EndometriumAEHtissue migration73/2100365/187235.79e-072.20e-0573
GO:009013214EndometriumAEHepithelium migration72/2100360/187236.90e-072.55e-0572
GO:001063114EndometriumAEHepithelial cell migration71/2100357/187231.02e-063.52e-0571
GO:001063214EndometriumAEHregulation of epithelial cell migration60/2100292/187232.31e-066.77e-0560
GO:00506788EndometriumAEHregulation of epithelial cell proliferation73/2100381/187233.04e-068.44e-0573
GO:001063410EndometriumAEHpositive regulation of epithelial cell migration41/2100176/187233.79e-061.01e-0441
GO:00514039EndometriumAEHstress-activated MAPK cascade50/2100239/187239.33e-062.18e-0450
GO:00310989EndometriumAEHstress-activated protein kinase signaling cascade51/2100247/187231.12e-052.52e-0451
GO:00328728EndometriumAEHregulation of stress-activated MAPK cascade42/2100192/187231.53e-053.23e-0442
GO:00380665EndometriumAEHp38MAPK cascade18/210055/187231.77e-053.65e-0418
GO:00435428EndometriumAEHendothelial cell migration55/2100279/187232.11e-054.15e-0455
GO:00105955EndometriumAEHpositive regulation of endothelial cell migration32/2100133/187232.12e-054.15e-0432
GO:00434105EndometriumAEHpositive regulation of MAPK cascade84/2100480/187232.19e-054.25e-0484
GO:00703028EndometriumAEHregulation of stress-activated protein kinase signaling cascade42/2100195/187232.27e-054.35e-0442
GO:00105945EndometriumAEHregulation of endothelial cell migration47/2100232/187234.02e-056.91e-0447
GO:00506795EndometriumAEHpositive regulation of epithelial cell proliferation43/2100207/187234.55e-057.61e-0443
GO:009015010EndometriumAEHestablishment of protein localization to membrane51/2100260/187234.74e-057.85e-0451
GO:19007443EndometriumAEHregulation of p38MAPK cascade15/210047/187231.21e-041.67e-0315
Page: 1 2 3 4 5 6 7 8 9 10 11 12 

check button Enriched KEGG pathways.
Pathway IDTissueDisease StageDescriptionGene RatioBg Ratiopvaluep.adjustqvalueCount
Page: 1 

Top

Cell-cell communication analysis

check buttonIdentification of potential cell-cell interactions between two cell types and their ligand-receptor pairs for different disease states
LigandReceptorLRpairPathwayTissueDisease Stage
Page: 1 

Top

Single-cell gene regulatory network inference analysis

check buttonFind out the significant the regulons (TFs) and the target genes of each regulon across cell types for different disease states
TFCell TypeTissueDisease StageTarget GeneRSSRegulon Activity
∗The dot plots of a searched regulon are shown for all cell subpopulations in each disease state of each tissue based on the regulon specific score inferred using pySCENIC and by calculating the average expression.
Page: 1 

Top

Somatic mutation of malignant transformation related genes

check buttonAnnotation of somatic variants for genes involved in malignant transformation
Hugo SymbolVariant ClassVariant ClassificationdbSNP RSHGVScHGVSpHGVSp ShortSWISSPROTBIOTYPESIFTPolyPhenTumor Sample BarcodeTissueHistologySexAgeStageTherapy TypesDrugsOutcome
EMC1SNVMissense_Mutationnovelc.1799C>Ap.Ser600Tyrp.S600YQ8N766protein_codingtolerated(1)benign(0.086)TCGA-AN-A046-01Breastbreast invasive carcinomaFemale>=65I/IIUnknownUnknownSD
EMC1SNVMissense_Mutationnovelc.1283A>Gp.His428Argp.H428RQ8N766protein_codingtolerated(0.11)benign(0.003)TCGA-AN-A046-01Breastbreast invasive carcinomaFemale>=65I/IIUnknownUnknownSD
EMC1SNVMissense_Mutationnovelc.64G>Ap.Val22Ilep.V22IQ8N766protein_codingtolerated(0.1)benign(0.228)TCGA-B6-A2IU-01Breastbreast invasive carcinomaFemale<65I/IIUnknownUnknownPD
EMC1SNVMissense_Mutationc.1525N>Ap.Ala509Thrp.A509TQ8N766protein_codingtolerated(0.08)benign(0.015)TCGA-BH-A18H-01Breastbreast invasive carcinomaFemale<65I/IIChemotherapyadriamycinCR
EMC1SNVMissense_Mutationc.2567N>Ap.Ile856Asnp.I856NQ8N766protein_codingdeleterious(0)probably_damaging(1)TCGA-E9-A1RI-01Breastbreast invasive carcinomaFemale<65III/IVHormone TherapytamoxiphenSD
EMC1insertionNonsense_Mutationnovelc.1119_1120insTGACTTGTTAGAAGTCACAGTAAAGGCGGGTATTATTTp.Thr374Terp.T374*Q8N766protein_codingTCGA-A2-A04Y-01Breastbreast invasive carcinomaFemale<65I/IIChemotherapycytoxanSD
EMC1insertionFrame_Shift_Insnovelc.1321_1322insATTGTTTTGAAGAp.Val441AspfsTer10p.V441Dfs*10Q8N766protein_codingTCGA-A8-A06X-01Breastbreast invasive carcinomaFemale>=65I/IIUnknownUnknownSD
EMC1insertionNonsense_Mutationnovelc.1319_1320insATAATGGGGATAATAGCACCAACGTCAGAp.Val441Terp.V441*Q8N766protein_codingTCGA-A8-A06X-01Breastbreast invasive carcinomaFemale>=65I/IIUnknownUnknownSD
EMC1insertionIn_Frame_Insnovelc.185_186insTCACTCTGTCACCCAGGCTAGAGTGCAGTGp.Val62_Ile63insHisSerValThrGlnAlaArgValGlnTrpp.V62_I63insHSVTQARVQWQ8N766protein_codingTCGA-A8-A0A2-01Breastbreast invasive carcinomaFemale>=65I/IIHormone TherapytamoxiphenSD
EMC1insertionFrame_Shift_Insnovelc.2326_2327insCAACCACCATCTTGTCGGGTTTTCTTACCTCCATp.Lys776ThrfsTer48p.K776Tfs*48Q8N766protein_codingTCGA-AO-A03R-01Breastbreast invasive carcinomaFemale<65I/IIChemotherapydoxorubicinSD
Page: 1 2 3 4 5 6 7 8 9 10 

Top

Related drugs of malignant transformation related genes

check buttonIdentification of chemicals and drugs interact with genes involved in malignant transfromation
(DGIdb 4.0)
Entrez IDSymbolCategoryInteraction TypesDrug Claim NameDrug NamePMIDs
Page: 1