
|
|||||
|
 | |
| |
| |
| |
| |
| |
|
Gene: EMB |
Gene summary for EMB |
| Gene information | Species | Human | Gene symbol | EMB | Gene ID | 133418 |
| Gene name | embigin | |
| Gene Alias | GP70 | |
| Cytomap | 5q11.1 | |
| Gene Type | protein-coding | GO ID | GO:0000902 | UniProtAcc | Q6PCB8 |
Top |
Malignant transformation analysis |
| Identification of the aberrant gene expression in precancerous and cancerous lesions by comparing the gene expression of stem-like cells in diseased tissues with normal stem cells |
| Entrez ID | Symbol | Replicates | Species | Organ | Tissue | Adj P-value | Log2FC | Malignancy |
| 133418 | EMB | LZE7T | Human | Esophagus | ESCC | 9.52e-06 | 2.45e-01 | 0.0667 |
| 133418 | EMB | LZE24T | Human | Esophagus | ESCC | 1.43e-02 | 1.07e-01 | 0.0596 |
| 133418 | EMB | LZE6T | Human | Esophagus | ESCC | 1.02e-04 | 3.89e-01 | 0.0845 |
| 133418 | EMB | P4T-E | Human | Esophagus | ESCC | 1.57e-05 | 1.88e-01 | 0.1323 |
| 133418 | EMB | P5T-E | Human | Esophagus | ESCC | 1.87e-18 | 4.03e-01 | 0.1327 |
| 133418 | EMB | P8T-E | Human | Esophagus | ESCC | 2.72e-06 | 8.21e-02 | 0.0889 |
| 133418 | EMB | P10T-E | Human | Esophagus | ESCC | 6.60e-06 | 7.61e-02 | 0.116 |
| 133418 | EMB | P11T-E | Human | Esophagus | ESCC | 6.08e-06 | 3.67e-01 | 0.1426 |
| 133418 | EMB | P21T-E | Human | Esophagus | ESCC | 5.44e-03 | 1.81e-01 | 0.1617 |
| 133418 | EMB | P36T-E | Human | Esophagus | ESCC | 1.32e-11 | 4.51e-01 | 0.1187 |
| 133418 | EMB | P37T-E | Human | Esophagus | ESCC | 2.27e-09 | 2.99e-01 | 0.1371 |
| 133418 | EMB | P52T-E | Human | Esophagus | ESCC | 3.47e-04 | 1.53e-01 | 0.1555 |
| 133418 | EMB | P62T-E | Human | Esophagus | ESCC | 1.25e-09 | 2.66e-01 | 0.1302 |
| 133418 | EMB | P74T-E | Human | Esophagus | ESCC | 3.02e-02 | 1.28e-01 | 0.1479 |
| 133418 | EMB | P75T-E | Human | Esophagus | ESCC | 6.05e-06 | 2.05e-01 | 0.1125 |
| 133418 | EMB | P76T-E | Human | Esophagus | ESCC | 1.81e-03 | 1.49e-01 | 0.1207 |
| 133418 | EMB | P82T-E | Human | Esophagus | ESCC | 3.27e-04 | 2.78e-01 | 0.1072 |
| 133418 | EMB | P89T-E | Human | Esophagus | ESCC | 2.64e-09 | 5.23e-01 | 0.1752 |
| 133418 | EMB | P94T-E | Human | Esophagus | ESCC | 4.51e-02 | 4.73e-01 | 0.0879 |
| 133418 | EMB | P107T-E | Human | Esophagus | ESCC | 7.38e-17 | 4.81e-01 | 0.171 |
| Page: 1 2 |
| Tissue | Expression Dynamics | Abbreviation |
| Esophagus | 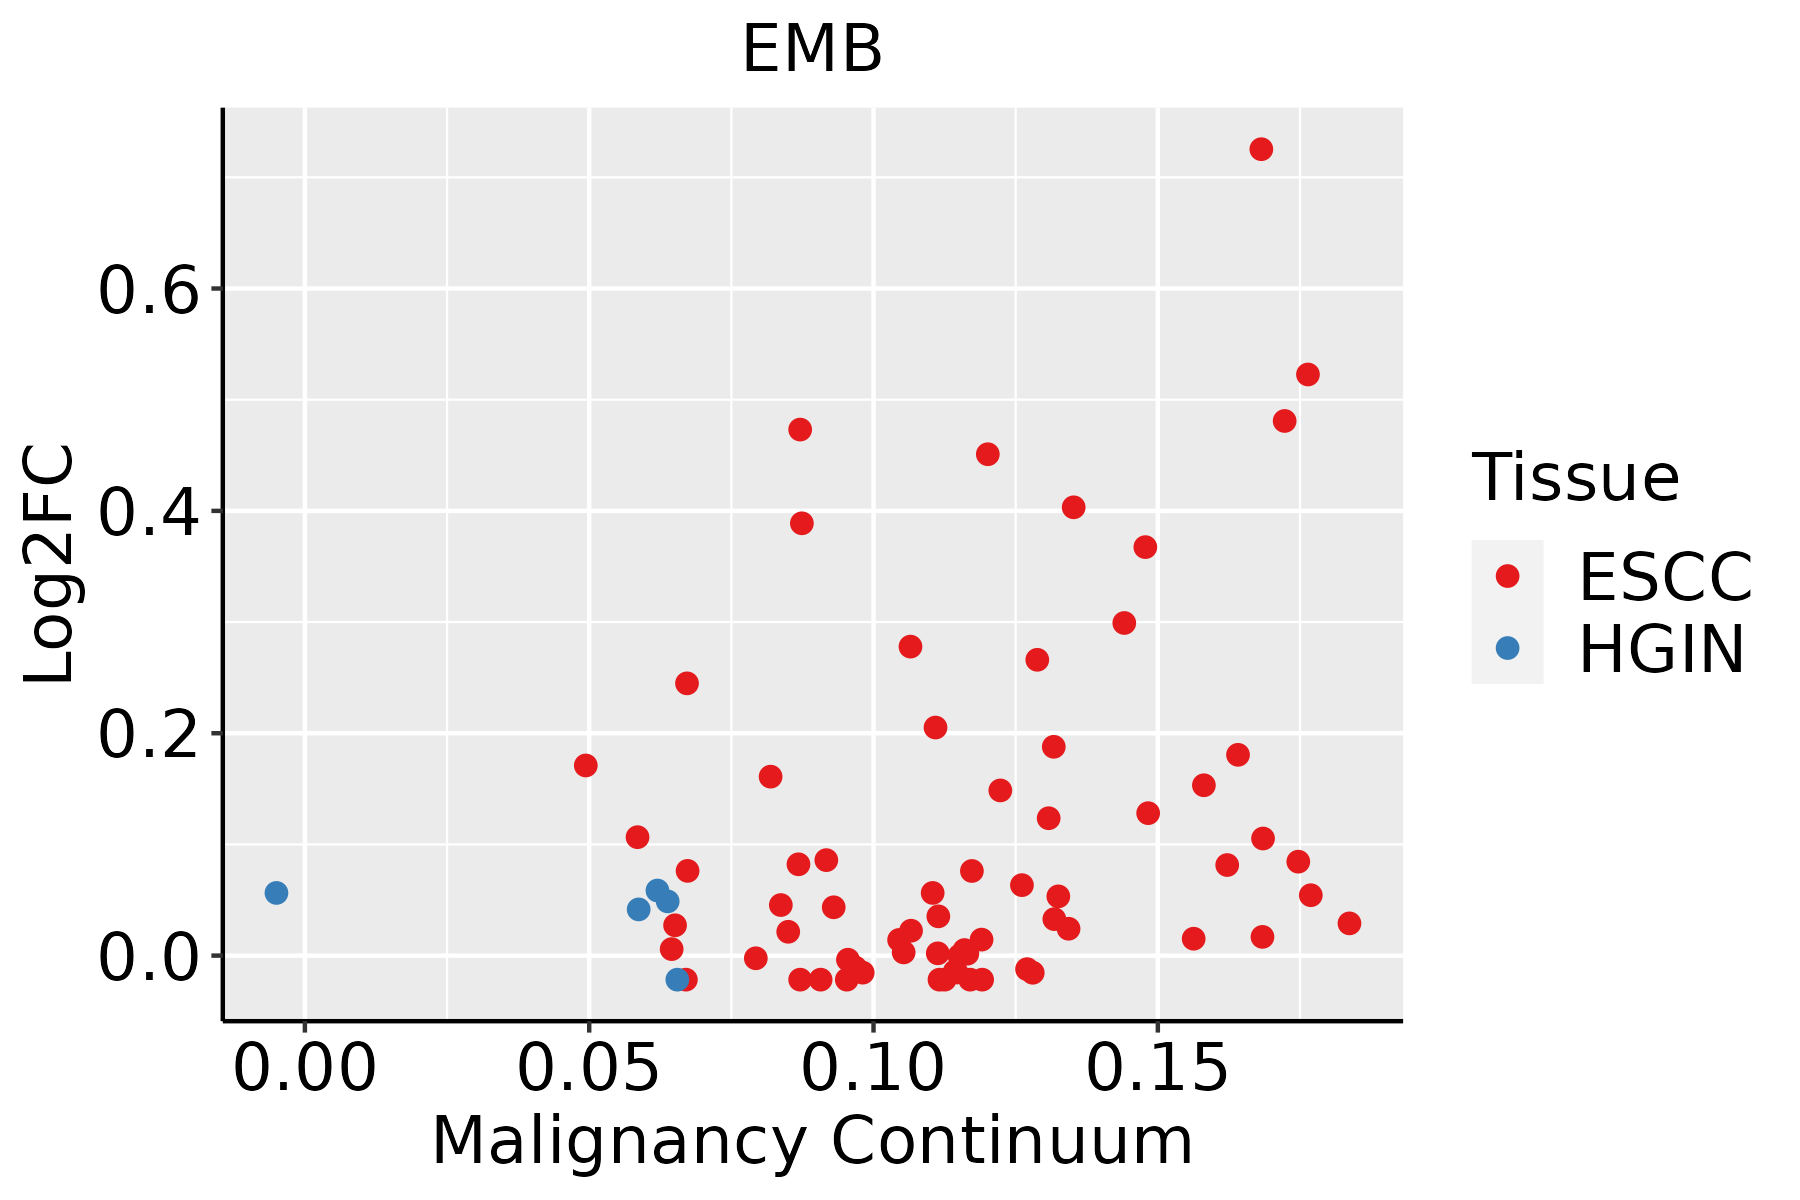 | ESCC: Esophageal squamous cell carcinoma |
| HGIN: High-grade intraepithelial neoplasias | ||
| LGIN: Low-grade intraepithelial neoplasias | ||
| Oral Cavity | 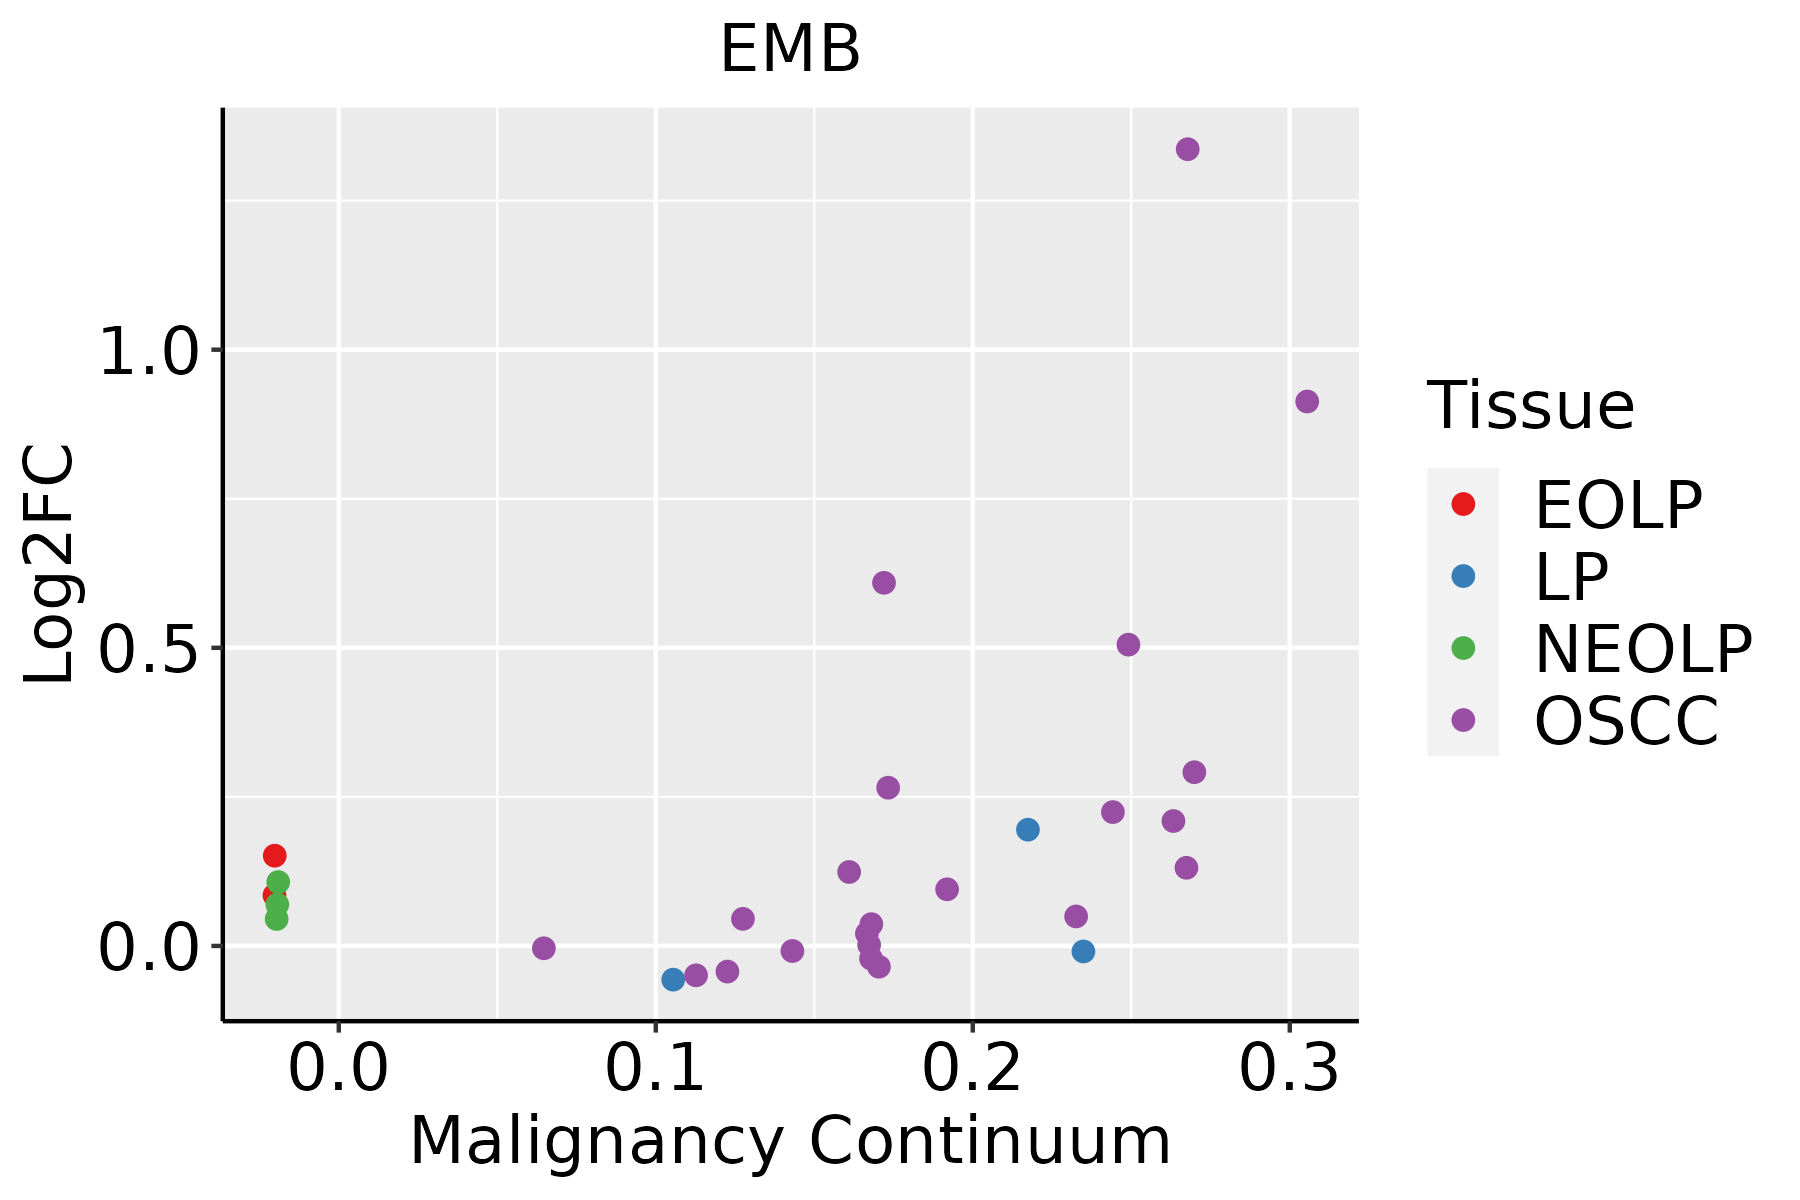 | EOLP: Erosive Oral lichen planus |
| LP: leukoplakia | ||
| NEOLP: Non-erosive oral lichen planus | ||
| OSCC: Oral squamous cell carcinoma | ||
| Prostate | 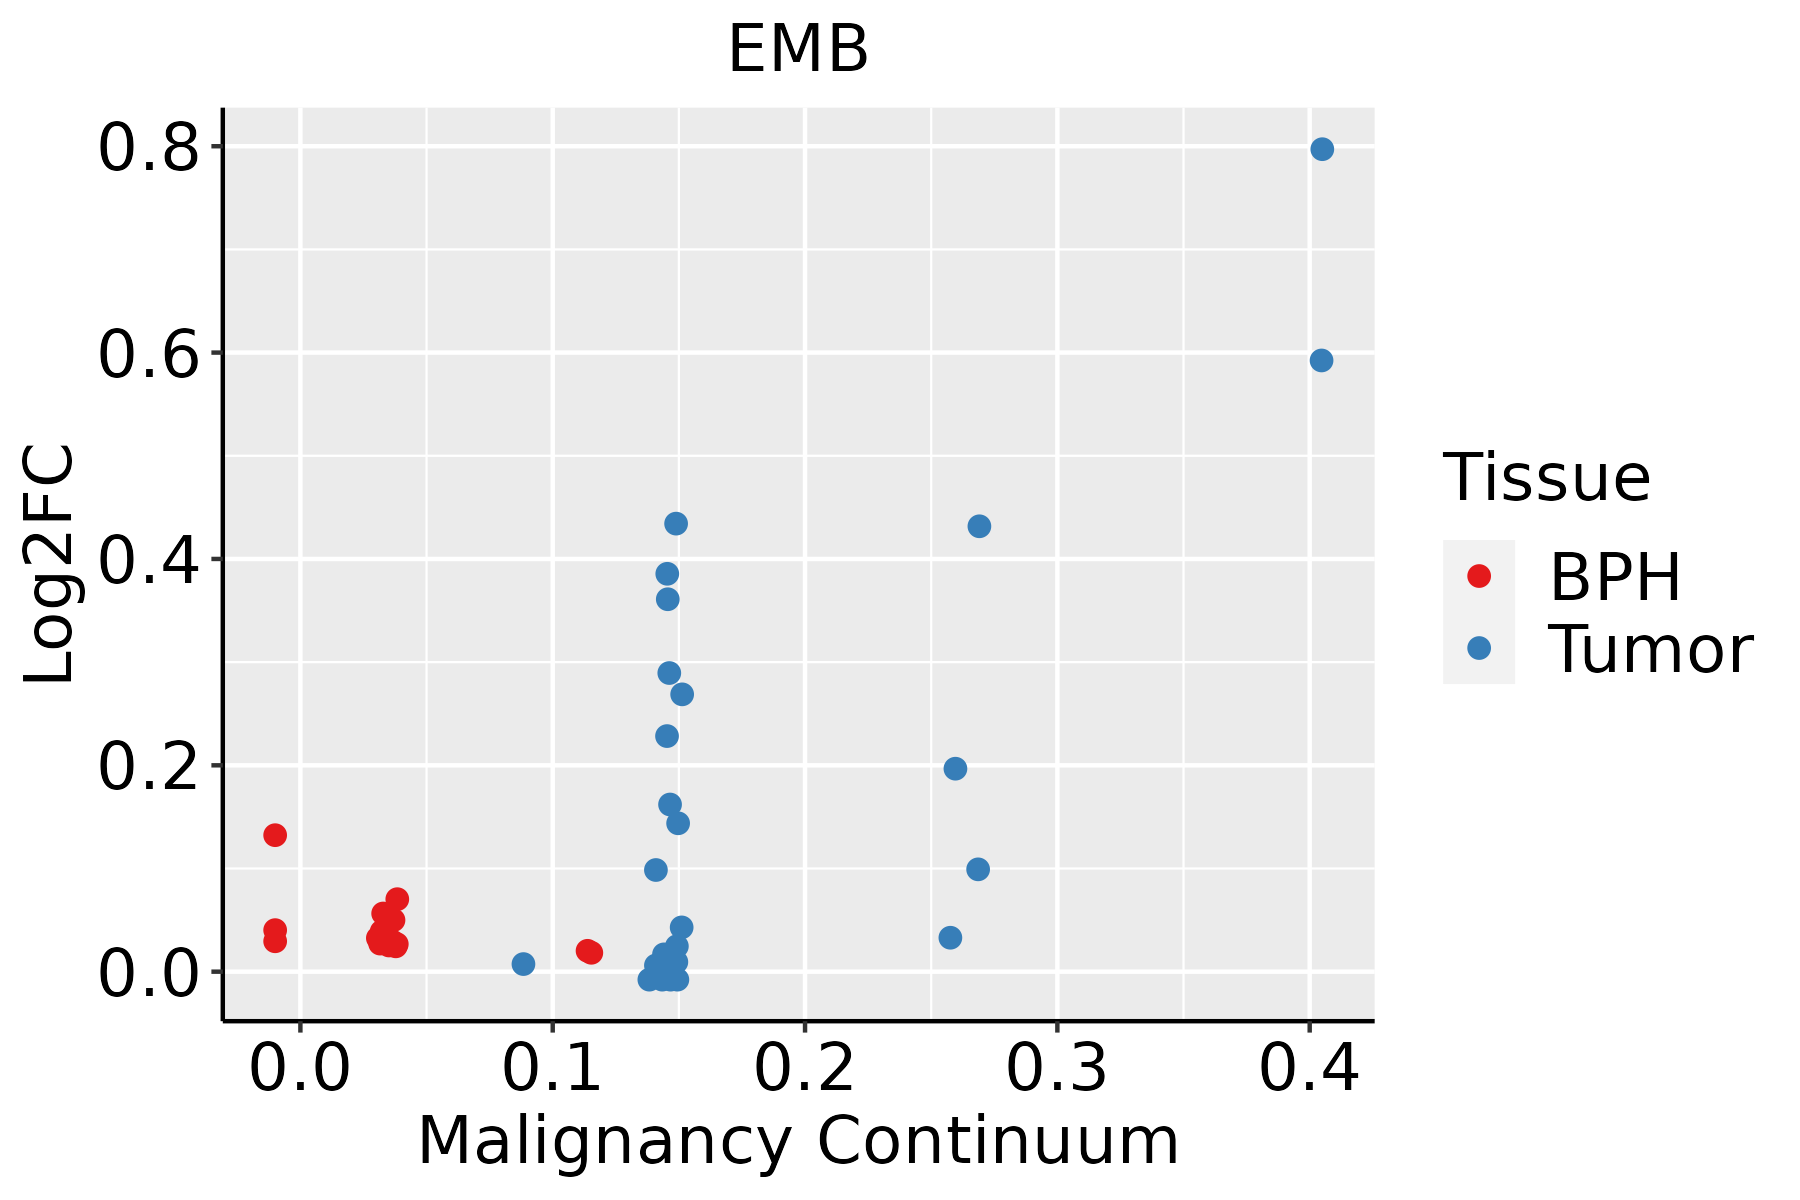 | BPH: Benign Prostatic Hyperplasia |
| Thyroid | 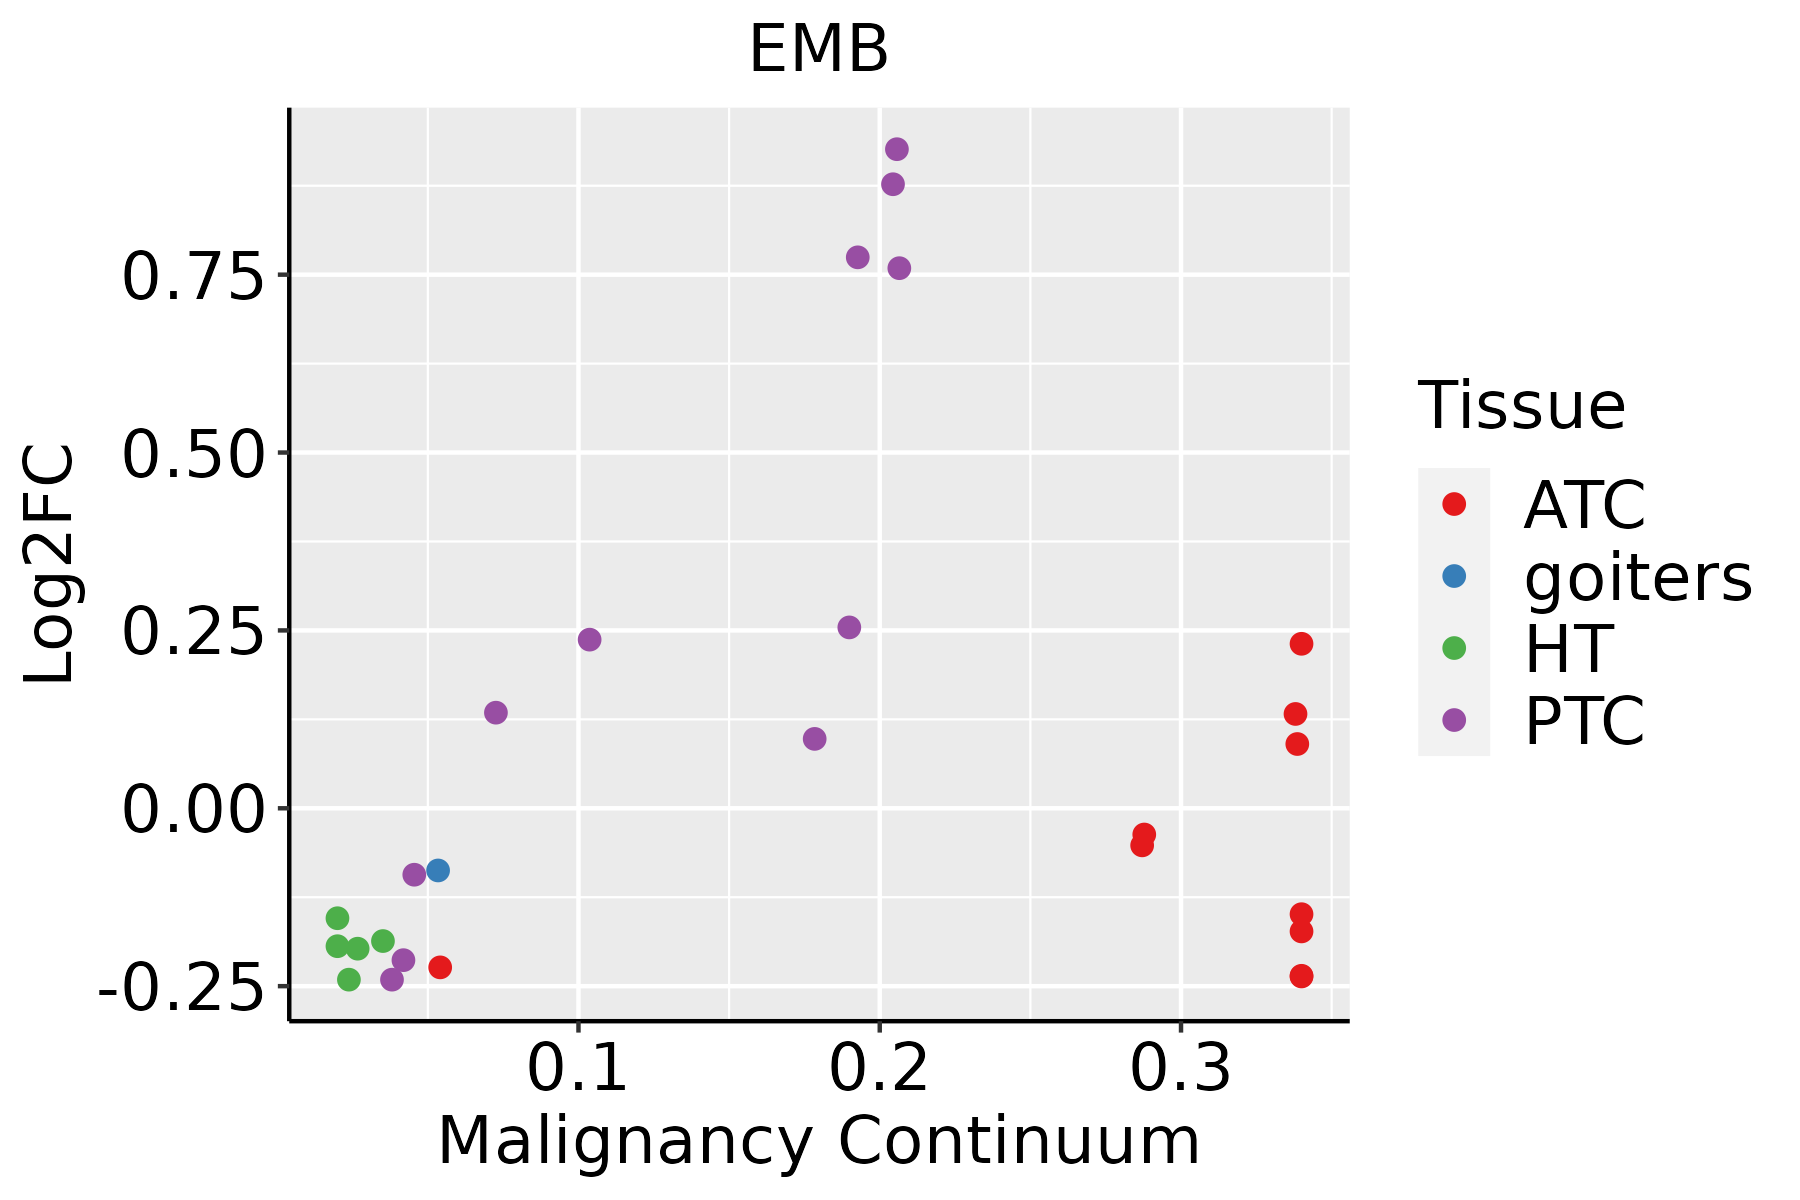 | ATC: Anaplastic thyroid cancer |
| HT: Hashimoto's thyroiditis | ||
| PTC: Papillary thyroid cancer |
| ∗log2FC in expression of this searched gene in stem-like cells from each diseased tissue sample relative to stem-like cells in normal samples in each tissue plotted against the malignancy continuum. Samples are colored based on if they are from different disease stage. |
Top |
Malignant transformation related pathway analysis |
| Find out the enriched GO biological processes and KEGG pathways involved in transition from healthy to precancer to cancer |
| Tissue | Disease Stage | Enriched GO biological Processes |
| Colorectum | AD |  |
| Colorectum | SER |  |
| Colorectum | MSS |  |
| Colorectum | MSI-H |  |
| Colorectum | FAP |  |
| ∗Top 15 enriched GO BP terms are showed in the bar plot of each disease state in each tissue. Each row represents a significant GO biological process which is colored according to the -log10(p.adjust). |
| Page: 1 2 3 4 5 6 7 8 9 |
| GO ID | Tissue | Disease Stage | Description | Gene Ratio | Bg Ratio | pvalue | p.adjust | Count |
| GO:006156415 | Esophagus | ESCC | axon development | 251/8552 | 467/18723 | 2.41e-04 | 1.49e-03 | 251 |
| GO:000740915 | Esophagus | ESCC | axonogenesis | 219/8552 | 418/18723 | 3.14e-03 | 1.31e-02 | 219 |
| GO:006156410 | Oral cavity | OSCC | axon development | 207/7305 | 467/18723 | 1.01e-02 | 3.51e-02 | 207 |
| GO:006156413 | Prostate | Tumor | axon development | 113/3246 | 467/18723 | 8.86e-05 | 8.74e-04 | 113 |
| GO:000740913 | Prostate | Tumor | axonogenesis | 100/3246 | 418/18723 | 3.38e-04 | 2.70e-03 | 100 |
| GO:006156419 | Thyroid | PTC | axon development | 199/5968 | 467/18723 | 5.27e-07 | 8.53e-06 | 199 |
| GO:000740918 | Thyroid | PTC | axonogenesis | 178/5968 | 418/18723 | 2.17e-06 | 2.91e-05 | 178 |
| GO:006156423 | Thyroid | ATC | axon development | 220/6293 | 467/18723 | 6.85e-10 | 1.80e-08 | 220 |
| GO:000740919 | Thyroid | ATC | axonogenesis | 197/6293 | 418/18723 | 5.09e-09 | 1.13e-07 | 197 |
| GO:00074113 | Thyroid | ATC | axon guidance | 96/6293 | 227/18723 | 3.74e-03 | 1.63e-02 | 96 |
| GO:00974853 | Thyroid | ATC | neuron projection guidance | 96/6293 | 228/18723 | 4.36e-03 | 1.81e-02 | 96 |
| Page: 1 |
| Pathway ID | Tissue | Disease Stage | Description | Gene Ratio | Bg Ratio | pvalue | p.adjust | qvalue | Count |
| Page: 1 |
Top |
Cell-cell communication analysis |
| Identification of potential cell-cell interactions between two cell types and their ligand-receptor pairs for different disease states |
| Ligand | Receptor | LRpair | Pathway | Tissue | Disease Stage |
| Page: 1 |
Top |
Single-cell gene regulatory network inference analysis |
| Find out the significant the regulons (TFs) and the target genes of each regulon across cell types for different disease states |
| TF | Cell Type | Tissue | Disease Stage | Target Gene | RSS | Regulon Activity |
| ∗The dot plots of a searched regulon are shown for all cell subpopulations in each disease state of each tissue based on the regulon specific score inferred using pySCENIC and by calculating the average expression. |
| Page: 1 |
Top |
Somatic mutation of malignant transformation related genes |
| Annotation of somatic variants for genes involved in malignant transformation |
| Hugo Symbol | Variant Class | Variant Classification | dbSNP RS | HGVSc | HGVSp | HGVSp Short | SWISSPROT | BIOTYPE | SIFT | PolyPhen | Tumor Sample Barcode | Tissue | Histology | Sex | Age | Stage | Therapy Types | Drugs | Outcome |
| EMB | SNV | Missense_Mutation | novel | c.861N>T | p.Lys287Asn | p.K287N | Q6PCB8 | protein_coding | deleterious(0) | probably_damaging(0.917) | TCGA-AN-A046-01 | Breast | breast invasive carcinoma | Female | >=65 | I/II | Unknown | Unknown | SD |
| EMB | SNV | Missense_Mutation | c.971N>G | p.Ser324Cys | p.S324C | Q6PCB8 | protein_coding | deleterious(0) | probably_damaging(0.995) | TCGA-AR-A0TZ-01 | Breast | breast invasive carcinoma | Female | <65 | III/IV | Unspecific | Doxorubicin | PD | |
| EMB | SNV | Missense_Mutation | c.371A>G | p.Tyr124Cys | p.Y124C | Q6PCB8 | protein_coding | tolerated(0.12) | benign(0.015) | TCGA-BH-A0H7-01 | Breast | breast invasive carcinoma | Female | >=65 | III/IV | Chemotherapy | doxorubicin | SD | |
| EMB | insertion | Nonsense_Mutation | novel | c.691_692insTATATGTAACAATTTTTATGTAAAGGTCA | p.Asp231ValfsTer8 | p.D231Vfs*8 | Q6PCB8 | protein_coding | TCGA-BH-A0B8-01 | Breast | breast invasive carcinoma | Female | <65 | I/II | Hormone Therapy | arimidex | SD | ||
| EMB | SNV | Missense_Mutation | novel | c.468C>G | p.Phe156Leu | p.F156L | Q6PCB8 | protein_coding | tolerated(1) | benign(0.003) | TCGA-DS-A1OB-01 | Cervix | cervical & endocervical cancer | Female | <65 | I/II | Chemotherapy | carboplatin | PD |
| EMB | SNV | Missense_Mutation | c.641N>T | p.Gly214Val | p.G214V | Q6PCB8 | protein_coding | tolerated(0.11) | benign(0.358) | TCGA-AA-3666-01 | Colorectum | colon adenocarcinoma | Male | >=65 | III/IV | Unknown | Unknown | PD | |
| EMB | SNV | Missense_Mutation | c.596N>C | p.Val199Ala | p.V199A | Q6PCB8 | protein_coding | tolerated(0.7) | benign(0.026) | TCGA-AA-A00N-01 | Colorectum | colon adenocarcinoma | Male | >=65 | I/II | Unknown | Unknown | PD | |
| EMB | SNV | Missense_Mutation | c.355A>T | p.Thr119Ser | p.T119S | Q6PCB8 | protein_coding | tolerated(0.16) | benign(0.238) | TCGA-AY-4070-01 | Colorectum | colon adenocarcinoma | Female | <65 | III/IV | Chemotherapy | 5-fu | PD | |
| EMB | SNV | Missense_Mutation | rs769210568 | c.608N>C | p.Val203Ala | p.V203A | Q6PCB8 | protein_coding | deleterious(0) | benign(0.339) | TCGA-CA-6717-01 | Colorectum | colon adenocarcinoma | Male | <65 | I/II | Chemotherapy | oxaliplatin | CR |
| EMB | SNV | Missense_Mutation | c.897N>T | p.Glu299Asp | p.E299D | Q6PCB8 | protein_coding | tolerated(0.39) | benign(0.045) | TCGA-DM-A1HB-01 | Colorectum | colon adenocarcinoma | Male | >=65 | III/IV | Unknown | Unknown | SD |
| Page: 1 2 3 4 5 |
Top |
Related drugs of malignant transformation related genes |
| Identification of chemicals and drugs interact with genes involved in malignant transfromation |
| (DGIdb 4.0) |
| Entrez ID | Symbol | Category | Interaction Types | Drug Claim Name | Drug Name | PMIDs |
| Page: 1 |

Copyright 2023-Present -The University of Texas Health Science Center at Houston |