
|
|||||
|
 | |
| |
| |
| |
| |
| |
|
Gene: ELP5 |
Gene summary for ELP5 |
| Gene information | Species | Human | Gene symbol | ELP5 | Gene ID | 23587 |
| Gene name | elongator acetyltransferase complex subunit 5 | |
| Gene Alias | C17orf81 | |
| Cytomap | 17p13.1 | |
| Gene Type | protein-coding | GO ID | GO:0002097 | UniProtAcc | Q8TE02 |
Top |
Malignant transformation analysis |
| Identification of the aberrant gene expression in precancerous and cancerous lesions by comparing the gene expression of stem-like cells in diseased tissues with normal stem cells |
| Entrez ID | Symbol | Replicates | Species | Organ | Tissue | Adj P-value | Log2FC | Malignancy |
| 23587 | ELP5 | HTA11_411_2000001011 | Human | Colorectum | SER | 2.82e-02 | 4.93e-01 | -0.2602 |
| 23587 | ELP5 | HTA11_3361_2000001011 | Human | Colorectum | AD | 3.67e-03 | 2.63e-01 | -0.1207 |
| 23587 | ELP5 | HTA11_696_2000001011 | Human | Colorectum | AD | 4.28e-07 | 2.64e-01 | -0.1464 |
| 23587 | ELP5 | HTA11_1391_2000001011 | Human | Colorectum | AD | 5.63e-06 | 3.11e-01 | -0.059 |
| 23587 | ELP5 | HTA11_5212_2000001011 | Human | Colorectum | AD | 3.16e-02 | 3.64e-01 | -0.2061 |
| 23587 | ELP5 | HTA11_546_2000001011 | Human | Colorectum | AD | 1.89e-05 | 4.04e-01 | -0.0842 |
| 23587 | ELP5 | HTA11_866_3004761011 | Human | Colorectum | AD | 8.83e-04 | 2.22e-01 | 0.096 |
| 23587 | ELP5 | HTA11_7696_3000711011 | Human | Colorectum | AD | 1.48e-02 | 1.50e-01 | 0.0674 |
| 23587 | ELP5 | LZE2T | Human | Esophagus | ESCC | 1.16e-03 | 6.85e-01 | 0.082 |
| 23587 | ELP5 | LZE4T | Human | Esophagus | ESCC | 1.98e-15 | 4.38e-01 | 0.0811 |
| 23587 | ELP5 | LZE5T | Human | Esophagus | ESCC | 1.61e-06 | 8.19e-01 | 0.0514 |
| 23587 | ELP5 | LZE7T | Human | Esophagus | ESCC | 5.00e-18 | 1.44e+00 | 0.0667 |
| 23587 | ELP5 | LZE8T | Human | Esophagus | ESCC | 3.77e-08 | 2.55e-01 | 0.067 |
| 23587 | ELP5 | LZE20T | Human | Esophagus | ESCC | 1.10e-05 | 8.32e-02 | 0.0662 |
| 23587 | ELP5 | LZE22D1 | Human | Esophagus | HGIN | 6.25e-05 | 3.65e-01 | 0.0595 |
| 23587 | ELP5 | LZE22T | Human | Esophagus | ESCC | 4.96e-05 | 6.45e-01 | 0.068 |
| 23587 | ELP5 | LZE24T | Human | Esophagus | ESCC | 2.73e-18 | 5.72e-01 | 0.0596 |
| 23587 | ELP5 | LZE6T | Human | Esophagus | ESCC | 2.01e-05 | 5.23e-01 | 0.0845 |
| 23587 | ELP5 | P1T-E | Human | Esophagus | ESCC | 6.39e-11 | 5.50e-01 | 0.0875 |
| 23587 | ELP5 | P2T-E | Human | Esophagus | ESCC | 1.51e-37 | 6.60e-01 | 0.1177 |
| Page: 1 2 3 4 5 6 |
| Tissue | Expression Dynamics | Abbreviation |
| Colorectum (GSE201348) |  | FAP: Familial adenomatous polyposis |
| CRC: Colorectal cancer | ||
| Colorectum (HTA11) |  | AD: Adenomas |
| SER: Sessile serrated lesions | ||
| MSI-H: Microsatellite-high colorectal cancer | ||
| MSS: Microsatellite stable colorectal cancer | ||
| Esophagus | 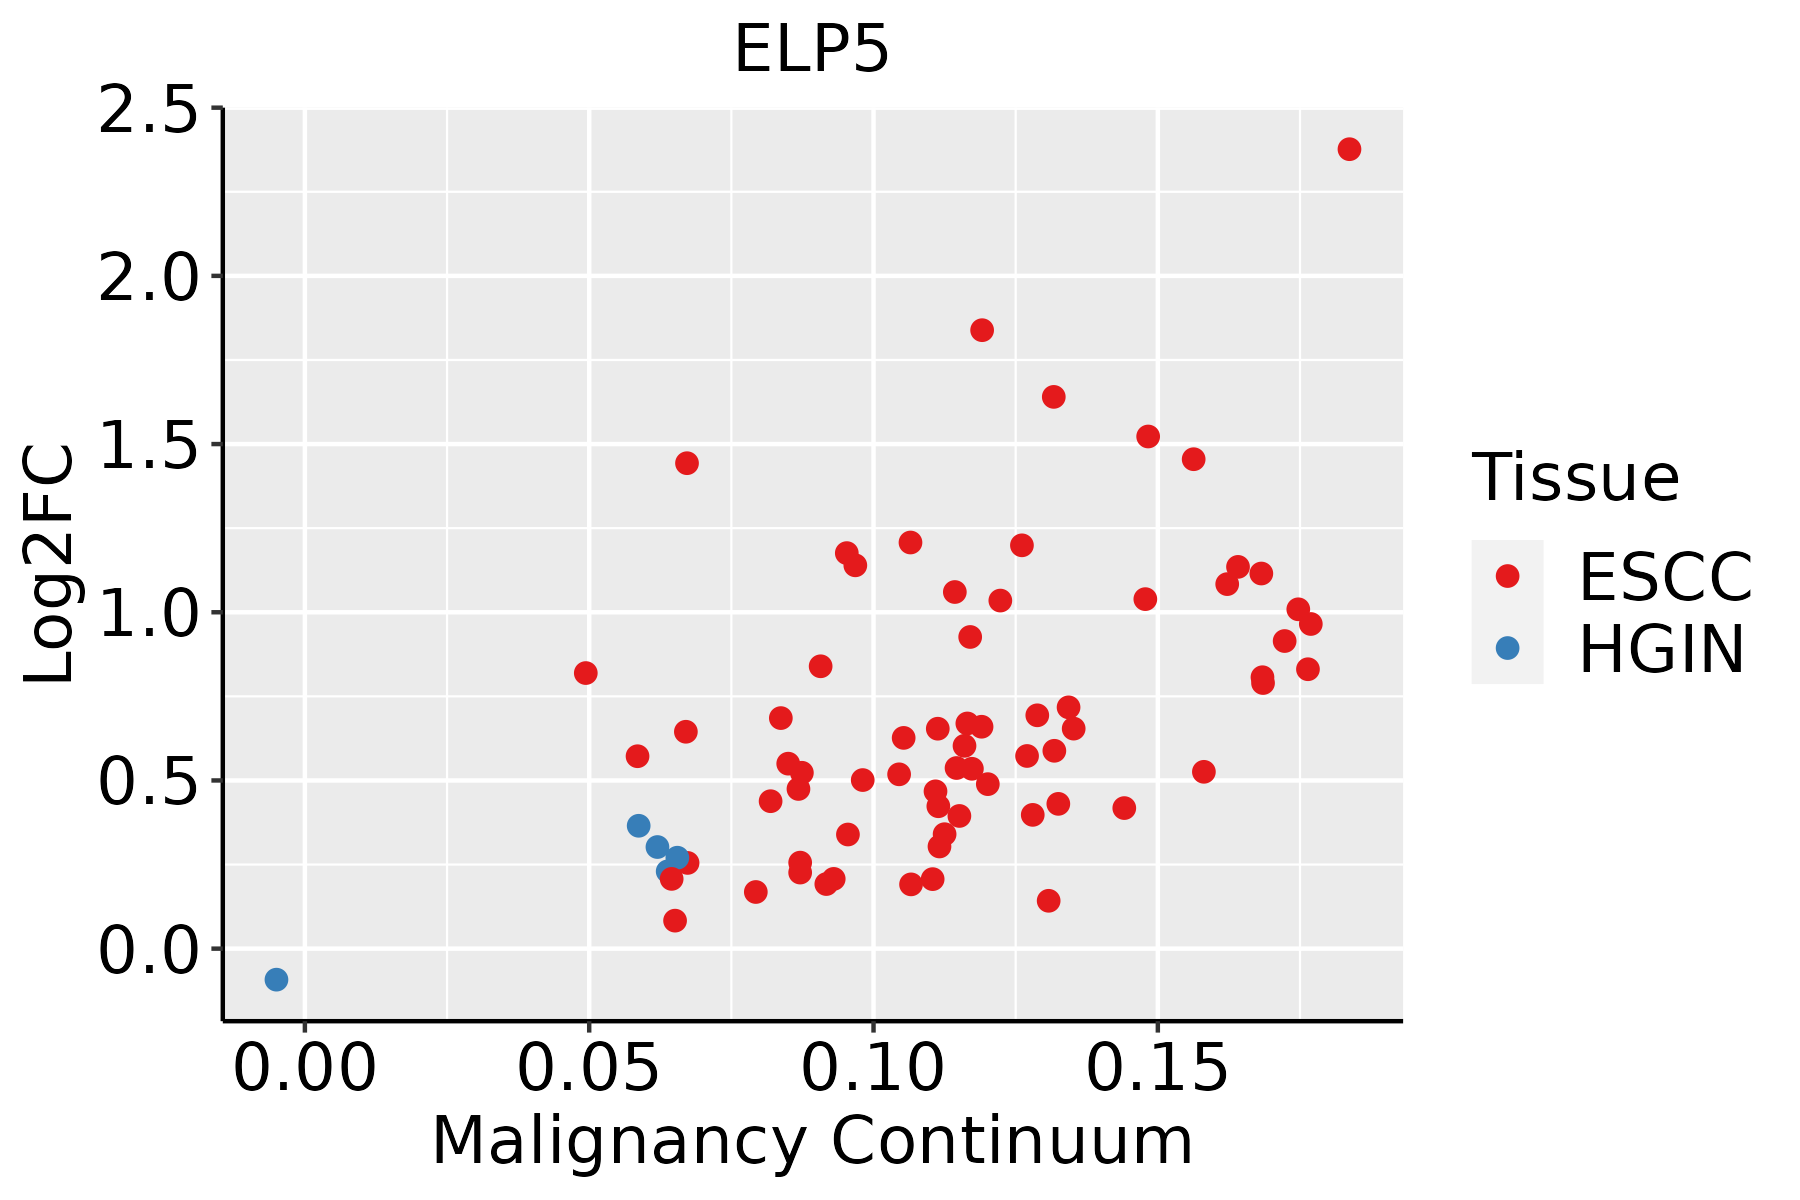 | ESCC: Esophageal squamous cell carcinoma |
| HGIN: High-grade intraepithelial neoplasias | ||
| LGIN: Low-grade intraepithelial neoplasias | ||
| Liver |  | HCC: Hepatocellular carcinoma |
| NAFLD: Non-alcoholic fatty liver disease | ||
| Oral Cavity | 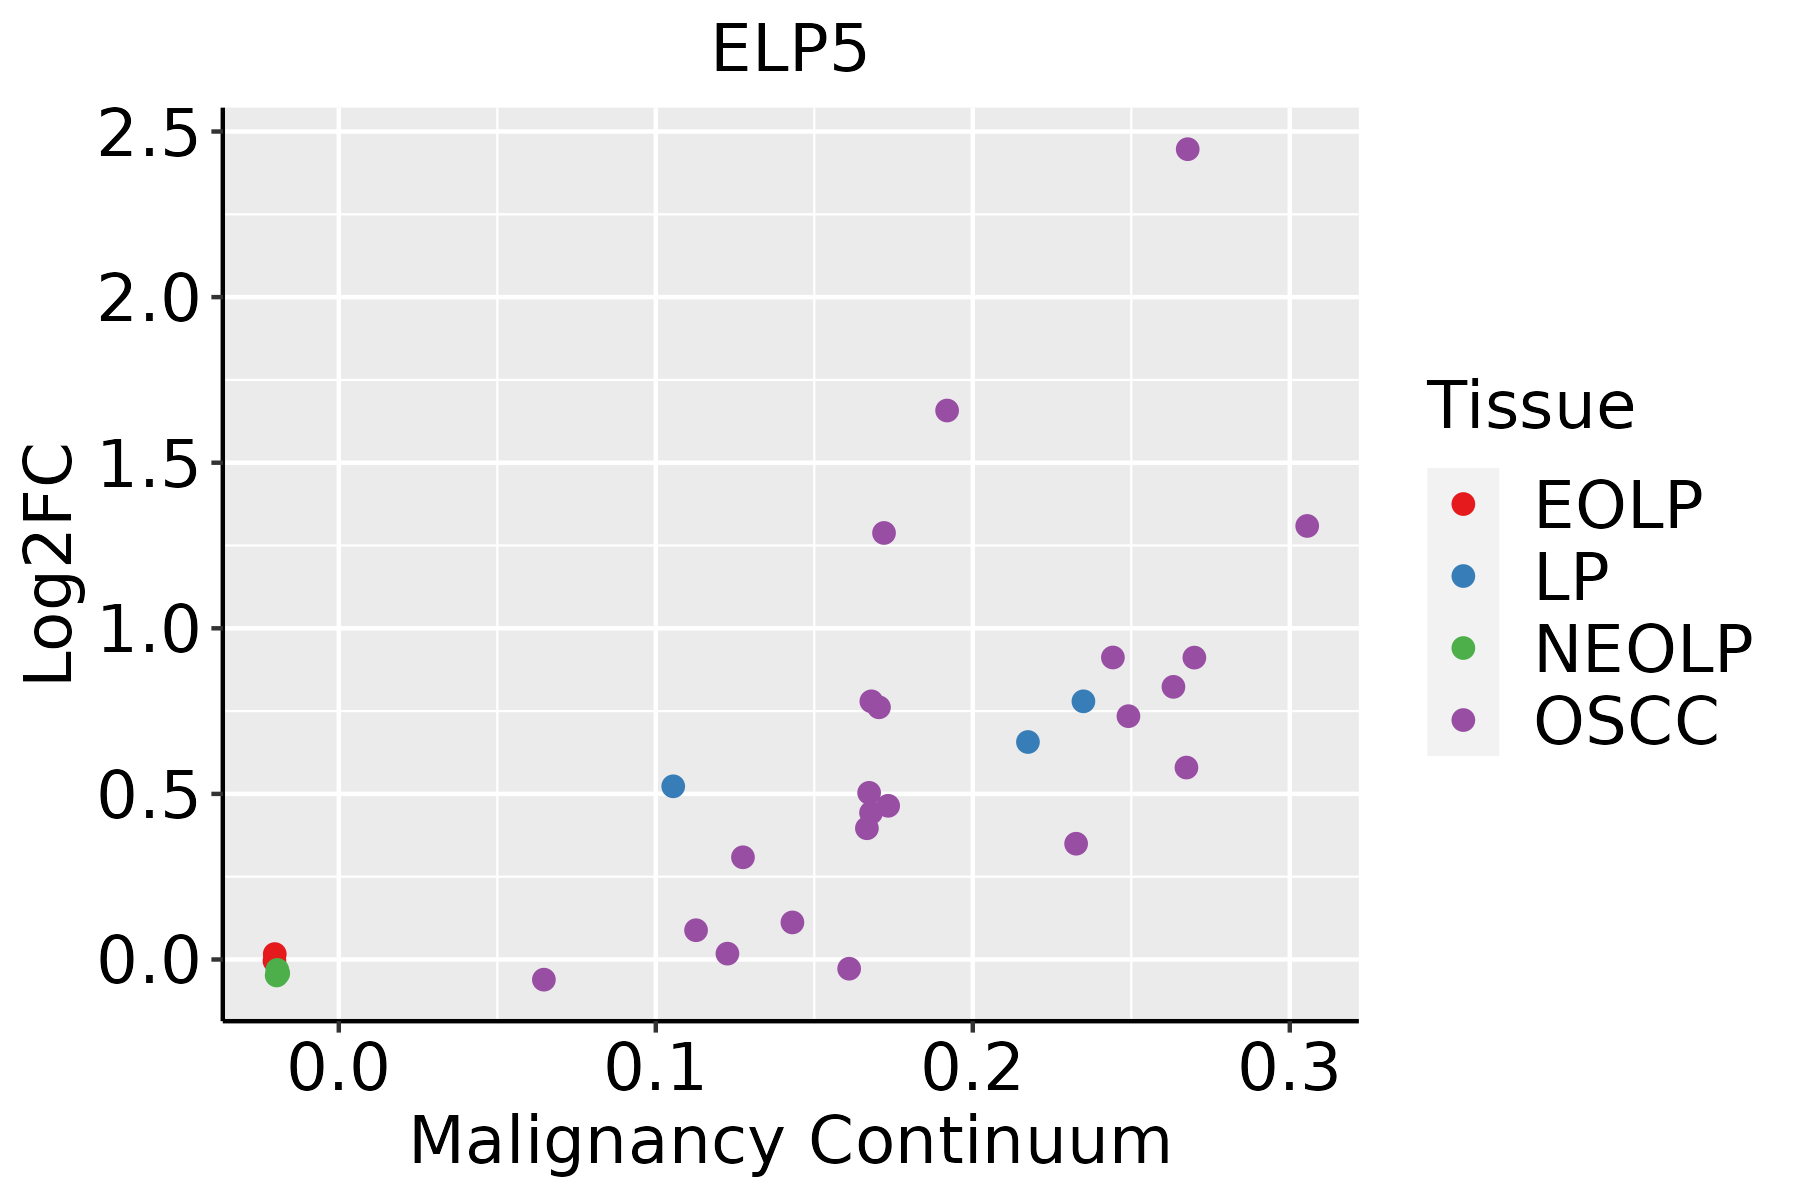 | EOLP: Erosive Oral lichen planus |
| LP: leukoplakia | ||
| NEOLP: Non-erosive oral lichen planus | ||
| OSCC: Oral squamous cell carcinoma | ||
| Skin |  | AK: Actinic keratosis |
| cSCC: Cutaneous squamous cell carcinoma | ||
| SCCIS:squamous cell carcinoma in situ | ||
| Thyroid | 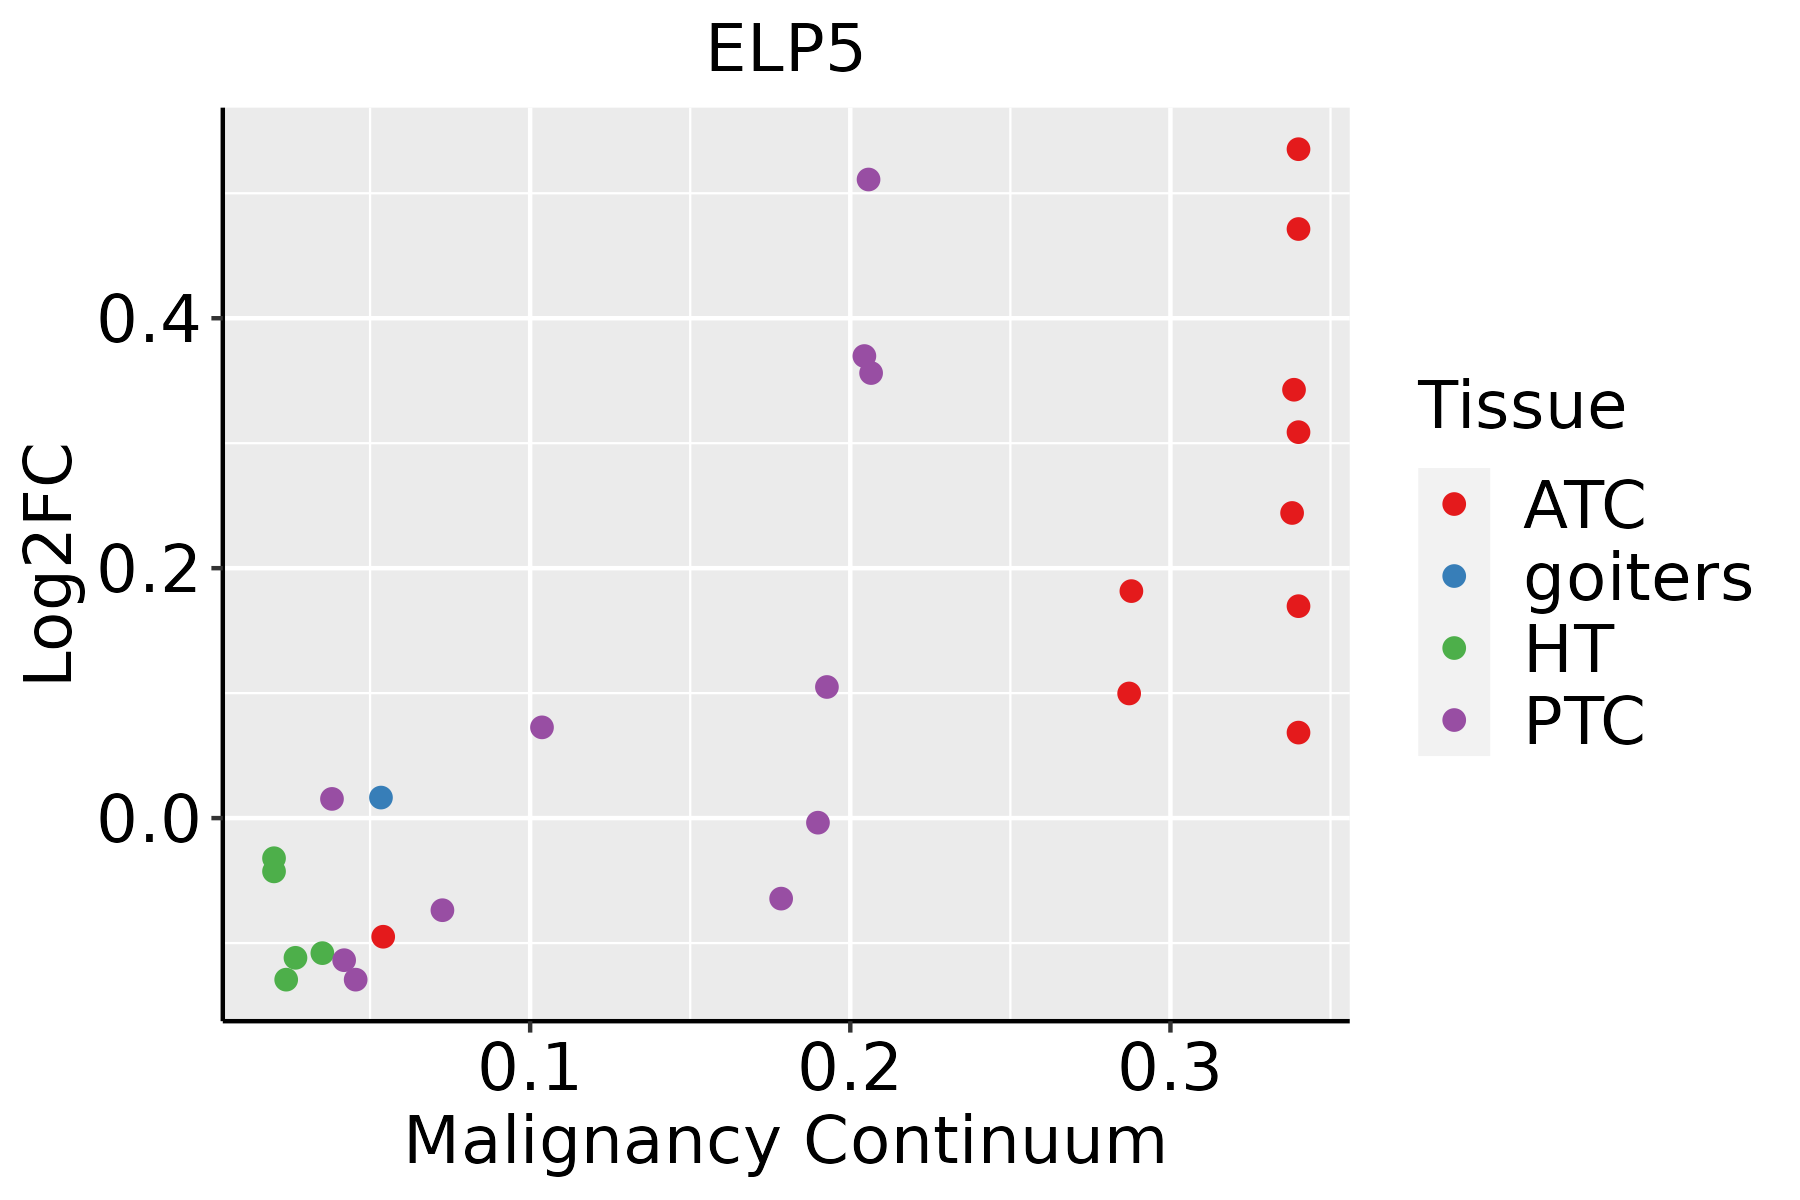 | ATC: Anaplastic thyroid cancer |
| HT: Hashimoto's thyroiditis | ||
| PTC: Papillary thyroid cancer |
| ∗log2FC in expression of this searched gene in stem-like cells from each diseased tissue sample relative to stem-like cells in normal samples in each tissue plotted against the malignancy continuum. Samples are colored based on if they are from different disease stage. |
Top |
Malignant transformation related pathway analysis |
| Find out the enriched GO biological processes and KEGG pathways involved in transition from healthy to precancer to cancer |
| Tissue | Disease Stage | Enriched GO biological Processes |
| Colorectum | AD |  |
| Colorectum | SER |  |
| Colorectum | MSS |  |
| Colorectum | MSI-H |  |
| Colorectum | FAP |  |
| ∗Top 15 enriched GO BP terms are showed in the bar plot of each disease state in each tissue. Each row represents a significant GO biological process which is colored according to the -log10(p.adjust). |
| Page: 1 2 3 4 5 6 7 8 9 |
| GO ID | Tissue | Disease Stage | Description | Gene Ratio | Bg Ratio | pvalue | p.adjust | Count |
| GO:003447010 | Esophagus | HGIN | ncRNA processing | 97/2587 | 395/18723 | 5.92e-09 | 3.90e-07 | 97 |
| GO:00346606 | Esophagus | HGIN | ncRNA metabolic process | 104/2587 | 485/18723 | 2.26e-06 | 8.23e-05 | 104 |
| GO:003447015 | Esophagus | ESCC | ncRNA processing | 300/8552 | 395/18723 | 3.09e-35 | 3.26e-32 | 300 |
| GO:003466012 | Esophagus | ESCC | ncRNA metabolic process | 346/8552 | 485/18723 | 4.35e-31 | 2.51e-28 | 346 |
| GO:00080333 | Esophagus | ESCC | tRNA processing | 92/8552 | 127/18723 | 7.83e-10 | 1.93e-08 | 92 |
| GO:00063992 | Esophagus | ESCC | tRNA metabolic process | 122/8552 | 179/18723 | 9.03e-10 | 2.19e-08 | 122 |
| GO:00094512 | Esophagus | ESCC | RNA modification | 114/8552 | 167/18723 | 2.76e-09 | 6.04e-08 | 114 |
| GO:00064002 | Esophagus | ESCC | tRNA modification | 62/8552 | 90/18723 | 7.02e-06 | 7.04e-05 | 62 |
| GO:00344701 | Liver | Cirrhotic | ncRNA processing | 158/4634 | 395/18723 | 1.09e-11 | 6.96e-10 | 158 |
| GO:00346603 | Liver | Cirrhotic | ncRNA metabolic process | 173/4634 | 485/18723 | 3.64e-08 | 1.21e-06 | 173 |
| GO:00344702 | Liver | HCC | ncRNA processing | 293/7958 | 395/18723 | 4.26e-38 | 6.76e-35 | 293 |
| GO:00346601 | Liver | HCC | ncRNA metabolic process | 332/7958 | 485/18723 | 1.48e-31 | 7.80e-29 | 332 |
| GO:0008033 | Liver | HCC | tRNA processing | 87/7958 | 127/18723 | 2.66e-09 | 7.23e-08 | 87 |
| GO:0006399 | Liver | HCC | tRNA metabolic process | 108/7958 | 179/18723 | 1.07e-06 | 1.59e-05 | 108 |
| GO:0009451 | Liver | HCC | RNA modification | 101/7958 | 167/18723 | 2.02e-06 | 2.78e-05 | 101 |
| GO:0006400 | Liver | HCC | tRNA modification | 60/7958 | 90/18723 | 3.09e-06 | 4.09e-05 | 60 |
| GO:00344709 | Oral cavity | OSCC | ncRNA processing | 263/7305 | 395/18723 | 4.38e-29 | 2.78e-26 | 263 |
| GO:00346605 | Oral cavity | OSCC | ncRNA metabolic process | 296/7305 | 485/18723 | 2.94e-23 | 6.65e-21 | 296 |
| GO:00080332 | Oral cavity | OSCC | tRNA processing | 78/7305 | 127/18723 | 2.56e-07 | 4.00e-06 | 78 |
| GO:00063991 | Oral cavity | OSCC | tRNA metabolic process | 101/7305 | 179/18723 | 1.65e-06 | 2.15e-05 | 101 |
| Page: 1 2 |
| Pathway ID | Tissue | Disease Stage | Description | Gene Ratio | Bg Ratio | pvalue | p.adjust | qvalue | Count |
| Page: 1 |
Top |
Cell-cell communication analysis |
| Identification of potential cell-cell interactions between two cell types and their ligand-receptor pairs for different disease states |
| Ligand | Receptor | LRpair | Pathway | Tissue | Disease Stage |
| Page: 1 |
Top |
Single-cell gene regulatory network inference analysis |
| Find out the significant the regulons (TFs) and the target genes of each regulon across cell types for different disease states |
| TF | Cell Type | Tissue | Disease Stage | Target Gene | RSS | Regulon Activity |
| ∗The dot plots of a searched regulon are shown for all cell subpopulations in each disease state of each tissue based on the regulon specific score inferred using pySCENIC and by calculating the average expression. |
| Page: 1 |
Top |
Somatic mutation of malignant transformation related genes |
| Annotation of somatic variants for genes involved in malignant transformation |
| Hugo Symbol | Variant Class | Variant Classification | dbSNP RS | HGVSc | HGVSp | HGVSp Short | SWISSPROT | BIOTYPE | SIFT | PolyPhen | Tumor Sample Barcode | Tissue | Histology | Sex | Age | Stage | Therapy Types | Drugs | Outcome |
| ELP5 | SNV | Missense_Mutation | novel | c.182N>A | p.Cys61Tyr | p.C61Y | Q8TE02 | protein_coding | tolerated(0.38) | possibly_damaging(0.776) | TCGA-3C-AALI-01 | Breast | breast invasive carcinoma | Female | <65 | I/II | Unspecific | Poly E | Complete Response |
| ELP5 | SNV | Missense_Mutation | novel | c.301N>A | p.Gly101Arg | p.G101R | Q8TE02 | protein_coding | tolerated(0.52) | possibly_damaging(0.771) | TCGA-A2-A4RW-01 | Breast | breast invasive carcinoma | Female | <65 | III/IV | Unknown | Unknown | SD |
| ELP5 | SNV | Missense_Mutation | c.377N>C | p.Leu126Pro | p.L126P | Q8TE02 | protein_coding | deleterious(0) | probably_damaging(0.999) | TCGA-A7-A0DA-01 | Breast | breast invasive carcinoma | Female | <65 | I/II | Chemotherapy | adriamycin | SD | |
| ELP5 | SNV | Missense_Mutation | c.336N>C | p.Lys112Asn | p.K112N | Q8TE02 | protein_coding | tolerated(0.05) | benign(0.187) | TCGA-B6-A0RV-01 | Breast | breast invasive carcinoma | Female | <65 | III/IV | Unknown | Unknown | SD | |
| ELP5 | SNV | Missense_Mutation | c.626N>A | p.Arg209His | p.R209H | Q8TE02 | protein_coding | tolerated(0.17) | benign(0.005) | TCGA-CM-6162-01 | Colorectum | colon adenocarcinoma | Female | <65 | III/IV | Chemotherapy | oxaliplatin | SD | |
| ELP5 | SNV | Missense_Mutation | c.359N>T | p.Thr120Ile | p.T120I | Q8TE02 | protein_coding | deleterious(0) | probably_damaging(0.999) | TCGA-CM-6171-01 | Colorectum | colon adenocarcinoma | Female | >=65 | I/II | Unknown | Unknown | SD | |
| ELP5 | SNV | Missense_Mutation | novel | c.271N>G | p.Asn91Asp | p.N91D | Q8TE02 | protein_coding | tolerated(0.47) | benign(0.197) | TCGA-F5-6814-01 | Colorectum | rectum adenocarcinoma | Male | <65 | I/II | Unknown | Unknown | SD |
| ELP5 | SNV | Missense_Mutation | rs201957922 | c.853C>T | p.Arg285Trp | p.R285W | Q8TE02 | protein_coding | deleterious(0.01) | possibly_damaging(0.765) | TCGA-AP-A0LM-01 | Endometrium | uterine corpus endometrioid carcinoma | Female | <65 | III/IV | Chemotherapy | cisplatin | SD |
| ELP5 | SNV | Missense_Mutation | novel | c.307N>T | p.Pro103Ser | p.P103S | Q8TE02 | protein_coding | tolerated(0.22) | probably_damaging(0.999) | TCGA-AP-A1DK-01 | Endometrium | uterine corpus endometrioid carcinoma | Female | <65 | I/II | Unknown | Unknown | SD |
| ELP5 | SNV | Missense_Mutation | novel | c.313G>A | p.Gly105Arg | p.G105R | Q8TE02 | protein_coding | tolerated(0.14) | benign(0.172) | TCGA-B5-A1MX-01 | Endometrium | uterine corpus endometrioid carcinoma | Female | <65 | I/II | Hormone Therapy | megace | SD |
| Page: 1 2 3 4 |
Top |
Related drugs of malignant transformation related genes |
| Identification of chemicals and drugs interact with genes involved in malignant transfromation |
| (DGIdb 4.0) |
| Entrez ID | Symbol | Category | Interaction Types | Drug Claim Name | Drug Name | PMIDs |
| 23587 | ELP5 | NA | methylphenidate | METHYLPHENIDATE | 29382897 |
| Page: 1 |

Copyright 2023-Present -The University of Texas Health Science Center at Houston |