
|
|||||
|
 | |
| |
| |
| |
| |
| |
|
Gene: ELP4 |
Gene summary for ELP4 |
| Gene information | Species | Human | Gene symbol | ELP4 | Gene ID | 26610 |
| Gene name | elongator acetyltransferase complex subunit 4 | |
| Gene Alias | AN | |
| Cytomap | 11p13 | |
| Gene Type | protein-coding | GO ID | GO:0002097 | UniProtAcc | Q96EB1 |
Top |
Malignant transformation analysis |
| Identification of the aberrant gene expression in precancerous and cancerous lesions by comparing the gene expression of stem-like cells in diseased tissues with normal stem cells |
| Entrez ID | Symbol | Replicates | Species | Organ | Tissue | Adj P-value | Log2FC | Malignancy |
| 26610 | ELP4 | CCI_2 | Human | Cervix | CC | 9.31e-04 | 5.69e-01 | 0.5249 |
| 26610 | ELP4 | CCI_3 | Human | Cervix | CC | 1.04e-20 | 8.65e-01 | 0.516 |
| 26610 | ELP4 | HTA11_3410_2000001011 | Human | Colorectum | AD | 2.42e-17 | -5.92e-01 | 0.0155 |
| 26610 | ELP4 | HTA11_2487_2000001011 | Human | Colorectum | SER | 7.82e-11 | -6.24e-01 | -0.1808 |
| 26610 | ELP4 | HTA11_1938_2000001011 | Human | Colorectum | AD | 8.50e-03 | -3.49e-01 | -0.0811 |
| 26610 | ELP4 | HTA11_78_2000001011 | Human | Colorectum | AD | 7.77e-06 | -4.75e-01 | -0.1088 |
| 26610 | ELP4 | HTA11_3361_2000001011 | Human | Colorectum | AD | 4.77e-06 | -5.74e-01 | -0.1207 |
| 26610 | ELP4 | HTA11_696_2000001011 | Human | Colorectum | AD | 3.37e-17 | -4.80e-01 | -0.1464 |
| 26610 | ELP4 | HTA11_866_2000001011 | Human | Colorectum | AD | 2.36e-12 | -4.72e-01 | -0.1001 |
| 26610 | ELP4 | HTA11_1391_2000001011 | Human | Colorectum | AD | 1.97e-04 | -4.39e-01 | -0.059 |
| 26610 | ELP4 | HTA11_5212_2000001011 | Human | Colorectum | AD | 1.95e-03 | -6.56e-01 | -0.2061 |
| 26610 | ELP4 | HTA11_546_2000001011 | Human | Colorectum | AD | 5.63e-05 | -6.11e-01 | -0.0842 |
| 26610 | ELP4 | HTA11_7862_2000001011 | Human | Colorectum | AD | 5.84e-03 | -5.70e-01 | -0.0179 |
| 26610 | ELP4 | HTA11_866_3004761011 | Human | Colorectum | AD | 6.53e-11 | -5.37e-01 | 0.096 |
| 26610 | ELP4 | HTA11_8622_2000001021 | Human | Colorectum | SER | 3.88e-02 | -5.91e-01 | 0.0528 |
| 26610 | ELP4 | HTA11_10711_2000001011 | Human | Colorectum | AD | 4.67e-08 | -5.57e-01 | 0.0338 |
| 26610 | ELP4 | HTA11_7696_3000711011 | Human | Colorectum | AD | 4.29e-17 | -5.46e-01 | 0.0674 |
| 26610 | ELP4 | HTA11_6818_2000001021 | Human | Colorectum | AD | 1.01e-06 | -6.11e-01 | 0.0588 |
| 26610 | ELP4 | HTA11_99999970781_79442 | Human | Colorectum | MSS | 1.46e-20 | -5.88e-01 | 0.294 |
| 26610 | ELP4 | HTA11_99999971662_82457 | Human | Colorectum | MSS | 2.48e-16 | -5.39e-01 | 0.3859 |
| Page: 1 2 3 4 5 6 |
| Tissue | Expression Dynamics | Abbreviation |
| Cervix |  | CC: Cervix cancer |
| HSIL_HPV: HPV-infected high-grade squamous intraepithelial lesions | ||
| N_HPV: HPV-infected normal cervix | ||
| Colorectum (GSE201348) |  | FAP: Familial adenomatous polyposis |
| CRC: Colorectal cancer | ||
| Colorectum (HTA11) |  | AD: Adenomas |
| SER: Sessile serrated lesions | ||
| MSI-H: Microsatellite-high colorectal cancer | ||
| MSS: Microsatellite stable colorectal cancer | ||
| Esophagus |  | ESCC: Esophageal squamous cell carcinoma |
| HGIN: High-grade intraepithelial neoplasias | ||
| LGIN: Low-grade intraepithelial neoplasias | ||
| Oral Cavity | 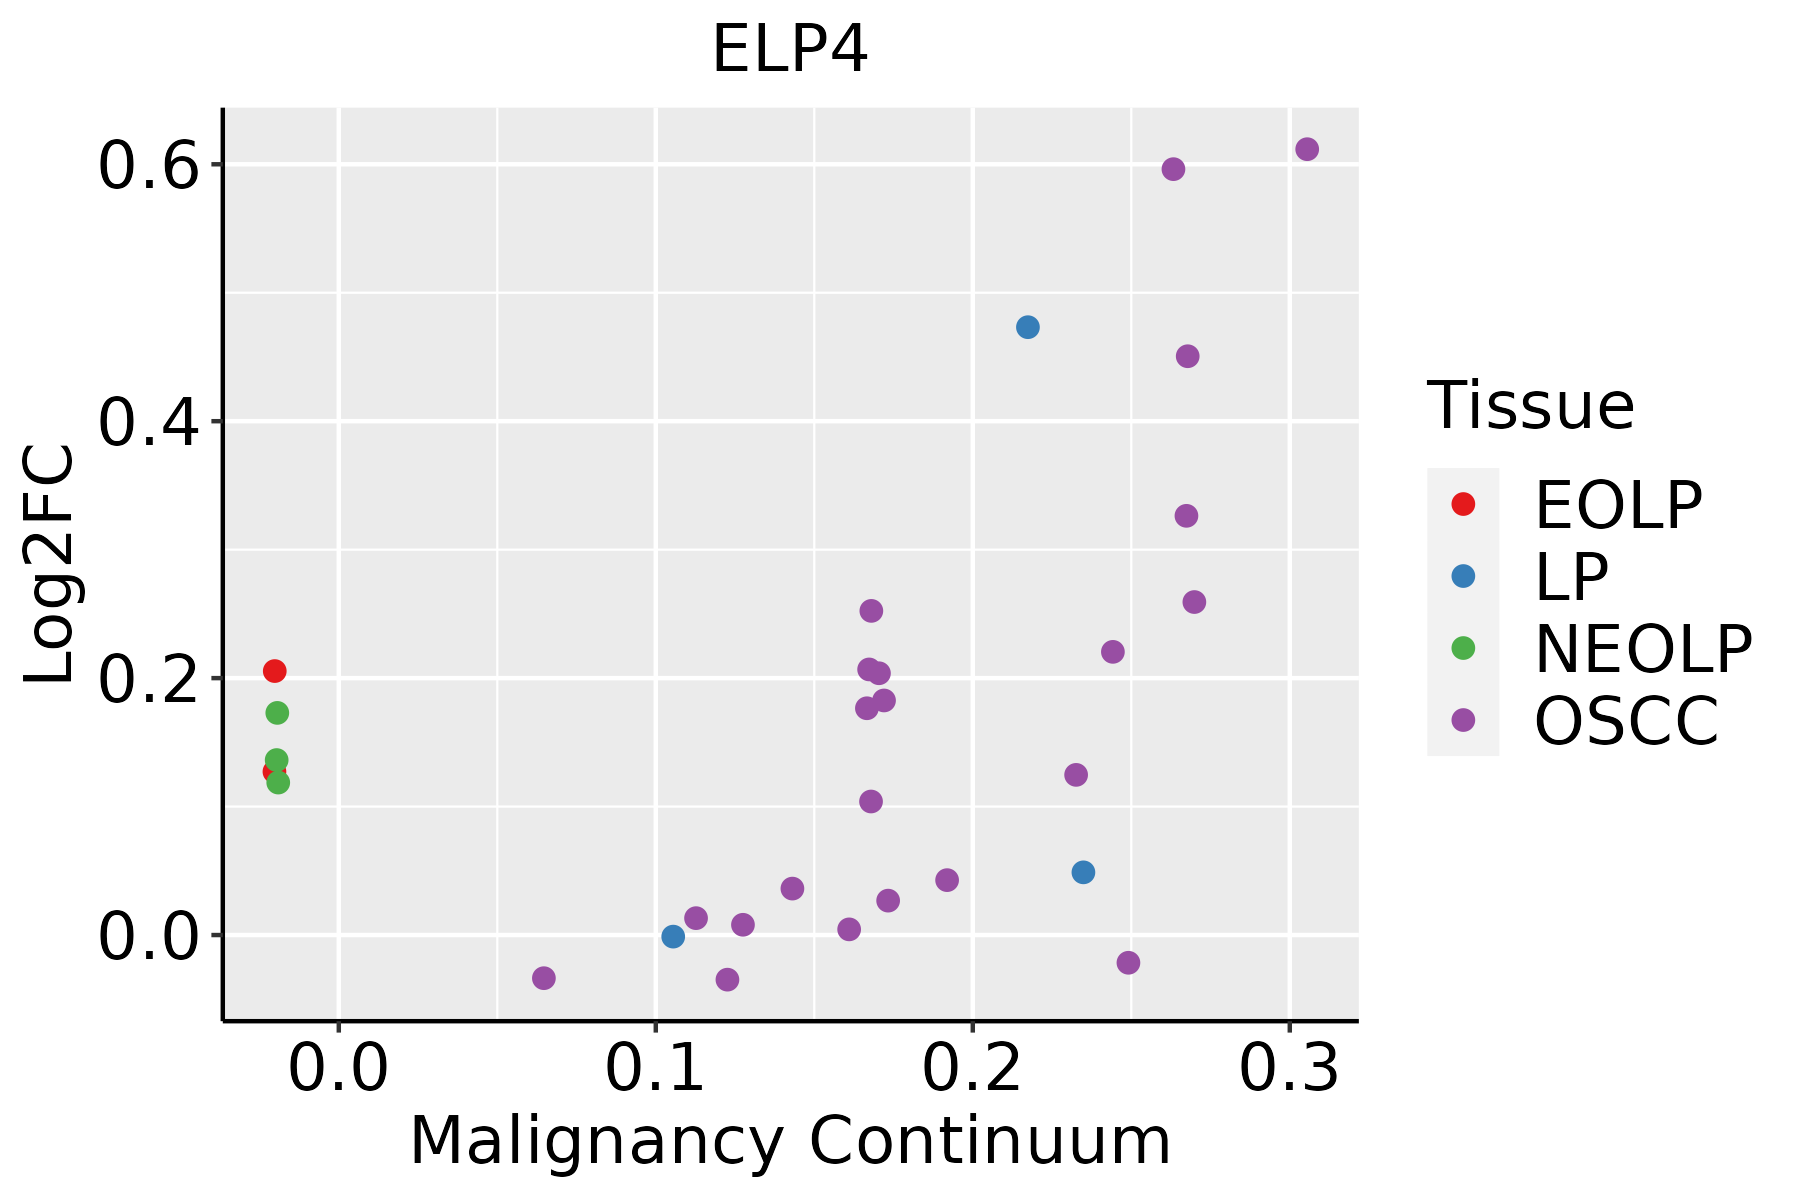 | EOLP: Erosive Oral lichen planus |
| LP: leukoplakia | ||
| NEOLP: Non-erosive oral lichen planus | ||
| OSCC: Oral squamous cell carcinoma |
| ∗log2FC in expression of this searched gene in stem-like cells from each diseased tissue sample relative to stem-like cells in normal samples in each tissue plotted against the malignancy continuum. Samples are colored based on if they are from different disease stage. |
Top |
Malignant transformation related pathway analysis |
| Find out the enriched GO biological processes and KEGG pathways involved in transition from healthy to precancer to cancer |
| Tissue | Disease Stage | Enriched GO biological Processes |
| Colorectum | AD |  |
| Colorectum | SER |  |
| Colorectum | MSS |  |
| Colorectum | MSI-H |  |
| Colorectum | FAP |  |
| ∗Top 15 enriched GO BP terms are showed in the bar plot of each disease state in each tissue. Each row represents a significant GO biological process which is colored according to the -log10(p.adjust). |
| Page: 1 2 3 4 5 6 7 8 9 |
| GO ID | Tissue | Disease Stage | Description | Gene Ratio | Bg Ratio | pvalue | p.adjust | Count |
| GO:00063684 | Cervix | CC | transcription elongation from RNA polymerase II promoter | 17/2311 | 69/18723 | 3.65e-03 | 2.33e-02 | 17 |
| GO:00063545 | Cervix | CC | DNA-templated transcription, elongation | 20/2311 | 91/18723 | 6.88e-03 | 3.74e-02 | 20 |
| GO:0006354 | Colorectum | AD | DNA-templated transcription, elongation | 31/3918 | 91/18723 | 2.46e-03 | 1.90e-02 | 31 |
| GO:0006368 | Colorectum | AD | transcription elongation from RNA polymerase II promoter | 24/3918 | 69/18723 | 5.35e-03 | 3.52e-02 | 24 |
| GO:00063541 | Colorectum | MSS | DNA-templated transcription, elongation | 29/3467 | 91/18723 | 1.52e-03 | 1.39e-02 | 29 |
| GO:00063681 | Colorectum | MSS | transcription elongation from RNA polymerase II promoter | 22/3467 | 69/18723 | 5.31e-03 | 3.62e-02 | 22 |
| GO:00063682 | Colorectum | FAP | transcription elongation from RNA polymerase II promoter | 20/2622 | 69/18723 | 9.25e-04 | 9.26e-03 | 20 |
| GO:00063542 | Colorectum | FAP | DNA-templated transcription, elongation | 24/2622 | 91/18723 | 1.32e-03 | 1.22e-02 | 24 |
| GO:00063543 | Colorectum | CRC | DNA-templated transcription, elongation | 19/2078 | 91/18723 | 4.74e-03 | 3.67e-02 | 19 |
| GO:003447015 | Esophagus | ESCC | ncRNA processing | 300/8552 | 395/18723 | 3.09e-35 | 3.26e-32 | 300 |
| GO:003466012 | Esophagus | ESCC | ncRNA metabolic process | 346/8552 | 485/18723 | 4.35e-31 | 2.51e-28 | 346 |
| GO:000635414 | Esophagus | ESCC | DNA-templated transcription, elongation | 76/8552 | 91/18723 | 8.35e-14 | 4.11e-12 | 76 |
| GO:00080333 | Esophagus | ESCC | tRNA processing | 92/8552 | 127/18723 | 7.83e-10 | 1.93e-08 | 92 |
| GO:00063992 | Esophagus | ESCC | tRNA metabolic process | 122/8552 | 179/18723 | 9.03e-10 | 2.19e-08 | 122 |
| GO:000636814 | Esophagus | ESCC | transcription elongation from RNA polymerase II promoter | 56/8552 | 69/18723 | 1.40e-09 | 3.30e-08 | 56 |
| GO:00094512 | Esophagus | ESCC | RNA modification | 114/8552 | 167/18723 | 2.76e-09 | 6.04e-08 | 114 |
| GO:00064002 | Esophagus | ESCC | tRNA modification | 62/8552 | 90/18723 | 7.02e-06 | 7.04e-05 | 62 |
| GO:00344709 | Oral cavity | OSCC | ncRNA processing | 263/7305 | 395/18723 | 4.38e-29 | 2.78e-26 | 263 |
| GO:00346605 | Oral cavity | OSCC | ncRNA metabolic process | 296/7305 | 485/18723 | 2.94e-23 | 6.65e-21 | 296 |
| GO:00063547 | Oral cavity | OSCC | DNA-templated transcription, elongation | 63/7305 | 91/18723 | 4.86e-09 | 1.07e-07 | 63 |
| Page: 1 2 |
| Pathway ID | Tissue | Disease Stage | Description | Gene Ratio | Bg Ratio | pvalue | p.adjust | qvalue | Count |
| Page: 1 |
Top |
Cell-cell communication analysis |
| Identification of potential cell-cell interactions between two cell types and their ligand-receptor pairs for different disease states |
| Ligand | Receptor | LRpair | Pathway | Tissue | Disease Stage |
| Page: 1 |
Top |
Single-cell gene regulatory network inference analysis |
| Find out the significant the regulons (TFs) and the target genes of each regulon across cell types for different disease states |
| TF | Cell Type | Tissue | Disease Stage | Target Gene | RSS | Regulon Activity |
| ∗The dot plots of a searched regulon are shown for all cell subpopulations in each disease state of each tissue based on the regulon specific score inferred using pySCENIC and by calculating the average expression. |
| Page: 1 |
Top |
Somatic mutation of malignant transformation related genes |
| Annotation of somatic variants for genes involved in malignant transformation |
| Hugo Symbol | Variant Class | Variant Classification | dbSNP RS | HGVSc | HGVSp | HGVSp Short | SWISSPROT | BIOTYPE | SIFT | PolyPhen | Tumor Sample Barcode | Tissue | Histology | Sex | Age | Stage | Therapy Types | Drugs | Outcome |
| ELP4 | SNV | Missense_Mutation | novel | c.722N>G | p.Asp241Gly | p.D241G | protein_coding | deleterious(0.04) | probably_damaging(0.948) | TCGA-AO-A128-01 | Breast | breast invasive carcinoma | Female | <65 | I/II | Chemotherapy | doxorubicin | SD | |
| ELP4 | SNV | Missense_Mutation | rs200030873 | c.723N>A | p.Asp241Glu | p.D241E | protein_coding | tolerated(0.12) | probably_damaging(0.962) | TCGA-AO-A128-01 | Breast | breast invasive carcinoma | Female | <65 | I/II | Chemotherapy | doxorubicin | SD | |
| ELP4 | SNV | Missense_Mutation | c.849N>C | p.Lys283Asn | p.K283N | protein_coding | deleterious(0.05) | possibly_damaging(0.765) | TCGA-D8-A1XG-01 | Breast | breast invasive carcinoma | Female | >=65 | III/IV | Unknown | Unknown | SD | ||
| ELP4 | SNV | Missense_Mutation | novel | c.773N>G | p.Gln258Arg | p.Q258R | protein_coding | tolerated(0.07) | possibly_damaging(0.798) | TCGA-VS-A9V2-01 | Cervix | cervical & endocervical cancer | Female | <65 | I/II | Unknown | Unknown | SD | |
| ELP4 | SNV | Missense_Mutation | rs748618717 | c.673A>G | p.Thr225Ala | p.T225A | protein_coding | tolerated(0.62) | benign(0.007) | TCGA-AZ-4315-01 | Colorectum | colon adenocarcinoma | Male | <65 | I/II | Unknown | Unknown | SD | |
| ELP4 | SNV | Missense_Mutation | rs776578960 | c.1573G>A | p.Asp525Asn | p.D525N | protein_coding | possibly_damaging(0.797) | TCGA-AZ-4615-01 | Colorectum | colon adenocarcinoma | Male | >=65 | III/IV | Chemotherapy | xeloda | PD | ||
| ELP4 | SNV | Missense_Mutation | novel | c.250N>A | p.Leu84Ile | p.L84I | protein_coding | tolerated(0.11) | probably_damaging(0.937) | TCGA-CA-6717-01 | Colorectum | colon adenocarcinoma | Male | <65 | I/II | Chemotherapy | oxaliplatin | CR | |
| ELP4 | SNV | Missense_Mutation | novel | c.581N>G | p.Leu194Arg | p.L194R | protein_coding | tolerated(0.07) | possibly_damaging(0.523) | TCGA-CA-6717-01 | Colorectum | colon adenocarcinoma | Male | <65 | I/II | Chemotherapy | oxaliplatin | CR | |
| ELP4 | SNV | Missense_Mutation | novel | c.1549N>G | p.Phe517Val | p.F517V | protein_coding | probably_damaging(0.983) | TCGA-AG-A002-01 | Colorectum | rectum adenocarcinoma | Male | <65 | I/II | Unknown | Unknown | SD | ||
| ELP4 | SNV | Missense_Mutation | novel | c.1538N>T | p.Ala513Val | p.A513V | protein_coding | probably_damaging(0.988) | TCGA-AG-A00Y-01 | Colorectum | rectum adenocarcinoma | Male | >=65 | I/II | Unknown | Unknown | PD |
| Page: 1 2 3 4 5 |
Top |
Related drugs of malignant transformation related genes |
| Identification of chemicals and drugs interact with genes involved in malignant transfromation |
| (DGIdb 4.0) |
| Entrez ID | Symbol | Category | Interaction Types | Drug Claim Name | Drug Name | PMIDs |
| Page: 1 |

Copyright 2023-Present -The University of Texas Health Science Center at Houston |