
|
|||||
|
 | |
| |
| |
| |
| |
| |
|
Gene: ELP3 |
Gene summary for ELP3 |
| Gene information | Species | Human | Gene symbol | ELP3 | Gene ID | 55140 |
| Gene name | elongator acetyltransferase complex subunit 3 | |
| Gene Alias | KAT9 | |
| Cytomap | 8p21.1 | |
| Gene Type | protein-coding | GO ID | GO:0001764 | UniProtAcc | B4DKA4 |
Top |
Malignant transformation analysis |
| Identification of the aberrant gene expression in precancerous and cancerous lesions by comparing the gene expression of stem-like cells in diseased tissues with normal stem cells |
| Entrez ID | Symbol | Replicates | Species | Organ | Tissue | Adj P-value | Log2FC | Malignancy |
| 55140 | ELP3 | AEH-subject3 | Human | Endometrium | AEH | 1.51e-04 | 3.06e-01 | -0.2576 |
| 55140 | ELP3 | AEH-subject4 | Human | Endometrium | AEH | 1.54e-04 | 3.45e-01 | -0.2657 |
| 55140 | ELP3 | AEH-subject5 | Human | Endometrium | AEH | 4.65e-06 | 4.30e-01 | -0.2953 |
| 55140 | ELP3 | EEC-subject1 | Human | Endometrium | EEC | 2.37e-02 | 2.64e-01 | -0.2682 |
| 55140 | ELP3 | EEC-subject4 | Human | Endometrium | EEC | 1.19e-23 | 7.25e-01 | -0.2571 |
| 55140 | ELP3 | GSM6177620_NYU_UCEC1_lib1_lib1 | Human | Endometrium | EEC | 3.03e-07 | 8.50e-03 | -0.1869 |
| 55140 | ELP3 | GSM6177620_NYU_UCEC1_lib2_lib2 | Human | Endometrium | EEC | 3.78e-05 | 1.56e-03 | -0.1875 |
| 55140 | ELP3 | GSM6177620_NYU_UCEC1_lib3_lib3 | Human | Endometrium | EEC | 4.39e-11 | 2.14e-01 | -0.1883 |
| 55140 | ELP3 | GSM6177621_NYU_UCEC2_lib1_lib1 | Human | Endometrium | EEC | 1.37e-08 | 3.65e-01 | -0.1934 |
| 55140 | ELP3 | GSM6177622_NYU_UCEC3_lib1_lib1 | Human | Endometrium | EEC | 1.09e-08 | 1.46e-02 | -0.1917 |
| 55140 | ELP3 | GSM6177622_NYU_UCEC3_lib2_lib2 | Human | Endometrium | EEC | 1.23e-11 | 2.45e-02 | -0.1916 |
| 55140 | ELP3 | LZE4T | Human | Esophagus | ESCC | 1.71e-05 | 1.04e-01 | 0.0811 |
| 55140 | ELP3 | LZE8T | Human | Esophagus | ESCC | 1.81e-03 | 6.19e-02 | 0.067 |
| 55140 | ELP3 | LZE20T | Human | Esophagus | ESCC | 5.22e-04 | 9.43e-02 | 0.0662 |
| 55140 | ELP3 | LZE24T | Human | Esophagus | ESCC | 2.04e-04 | 5.12e-02 | 0.0596 |
| 55140 | ELP3 | LZE21T | Human | Esophagus | ESCC | 2.34e-02 | 1.10e-01 | 0.0655 |
| 55140 | ELP3 | P2T-E | Human | Esophagus | ESCC | 1.63e-19 | 2.00e-01 | 0.1177 |
| 55140 | ELP3 | P4T-E | Human | Esophagus | ESCC | 8.96e-18 | 2.56e-01 | 0.1323 |
| 55140 | ELP3 | P5T-E | Human | Esophagus | ESCC | 5.35e-12 | 7.24e-02 | 0.1327 |
| 55140 | ELP3 | P8T-E | Human | Esophagus | ESCC | 6.07e-14 | 1.74e-01 | 0.0889 |
| Page: 1 2 3 4 5 |
| Tissue | Expression Dynamics | Abbreviation |
| Endometrium |  | AEH: Atypical endometrial hyperplasia |
| EEC: Endometrioid Cancer | ||
| Esophagus | 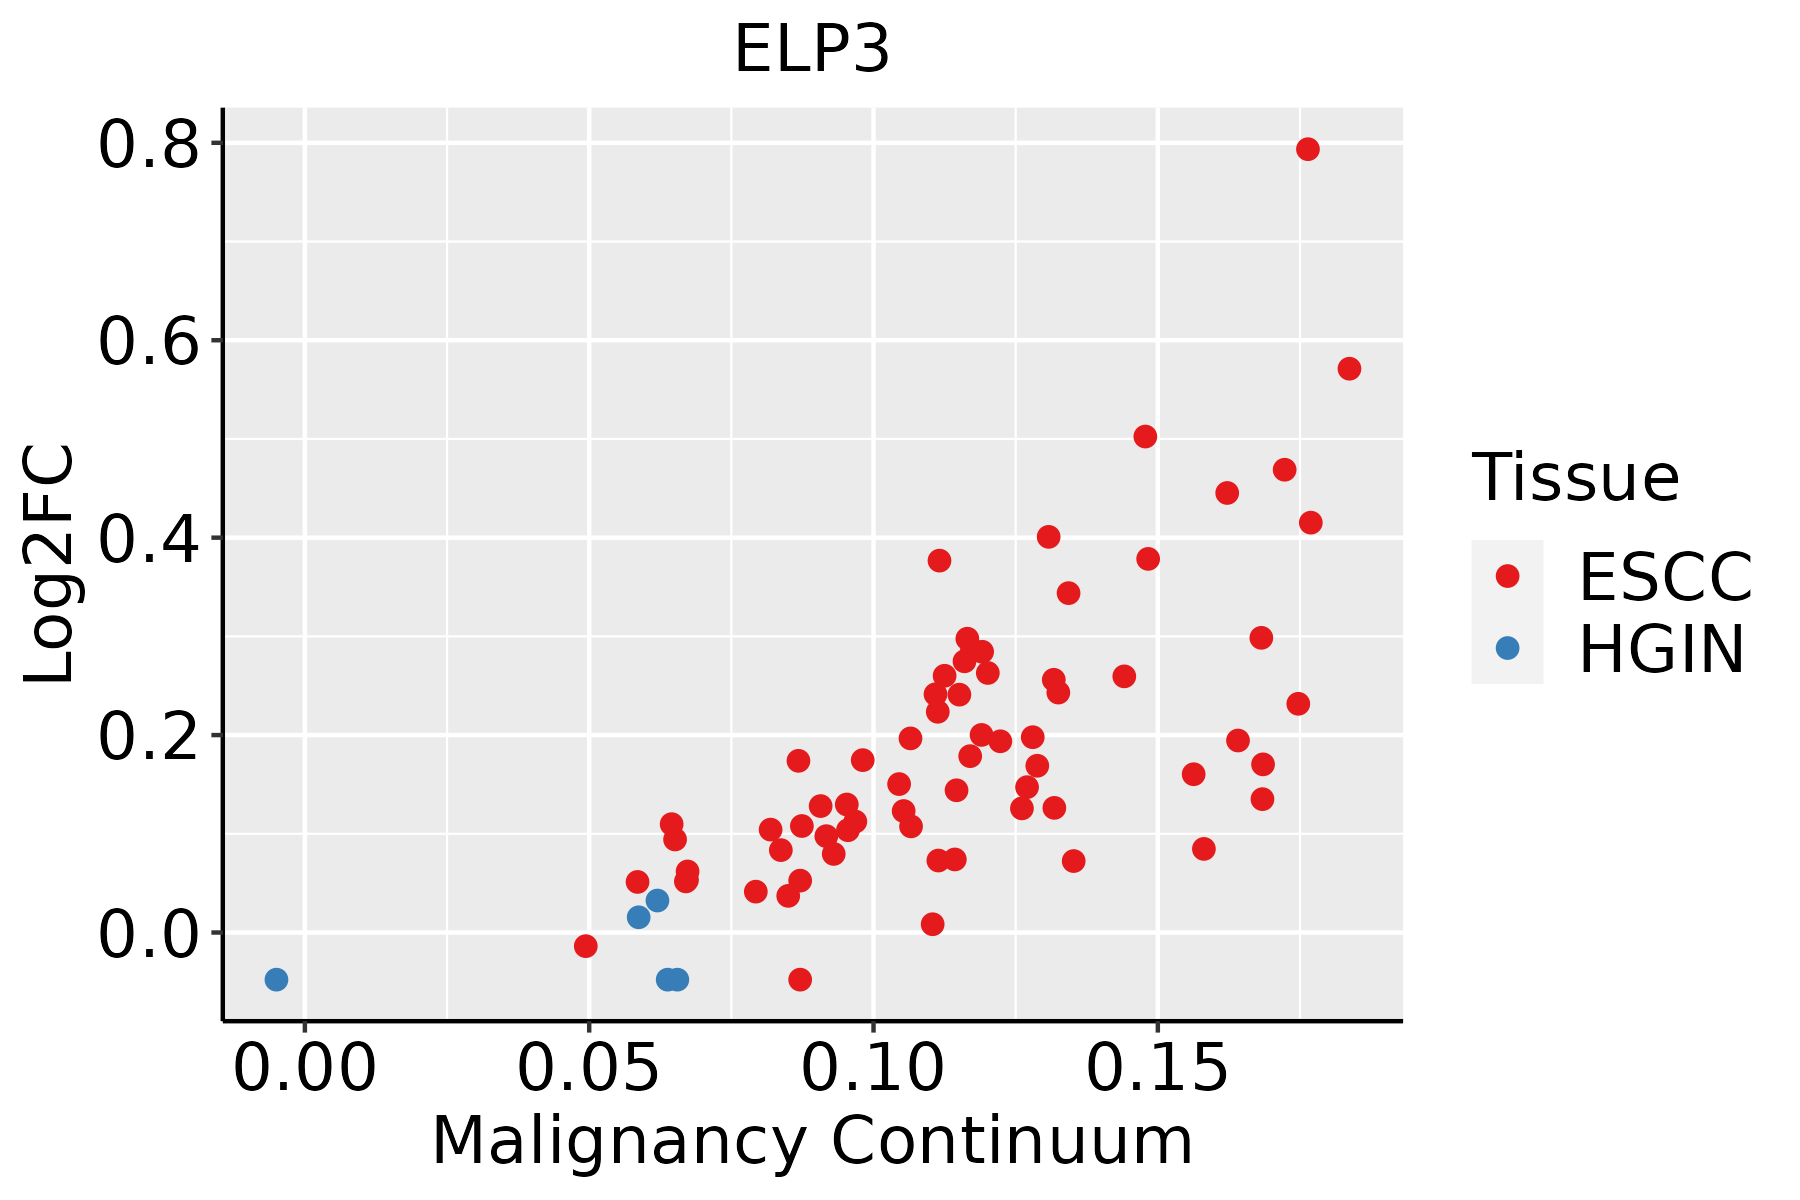 | ESCC: Esophageal squamous cell carcinoma |
| HGIN: High-grade intraepithelial neoplasias | ||
| LGIN: Low-grade intraepithelial neoplasias | ||
| Oral Cavity |  | EOLP: Erosive Oral lichen planus |
| LP: leukoplakia | ||
| NEOLP: Non-erosive oral lichen planus | ||
| OSCC: Oral squamous cell carcinoma |
| ∗log2FC in expression of this searched gene in stem-like cells from each diseased tissue sample relative to stem-like cells in normal samples in each tissue plotted against the malignancy continuum. Samples are colored based on if they are from different disease stage. |
Top |
Malignant transformation related pathway analysis |
| Find out the enriched GO biological processes and KEGG pathways involved in transition from healthy to precancer to cancer |
| Tissue | Disease Stage | Enriched GO biological Processes |
| Colorectum | AD |  |
| Colorectum | SER |  |
| Colorectum | MSS |  |
| Colorectum | MSI-H |  |
| Colorectum | FAP |  |
| ∗Top 15 enriched GO BP terms are showed in the bar plot of each disease state in each tissue. Each row represents a significant GO biological process which is colored according to the -log10(p.adjust). |
| Page: 1 2 3 4 5 6 7 8 9 |
| GO ID | Tissue | Disease Stage | Description | Gene Ratio | Bg Ratio | pvalue | p.adjust | Count |
| GO:00017642 | Endometrium | AEH | neuron migration | 31/2100 | 156/18723 | 1.08e-03 | 9.46e-03 | 31 |
| GO:00344707 | Endometrium | AEH | ncRNA processing | 62/2100 | 395/18723 | 3.93e-03 | 2.65e-02 | 62 |
| GO:00017641 | Endometrium | EEC | neuron migration | 33/2168 | 156/18723 | 4.17e-04 | 4.38e-03 | 33 |
| GO:003447012 | Endometrium | EEC | ncRNA processing | 63/2168 | 395/18723 | 5.20e-03 | 3.26e-02 | 63 |
| GO:003447015 | Esophagus | ESCC | ncRNA processing | 300/8552 | 395/18723 | 3.09e-35 | 3.26e-32 | 300 |
| GO:003466012 | Esophagus | ESCC | ncRNA metabolic process | 346/8552 | 485/18723 | 4.35e-31 | 2.51e-28 | 346 |
| GO:00080333 | Esophagus | ESCC | tRNA processing | 92/8552 | 127/18723 | 7.83e-10 | 1.93e-08 | 92 |
| GO:00063992 | Esophagus | ESCC | tRNA metabolic process | 122/8552 | 179/18723 | 9.03e-10 | 2.19e-08 | 122 |
| GO:00094512 | Esophagus | ESCC | RNA modification | 114/8552 | 167/18723 | 2.76e-09 | 6.04e-08 | 114 |
| GO:00064002 | Esophagus | ESCC | tRNA modification | 62/8552 | 90/18723 | 7.02e-06 | 7.04e-05 | 62 |
| GO:00344709 | Oral cavity | OSCC | ncRNA processing | 263/7305 | 395/18723 | 4.38e-29 | 2.78e-26 | 263 |
| GO:00346605 | Oral cavity | OSCC | ncRNA metabolic process | 296/7305 | 485/18723 | 2.94e-23 | 6.65e-21 | 296 |
| GO:00080332 | Oral cavity | OSCC | tRNA processing | 78/7305 | 127/18723 | 2.56e-07 | 4.00e-06 | 78 |
| GO:00063991 | Oral cavity | OSCC | tRNA metabolic process | 101/7305 | 179/18723 | 1.65e-06 | 2.15e-05 | 101 |
| GO:00094511 | Oral cavity | OSCC | RNA modification | 95/7305 | 167/18723 | 2.05e-06 | 2.62e-05 | 95 |
| GO:00064001 | Oral cavity | OSCC | tRNA modification | 53/7305 | 90/18723 | 1.04e-04 | 7.70e-04 | 53 |
| Page: 1 |
| Pathway ID | Tissue | Disease Stage | Description | Gene Ratio | Bg Ratio | pvalue | p.adjust | qvalue | Count |
| Page: 1 |
Top |
Cell-cell communication analysis |
| Identification of potential cell-cell interactions between two cell types and their ligand-receptor pairs for different disease states |
| Ligand | Receptor | LRpair | Pathway | Tissue | Disease Stage |
| Page: 1 |
Top |
Single-cell gene regulatory network inference analysis |
| Find out the significant the regulons (TFs) and the target genes of each regulon across cell types for different disease states |
| TF | Cell Type | Tissue | Disease Stage | Target Gene | RSS | Regulon Activity |
| ∗The dot plots of a searched regulon are shown for all cell subpopulations in each disease state of each tissue based on the regulon specific score inferred using pySCENIC and by calculating the average expression. |
| Page: 1 |
Top |
Somatic mutation of malignant transformation related genes |
| Annotation of somatic variants for genes involved in malignant transformation |
| Hugo Symbol | Variant Class | Variant Classification | dbSNP RS | HGVSc | HGVSp | HGVSp Short | SWISSPROT | BIOTYPE | SIFT | PolyPhen | Tumor Sample Barcode | Tissue | Histology | Sex | Age | Stage | Therapy Types | Drugs | Outcome |
| ELP3 | SNV | Missense_Mutation | c.673G>C | p.Asp225His | p.D225H | Q9H9T3 | protein_coding | deleterious(0) | probably_damaging(1) | TCGA-D8-A1J9-01 | Breast | breast invasive carcinoma | Female | <65 | I/II | Unknown | Unknown | SD | |
| ELP3 | SNV | Missense_Mutation | novel | c.391N>C | p.Glu131Gln | p.E131Q | Q9H9T3 | protein_coding | deleterious(0.02) | benign(0.364) | TCGA-DG-A2KM-01 | Cervix | cervical & endocervical cancer | Female | <65 | I/II | Chemotherapy | cisplatin | SD |
| ELP3 | SNV | Missense_Mutation | rs201078315 | c.1052G>A | p.Arg351Gln | p.R351Q | Q9H9T3 | protein_coding | tolerated(0.15) | benign(0.01) | TCGA-EA-A410-01 | Cervix | cervical & endocervical cancer | Female | <65 | I/II | Unknown | Unknown | SD |
| ELP3 | SNV | Missense_Mutation | novel | c.977N>A | p.Thr326Asn | p.T326N | Q9H9T3 | protein_coding | deleterious(0) | probably_damaging(0.967) | TCGA-AA-3875-01 | Colorectum | colon adenocarcinoma | Female | >=65 | I/II | Unknown | Unknown | SD |
| ELP3 | SNV | Missense_Mutation | c.380N>G | p.Tyr127Cys | p.Y127C | Q9H9T3 | protein_coding | deleterious(0) | probably_damaging(0.996) | TCGA-DM-A1HB-01 | Colorectum | colon adenocarcinoma | Male | >=65 | III/IV | Unknown | Unknown | SD | |
| ELP3 | SNV | Missense_Mutation | c.1601G>A | p.Gly534Asp | p.G534D | Q9H9T3 | protein_coding | deleterious(0) | probably_damaging(0.956) | TCGA-F4-6808-01 | Colorectum | colon adenocarcinoma | Female | <65 | I/II | Unknown | Unknown | SD | |
| ELP3 | SNV | Missense_Mutation | rs754899290 | c.109N>A | p.Asp37Asn | p.D37N | Q9H9T3 | protein_coding | tolerated(1) | benign(0) | TCGA-F5-6814-01 | Colorectum | rectum adenocarcinoma | Male | <65 | I/II | Unknown | Unknown | SD |
| ELP3 | deletion | Frame_Shift_Del | novel | c.721delN | p.Thr241GlnfsTer24 | p.T241Qfs*24 | Q9H9T3 | protein_coding | TCGA-AA-A02R-01 | Colorectum | colon adenocarcinoma | Female | >=65 | I/II | Unknown | Unknown | PD | ||
| ELP3 | insertion | Nonsense_Mutation | novel | c.1550_1551insTTAAAAAGG | p.Lys517delinsAsnTerLysGly | p.K517delinsN*KG | Q9H9T3 | protein_coding | TCGA-AM-5820-01 | Colorectum | colon adenocarcinoma | Female | <65 | I/II | Unknown | Unknown | SD | ||
| ELP3 | SNV | Missense_Mutation | rs754899290 | c.109G>A | p.Asp37Asn | p.D37N | Q9H9T3 | protein_coding | tolerated(1) | benign(0) | TCGA-A5-A0G2-01 | Endometrium | uterine corpus endometrioid carcinoma | Female | <65 | III/IV | Unknown | Unknown | SD |
| Page: 1 2 3 4 5 |
Top |
Related drugs of malignant transformation related genes |
| Identification of chemicals and drugs interact with genes involved in malignant transfromation |
| (DGIdb 4.0) |
| Entrez ID | Symbol | Category | Interaction Types | Drug Claim Name | Drug Name | PMIDs |
| Page: 1 |

Copyright 2023-Present -The University of Texas Health Science Center at Houston |