
|
|||||
|
 | |
| |
| |
| |
| |
| |
|
Gene: ELP2 |
Gene summary for ELP2 |
| Gene information | Species | Human | Gene symbol | ELP2 | Gene ID | 55250 |
| Gene name | elongator acetyltransferase complex subunit 2 | |
| Gene Alias | MRT58 | |
| Cytomap | 18q12.2 | |
| Gene Type | protein-coding | GO ID | GO:0002097 | UniProtAcc | Q6IA86 |
Top |
Malignant transformation analysis |
| Identification of the aberrant gene expression in precancerous and cancerous lesions by comparing the gene expression of stem-like cells in diseased tissues with normal stem cells |
| Entrez ID | Symbol | Replicates | Species | Organ | Tissue | Adj P-value | Log2FC | Malignancy |
| 55250 | ELP2 | GSM4909286 | Human | Breast | IDC | 1.94e-03 | 1.46e-01 | 0.1081 |
| 55250 | ELP2 | GSM4909296 | Human | Breast | IDC | 2.94e-03 | -1.40e-01 | 0.1524 |
| 55250 | ELP2 | GSM4909301 | Human | Breast | IDC | 3.96e-04 | 2.74e-01 | 0.1577 |
| 55250 | ELP2 | GSM4909307 | Human | Breast | IDC | 7.33e-03 | 2.50e-01 | 0.1569 |
| 55250 | ELP2 | GSM4909308 | Human | Breast | IDC | 2.82e-13 | 5.23e-01 | 0.158 |
| 55250 | ELP2 | GSM4909311 | Human | Breast | IDC | 1.83e-05 | -1.29e-01 | 0.1534 |
| 55250 | ELP2 | GSM4909313 | Human | Breast | IDC | 2.33e-04 | 3.69e-01 | 0.0391 |
| 55250 | ELP2 | GSM4909319 | Human | Breast | IDC | 2.23e-06 | -1.85e-01 | 0.1563 |
| 55250 | ELP2 | GSM4909320 | Human | Breast | IDC | 3.04e-02 | -1.09e-01 | 0.1575 |
| 55250 | ELP2 | GSM4909321 | Human | Breast | IDC | 8.74e-03 | 1.01e-01 | 0.1559 |
| 55250 | ELP2 | brca2 | Human | Breast | Precancer | 1.31e-03 | 1.62e-01 | -0.024 |
| 55250 | ELP2 | brca3 | Human | Breast | Precancer | 1.87e-05 | 1.84e-01 | -0.0263 |
| 55250 | ELP2 | M1 | Human | Breast | IDC | 7.82e-19 | 7.79e-01 | 0.1577 |
| 55250 | ELP2 | M5 | Human | Breast | IDC | 1.03e-05 | 7.58e-01 | 0.1598 |
| 55250 | ELP2 | P1 | Human | Breast | IDC | 1.25e-09 | 3.63e-01 | 0.1527 |
| 55250 | ELP2 | DCIS2 | Human | Breast | DCIS | 3.94e-49 | 1.68e-01 | 0.0085 |
| 55250 | ELP2 | LZE4T | Human | Esophagus | ESCC | 2.49e-09 | 8.16e-02 | 0.0811 |
| 55250 | ELP2 | LZE7T | Human | Esophagus | ESCC | 9.69e-13 | 5.45e-01 | 0.0667 |
| 55250 | ELP2 | LZE20T | Human | Esophagus | ESCC | 3.17e-06 | 9.17e-02 | 0.0662 |
| 55250 | ELP2 | LZE22D1 | Human | Esophagus | HGIN | 2.31e-02 | 2.27e-03 | 0.0595 |
| Page: 1 2 3 4 5 6 7 |
| Tissue | Expression Dynamics | Abbreviation |
| Breast | 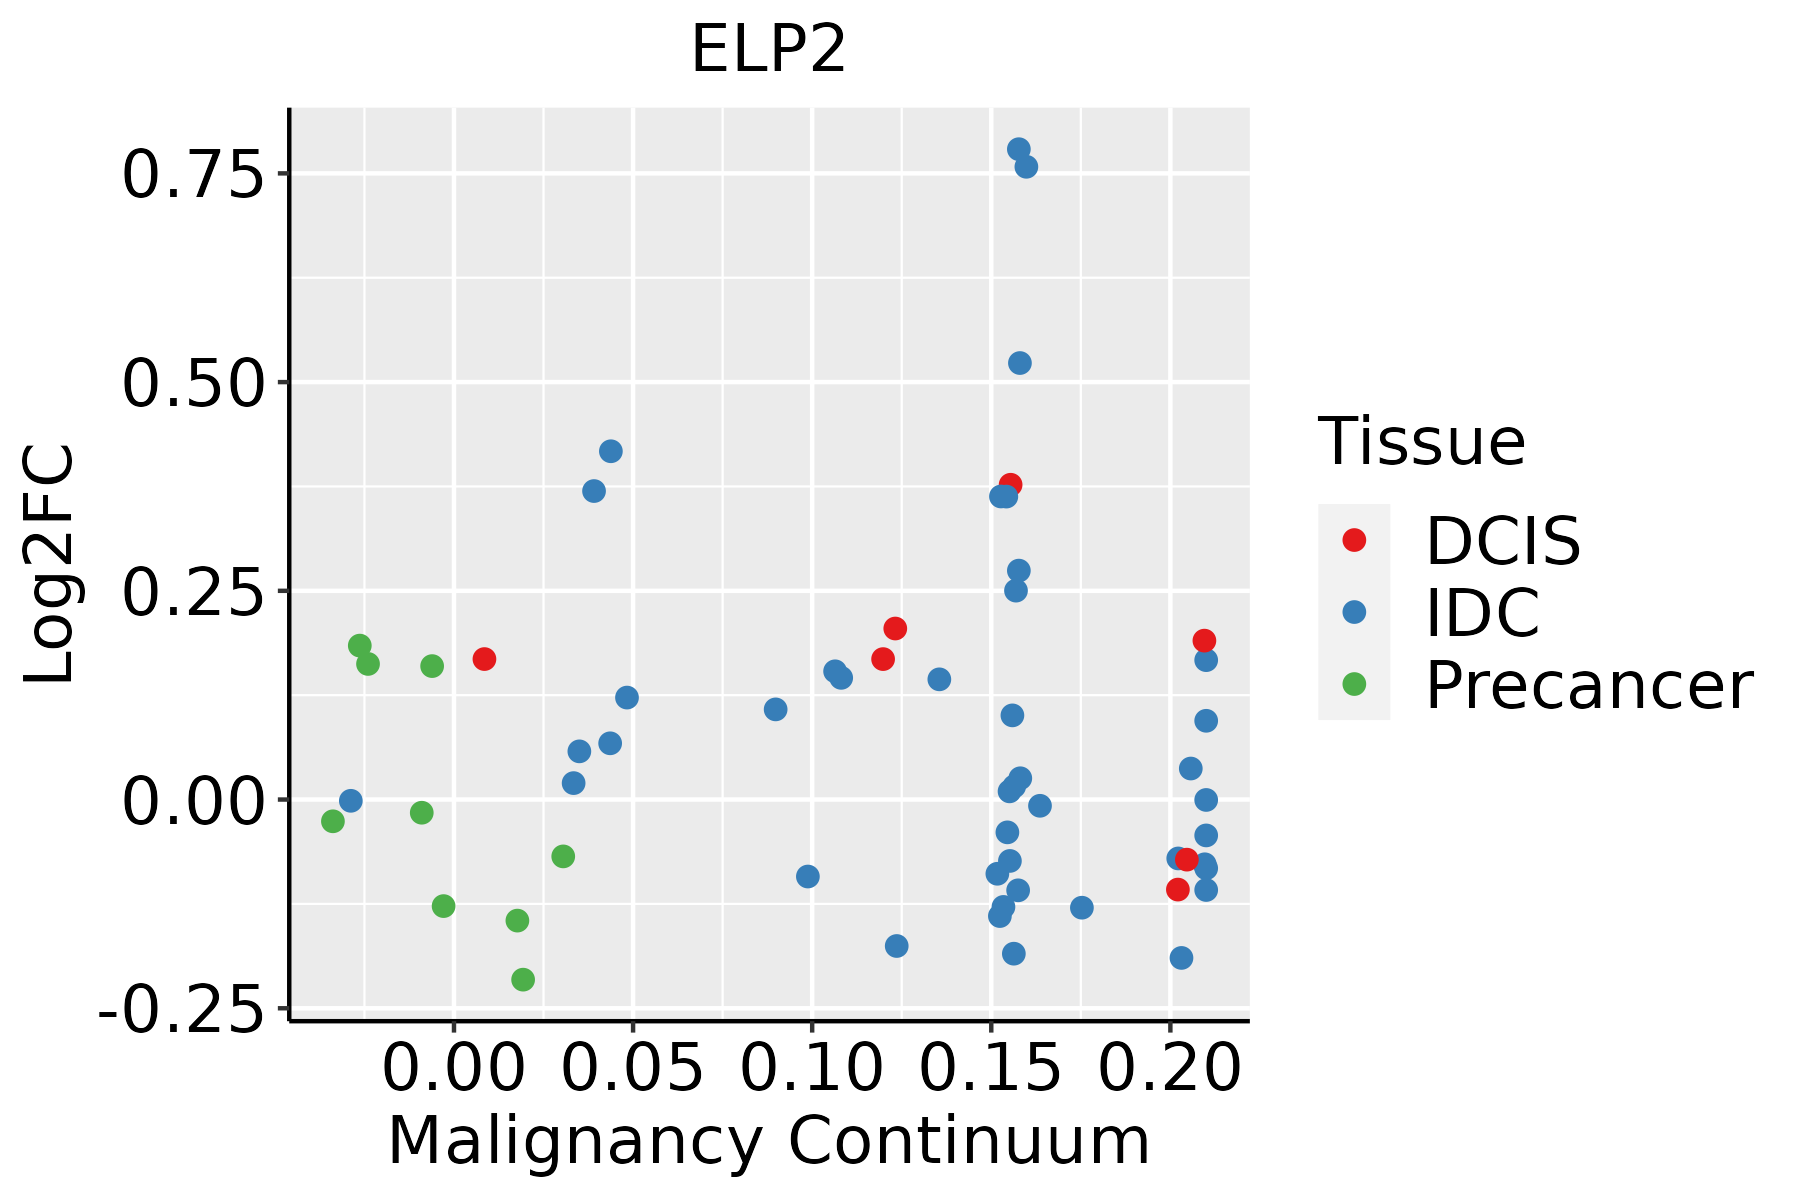 | IDC: Invasive ductal carcinoma |
| DCIS: Ductal carcinoma in situ | ||
| Precancer(BRCA1-mut): Precancerous lesion from BRCA1 mutation carriers | ||
| Esophagus | 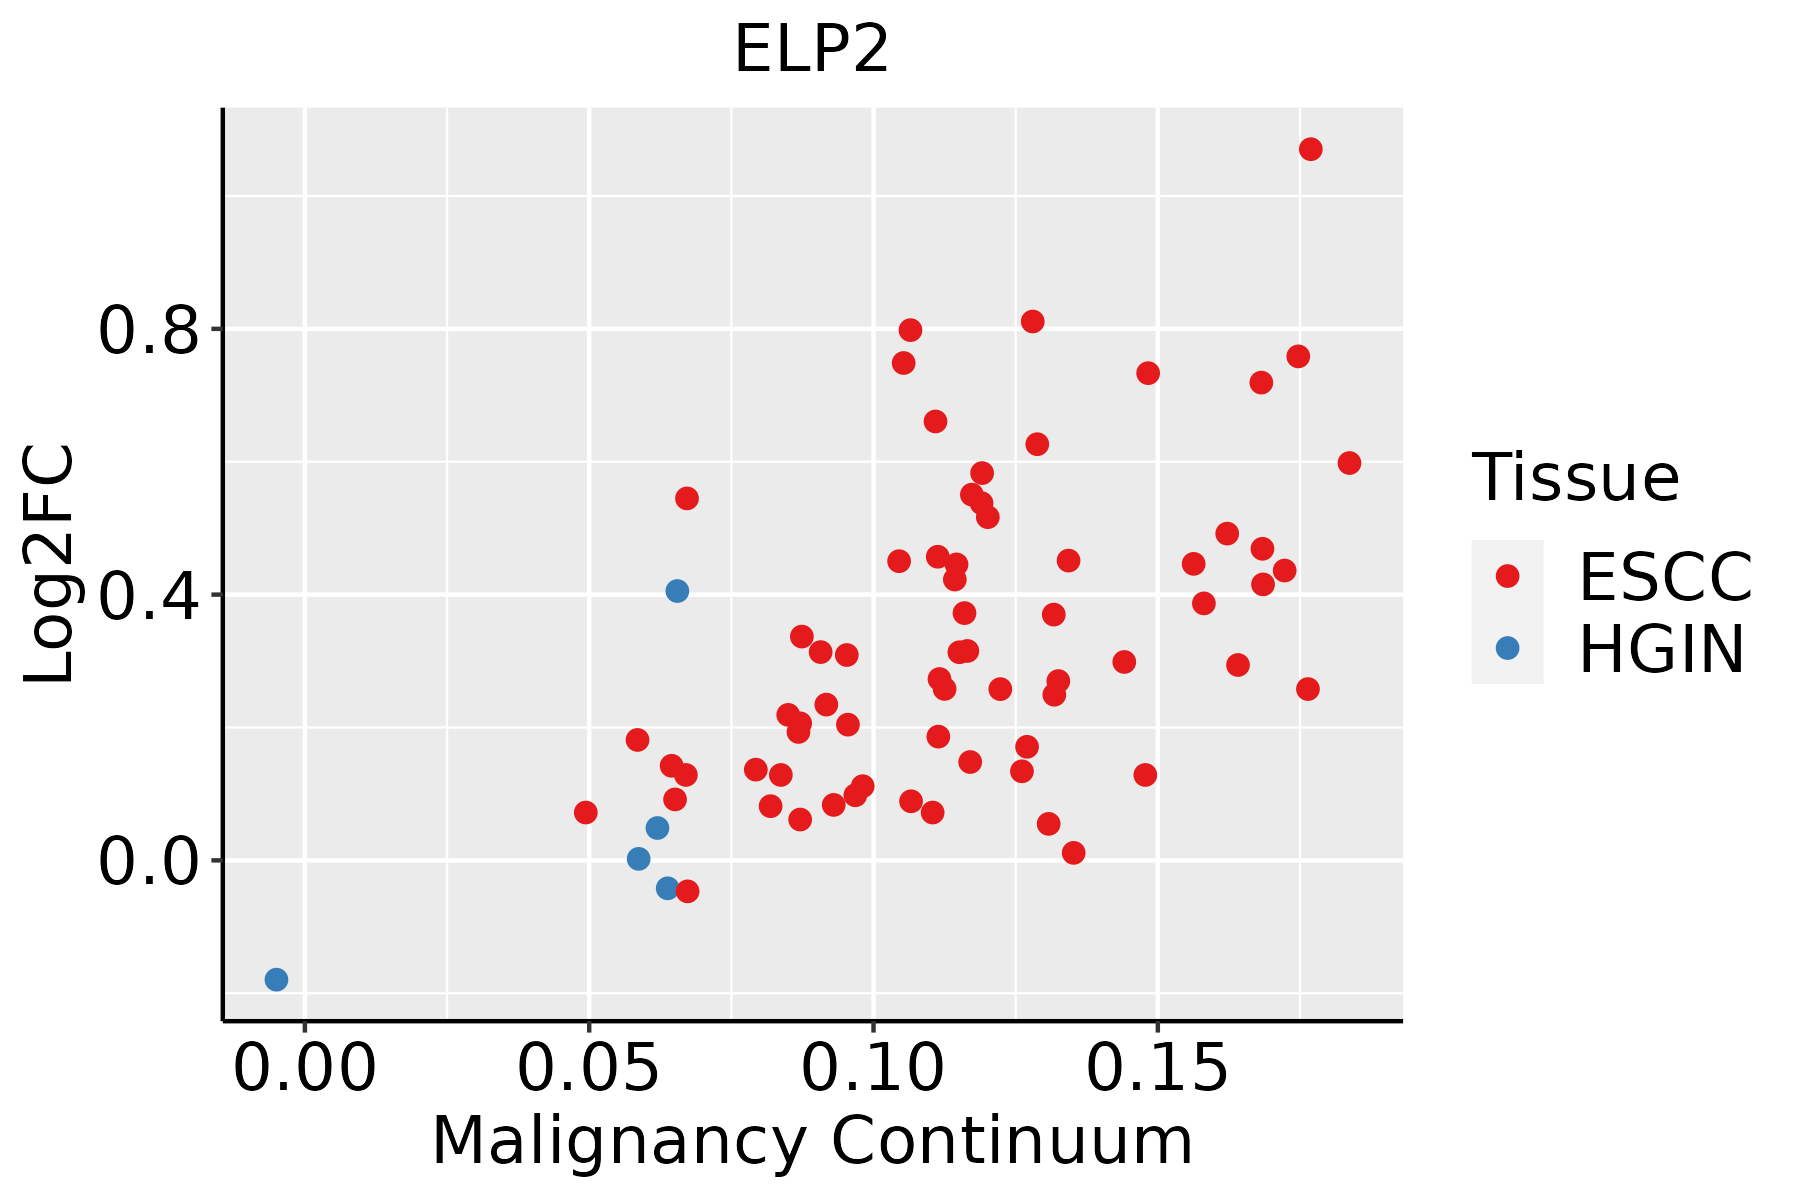 | ESCC: Esophageal squamous cell carcinoma |
| HGIN: High-grade intraepithelial neoplasias | ||
| LGIN: Low-grade intraepithelial neoplasias | ||
| Liver |  | HCC: Hepatocellular carcinoma |
| NAFLD: Non-alcoholic fatty liver disease | ||
| Oral Cavity | 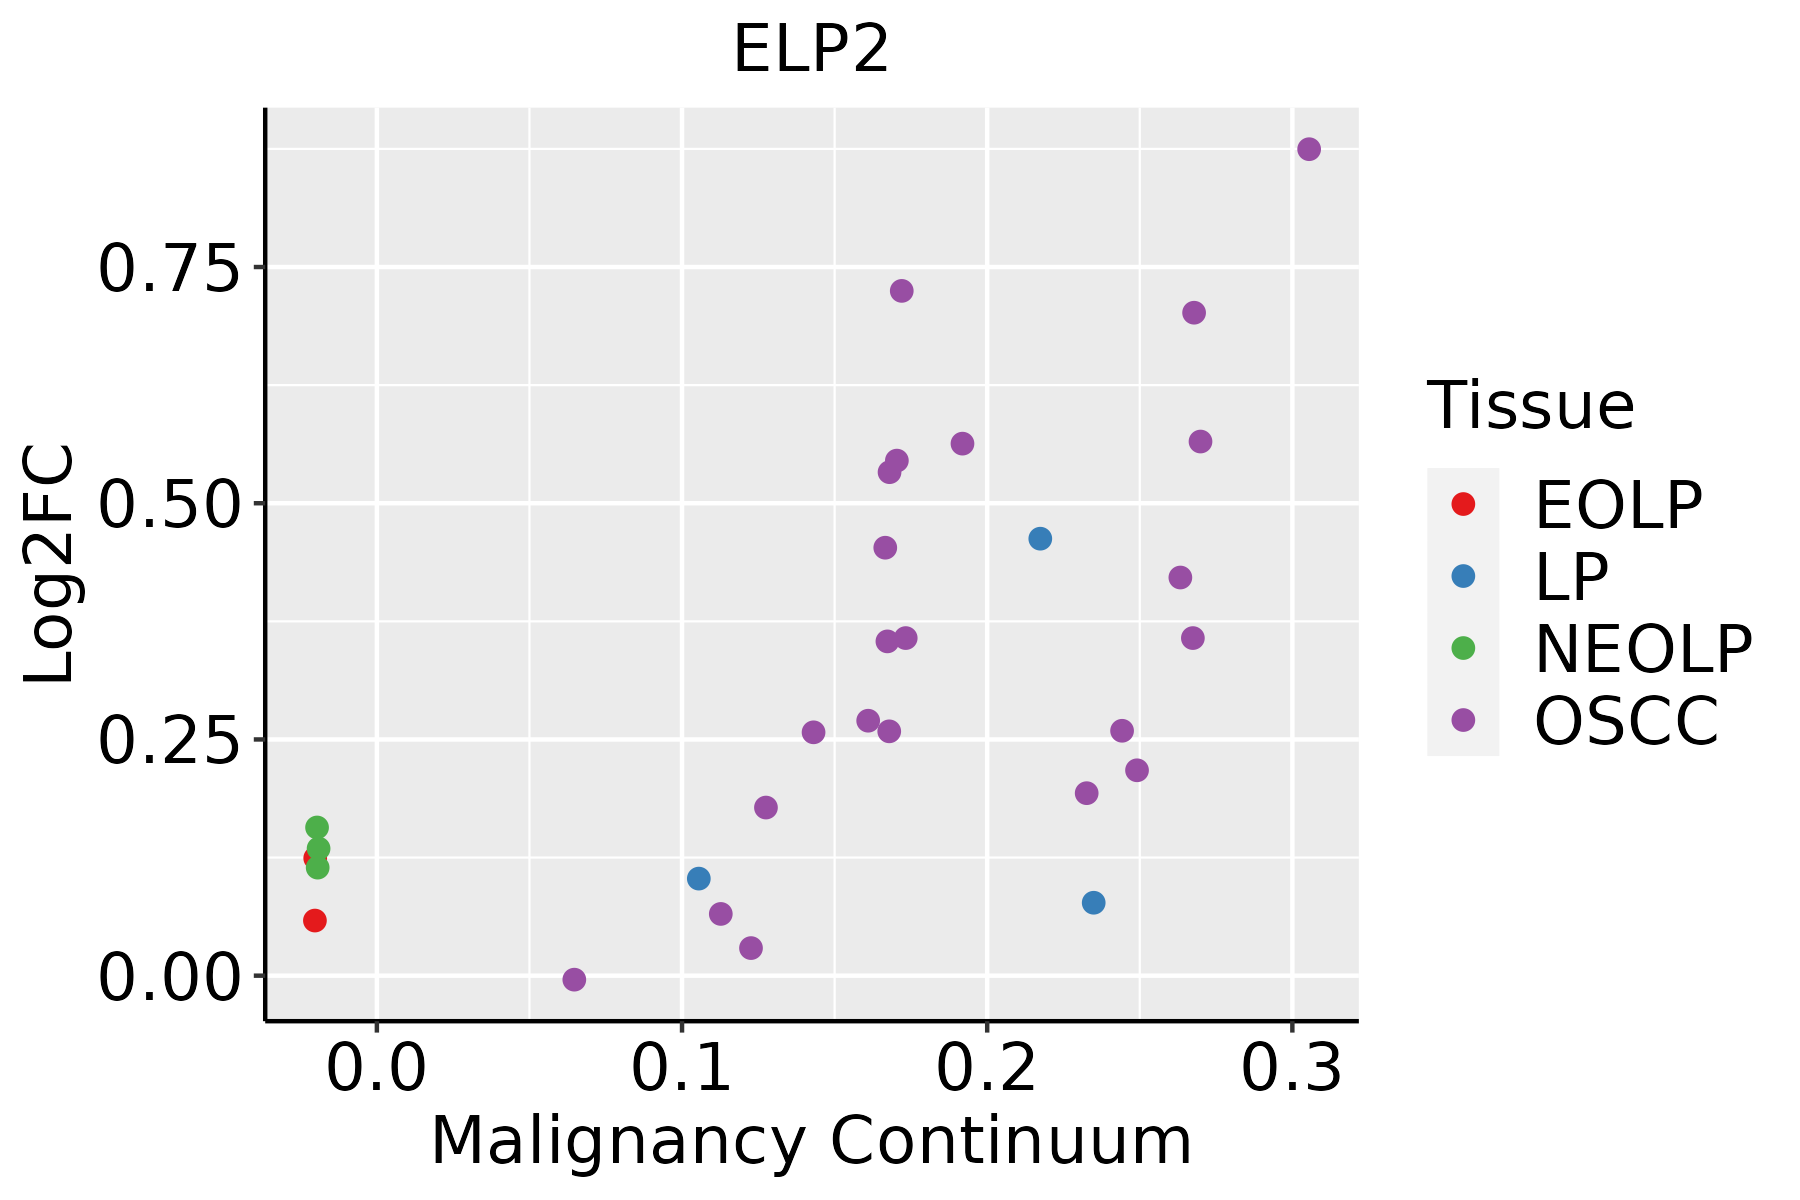 | EOLP: Erosive Oral lichen planus |
| LP: leukoplakia | ||
| NEOLP: Non-erosive oral lichen planus | ||
| OSCC: Oral squamous cell carcinoma | ||
| Skin | 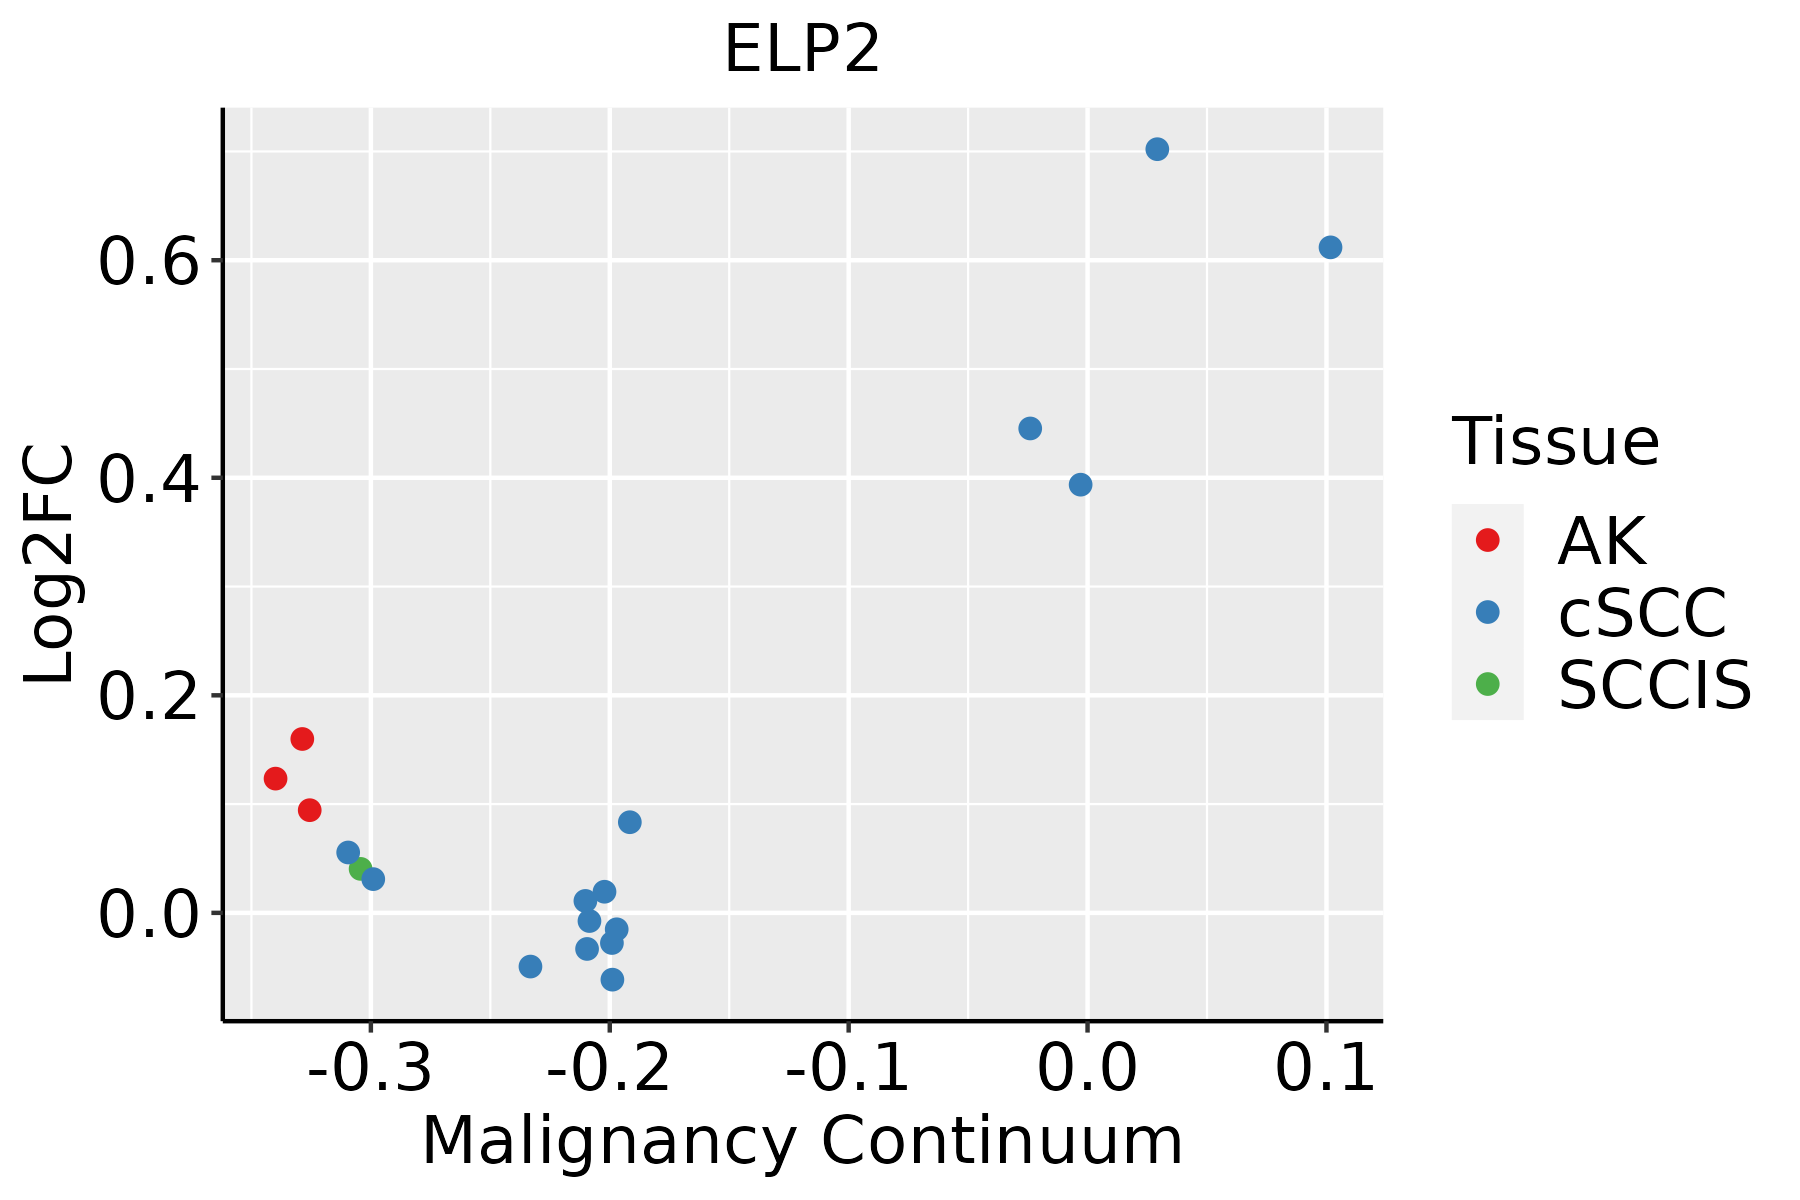 | AK: Actinic keratosis |
| cSCC: Cutaneous squamous cell carcinoma | ||
| SCCIS:squamous cell carcinoma in situ | ||
| Thyroid | 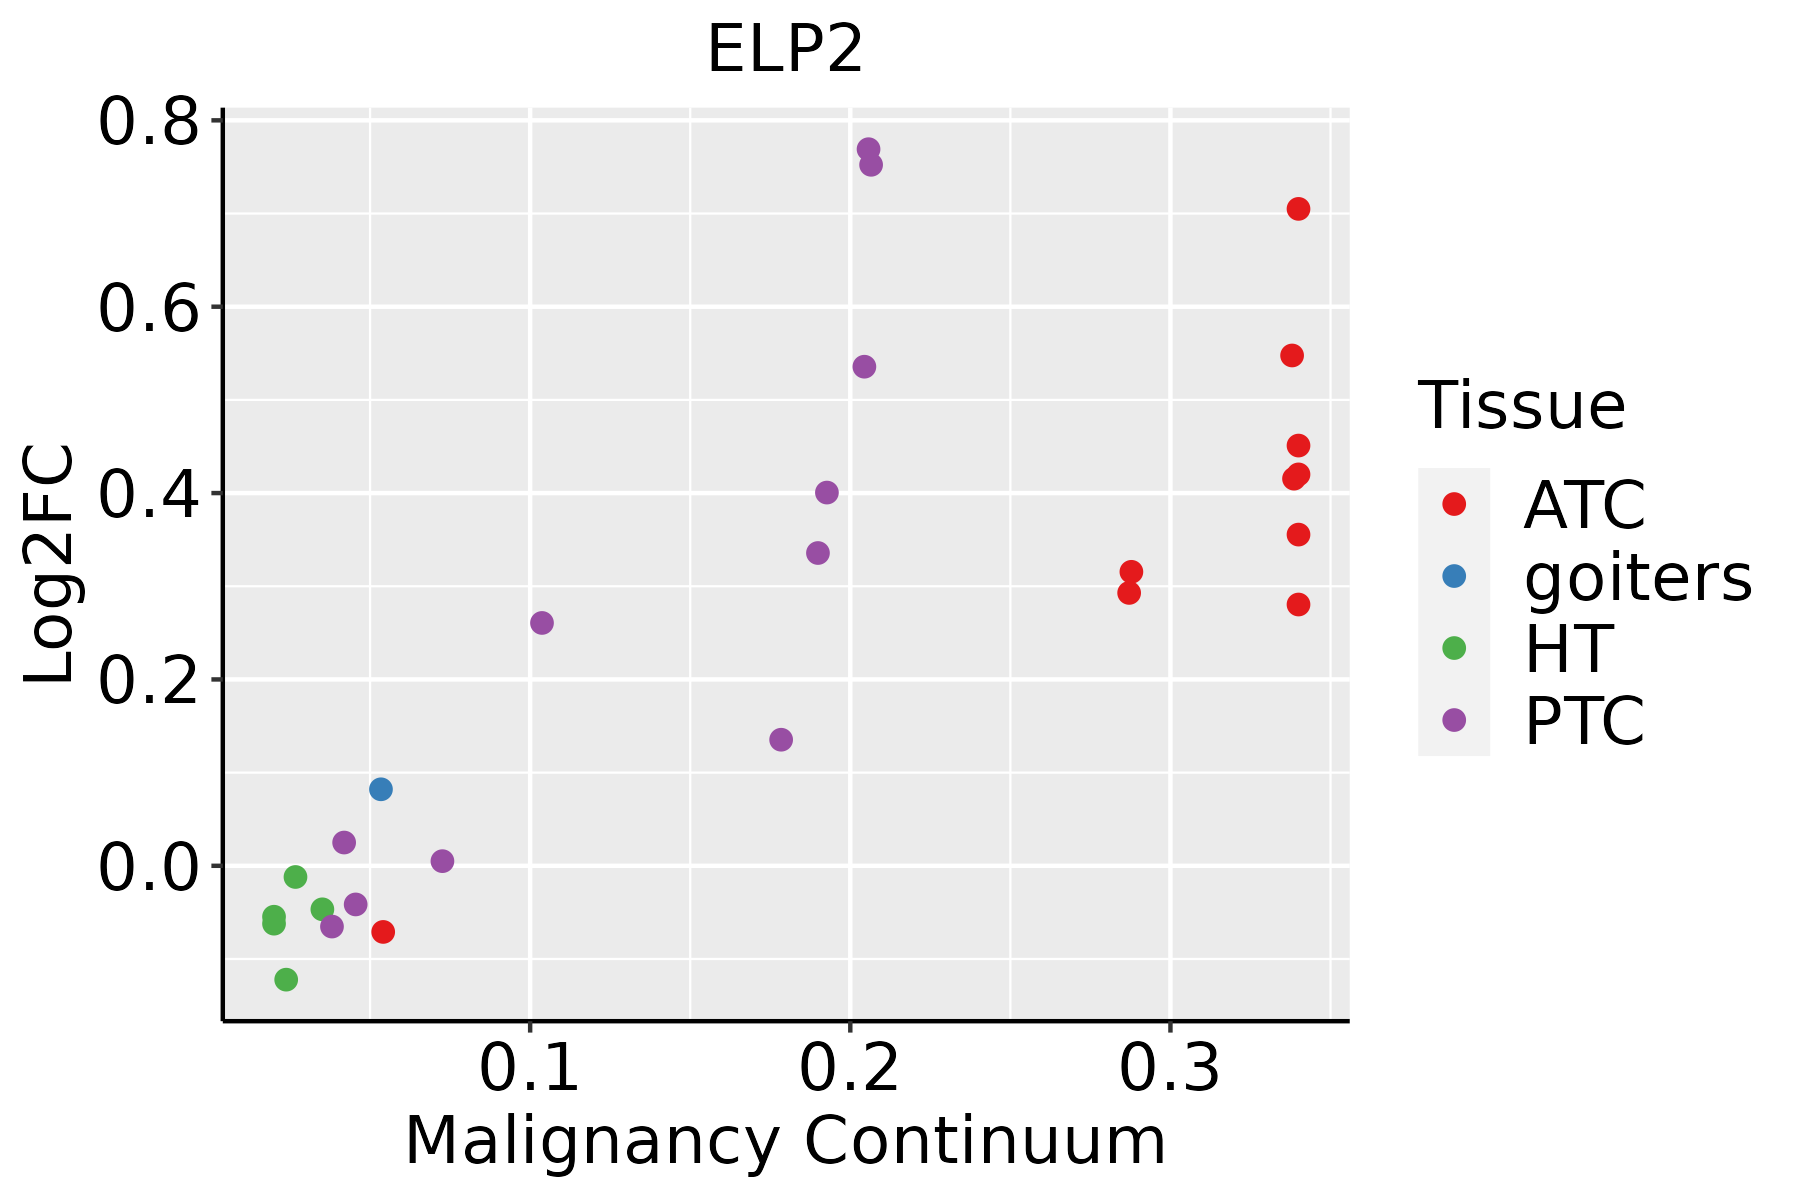 | ATC: Anaplastic thyroid cancer |
| HT: Hashimoto's thyroiditis | ||
| PTC: Papillary thyroid cancer |
| ∗log2FC in expression of this searched gene in stem-like cells from each diseased tissue sample relative to stem-like cells in normal samples in each tissue plotted against the malignancy continuum. Samples are colored based on if they are from different disease stage. |
Top |
Malignant transformation related pathway analysis |
| Find out the enriched GO biological processes and KEGG pathways involved in transition from healthy to precancer to cancer |
| Tissue | Disease Stage | Enriched GO biological Processes |
| Colorectum | AD |  |
| Colorectum | SER |  |
| Colorectum | MSS |  |
| Colorectum | MSI-H |  |
| Colorectum | FAP |  |
| ∗Top 15 enriched GO BP terms are showed in the bar plot of each disease state in each tissue. Each row represents a significant GO biological process which is colored according to the -log10(p.adjust). |
| Page: 1 2 3 4 5 6 7 8 9 |
| GO ID | Tissue | Disease Stage | Description | Gene Ratio | Bg Ratio | pvalue | p.adjust | Count |
| GO:00344705 | Breast | Precancer | ncRNA processing | 42/1080 | 395/18723 | 9.91e-05 | 1.83e-03 | 42 |
| GO:00346604 | Breast | Precancer | ncRNA metabolic process | 45/1080 | 485/18723 | 1.15e-03 | 1.26e-02 | 45 |
| GO:003447011 | Breast | DCIS | ncRNA processing | 44/1390 | 395/18723 | 4.56e-03 | 3.49e-02 | 44 |
| GO:003447010 | Esophagus | HGIN | ncRNA processing | 97/2587 | 395/18723 | 5.92e-09 | 3.90e-07 | 97 |
| GO:00346606 | Esophagus | HGIN | ncRNA metabolic process | 104/2587 | 485/18723 | 2.26e-06 | 8.23e-05 | 104 |
| GO:00063687 | Esophagus | HGIN | transcription elongation from RNA polymerase II promoter | 24/2587 | 69/18723 | 8.93e-06 | 2.64e-04 | 24 |
| GO:00063548 | Esophagus | HGIN | DNA-templated transcription, elongation | 27/2587 | 91/18723 | 6.62e-05 | 1.52e-03 | 27 |
| GO:003447015 | Esophagus | ESCC | ncRNA processing | 300/8552 | 395/18723 | 3.09e-35 | 3.26e-32 | 300 |
| GO:003466012 | Esophagus | ESCC | ncRNA metabolic process | 346/8552 | 485/18723 | 4.35e-31 | 2.51e-28 | 346 |
| GO:000635414 | Esophagus | ESCC | DNA-templated transcription, elongation | 76/8552 | 91/18723 | 8.35e-14 | 4.11e-12 | 76 |
| GO:00080333 | Esophagus | ESCC | tRNA processing | 92/8552 | 127/18723 | 7.83e-10 | 1.93e-08 | 92 |
| GO:00063992 | Esophagus | ESCC | tRNA metabolic process | 122/8552 | 179/18723 | 9.03e-10 | 2.19e-08 | 122 |
| GO:000636814 | Esophagus | ESCC | transcription elongation from RNA polymerase II promoter | 56/8552 | 69/18723 | 1.40e-09 | 3.30e-08 | 56 |
| GO:00094512 | Esophagus | ESCC | RNA modification | 114/8552 | 167/18723 | 2.76e-09 | 6.04e-08 | 114 |
| GO:00064002 | Esophagus | ESCC | tRNA modification | 62/8552 | 90/18723 | 7.02e-06 | 7.04e-05 | 62 |
| GO:00344704 | Liver | NAFLD | ncRNA processing | 57/1882 | 395/18723 | 3.34e-03 | 2.93e-02 | 57 |
| GO:00344701 | Liver | Cirrhotic | ncRNA processing | 158/4634 | 395/18723 | 1.09e-11 | 6.96e-10 | 158 |
| GO:00346603 | Liver | Cirrhotic | ncRNA metabolic process | 173/4634 | 485/18723 | 3.64e-08 | 1.21e-06 | 173 |
| GO:00063544 | Liver | Cirrhotic | DNA-templated transcription, elongation | 35/4634 | 91/18723 | 2.56e-03 | 1.53e-02 | 35 |
| GO:00063683 | Liver | Cirrhotic | transcription elongation from RNA polymerase II promoter | 28/4634 | 69/18723 | 2.70e-03 | 1.58e-02 | 28 |
| Page: 1 2 3 |
| Pathway ID | Tissue | Disease Stage | Description | Gene Ratio | Bg Ratio | pvalue | p.adjust | qvalue | Count |
| Page: 1 |
Top |
Cell-cell communication analysis |
| Identification of potential cell-cell interactions between two cell types and their ligand-receptor pairs for different disease states |
| Ligand | Receptor | LRpair | Pathway | Tissue | Disease Stage |
| Page: 1 |
Top |
Single-cell gene regulatory network inference analysis |
| Find out the significant the regulons (TFs) and the target genes of each regulon across cell types for different disease states |
| TF | Cell Type | Tissue | Disease Stage | Target Gene | RSS | Regulon Activity |
| ∗The dot plots of a searched regulon are shown for all cell subpopulations in each disease state of each tissue based on the regulon specific score inferred using pySCENIC and by calculating the average expression. |
| Page: 1 |
Top |
Somatic mutation of malignant transformation related genes |
| Annotation of somatic variants for genes involved in malignant transformation |
| Hugo Symbol | Variant Class | Variant Classification | dbSNP RS | HGVSc | HGVSp | HGVSp Short | SWISSPROT | BIOTYPE | SIFT | PolyPhen | Tumor Sample Barcode | Tissue | Histology | Sex | Age | Stage | Therapy Types | Drugs | Outcome |
| ELP2 | SNV | Missense_Mutation | c.1217C>G | p.Thr406Ser | p.T406S | Q6IA86 | protein_coding | tolerated(0.19) | possibly_damaging(0.729) | TCGA-A1-A0SO-01 | Breast | breast invasive carcinoma | Female | >=65 | I/II | Chemotherapy | SD | ||
| ELP2 | SNV | Missense_Mutation | novel | c.370C>T | p.Pro124Ser | p.P124S | Q6IA86 | protein_coding | tolerated(0.73) | benign(0.055) | TCGA-A2-A0ES-01 | Breast | breast invasive carcinoma | Female | <65 | I/II | Chemotherapy | docetaxel | SD |
| ELP2 | SNV | Missense_Mutation | c.55C>T | p.Arg19Trp | p.R19W | Q6IA86 | protein_coding | deleterious(0.02) | probably_damaging(0.952) | TCGA-AC-A23H-01 | Breast | breast invasive carcinoma | Female | >=65 | I/II | Unknown | Unknown | PD | |
| ELP2 | SNV | Missense_Mutation | novel | c.1715N>C | p.Lys572Thr | p.K572T | Q6IA86 | protein_coding | deleterious(0) | probably_damaging(0.994) | TCGA-AN-A046-01 | Breast | breast invasive carcinoma | Female | >=65 | I/II | Unknown | Unknown | SD |
| ELP2 | SNV | Missense_Mutation | c.752N>C | p.Arg251Thr | p.R251T | Q6IA86 | protein_coding | tolerated(0.06) | benign(0.103) | TCGA-C8-A130-01 | Breast | breast invasive carcinoma | Female | <65 | III/IV | Unknown | Unknown | SD | |
| ELP2 | SNV | Missense_Mutation | novel | c.1746N>T | p.Gln582His | p.Q582H | Q6IA86 | protein_coding | deleterious(0.03) | possibly_damaging(0.641) | TCGA-OL-A6VQ-01 | Breast | breast invasive carcinoma | Female | <65 | I/II | Unknown | Unknown | SD |
| ELP2 | SNV | Missense_Mutation | novel | c.2060T>C | p.Phe687Ser | p.F687S | Q6IA86 | protein_coding | deleterious(0) | probably_damaging(0.999) | TCGA-S3-AA12-01 | Breast | breast invasive carcinoma | Female | >=65 | III/IV | Hormone Therapy | anastrozole | SD |
| ELP2 | insertion | Nonsense_Mutation | novel | c.1174_1175insAAACGAGATATAACATACCTACAGTGAAGCATTCCTAGTAGTGTTTA | p.Val392GlufsTer13 | p.V392Efs*13 | Q6IA86 | protein_coding | TCGA-BH-A0B1-01 | Breast | breast invasive carcinoma | Female | >=65 | I/II | Chemotherapy | adriamycin | SD | ||
| ELP2 | SNV | Missense_Mutation | novel | c.827N>C | p.Arg276Thr | p.R276T | Q6IA86 | protein_coding | deleterious(0) | probably_damaging(0.988) | TCGA-HM-A4S6-01 | Cervix | cervical & endocervical cancer | Female | <65 | III/IV | Chemotherapy | cisplatin | CR |
| ELP2 | SNV | Missense_Mutation | c.1946C>T | p.Ser649Leu | p.S649L | Q6IA86 | protein_coding | deleterious(0.04) | possibly_damaging(0.496) | TCGA-JW-A5VL-01 | Cervix | cervical & endocervical cancer | Female | <65 | I/II | Unknown | Unknown | SD |
| Page: 1 2 3 4 5 6 7 |
Top |
Related drugs of malignant transformation related genes |
| Identification of chemicals and drugs interact with genes involved in malignant transfromation |
| (DGIdb 4.0) |
| Entrez ID | Symbol | Category | Interaction Types | Drug Claim Name | Drug Name | PMIDs |
| Page: 1 |

Copyright 2023-Present -The University of Texas Health Science Center at Houston |