
|
|||||
|
 | |
| |
| |
| |
| |
| |
|
Gene: ELOVL7 |
Gene summary for ELOVL7 |
| Gene information | Species | Human | Gene symbol | ELOVL7 | Gene ID | 79993 |
| Gene name | ELOVL fatty acid elongase 7 | |
| Gene Alias | ELOVL7 | |
| Cytomap | 5q12.1 | |
| Gene Type | protein-coding | GO ID | GO:0000038 | UniProtAcc | A1L3X0 |
Top |
Malignant transformation analysis |
| Identification of the aberrant gene expression in precancerous and cancerous lesions by comparing the gene expression of stem-like cells in diseased tissues with normal stem cells |
| Entrez ID | Symbol | Replicates | Species | Organ | Tissue | Adj P-value | Log2FC | Malignancy |
| 79993 | ELOVL7 | GSM5252132_BPH389PrGF | Human | Prostate | BPH | 3.99e-05 | 3.60e-01 | -0.2247 |
| 79993 | ELOVL7 | GSM5252134_BPH511PrG_Fcol_3GEX | Human | Prostate | BPH | 7.07e-04 | 2.10e-01 | -0.1433 |
| 79993 | ELOVL7 | GSM5252135_BPH511PrPUr_Fcol_3GEX | Human | Prostate | BPH | 1.53e-05 | 2.30e-01 | -0.1833 |
| 79993 | ELOVL7 | GSM5252136_BPH556PrGA1_Fcol | Human | Prostate | BPH | 4.79e-02 | 1.62e-01 | -0.23 |
| 79993 | ELOVL7 | 047563_1562-all-cells | Human | Prostate | BPH | 5.76e-03 | 2.98e-01 | 0.0791 |
| 79993 | ELOVL7 | 048752_1579-all-cells | Human | Prostate | BPH | 2.03e-30 | 5.85e-01 | 0.1008 |
| 79993 | ELOVL7 | 052095_1628-all-cells | Human | Prostate | BPH | 1.66e-07 | 2.60e-01 | 0.1032 |
| 79993 | ELOVL7 | 052097_1595-all-cells | Human | Prostate | BPH | 2.71e-21 | 4.18e-01 | 0.0972 |
| 79993 | ELOVL7 | 052099_1652-all-cells | Human | Prostate | BPH | 8.85e-25 | 5.21e-01 | 0.1038 |
| 79993 | ELOVL7 | Dong_P1 | Human | Prostate | Tumor | 1.92e-04 | 2.48e-02 | 0.035 |
| Page: 1 |
| Tissue | Expression Dynamics | Abbreviation |
| Prostate | 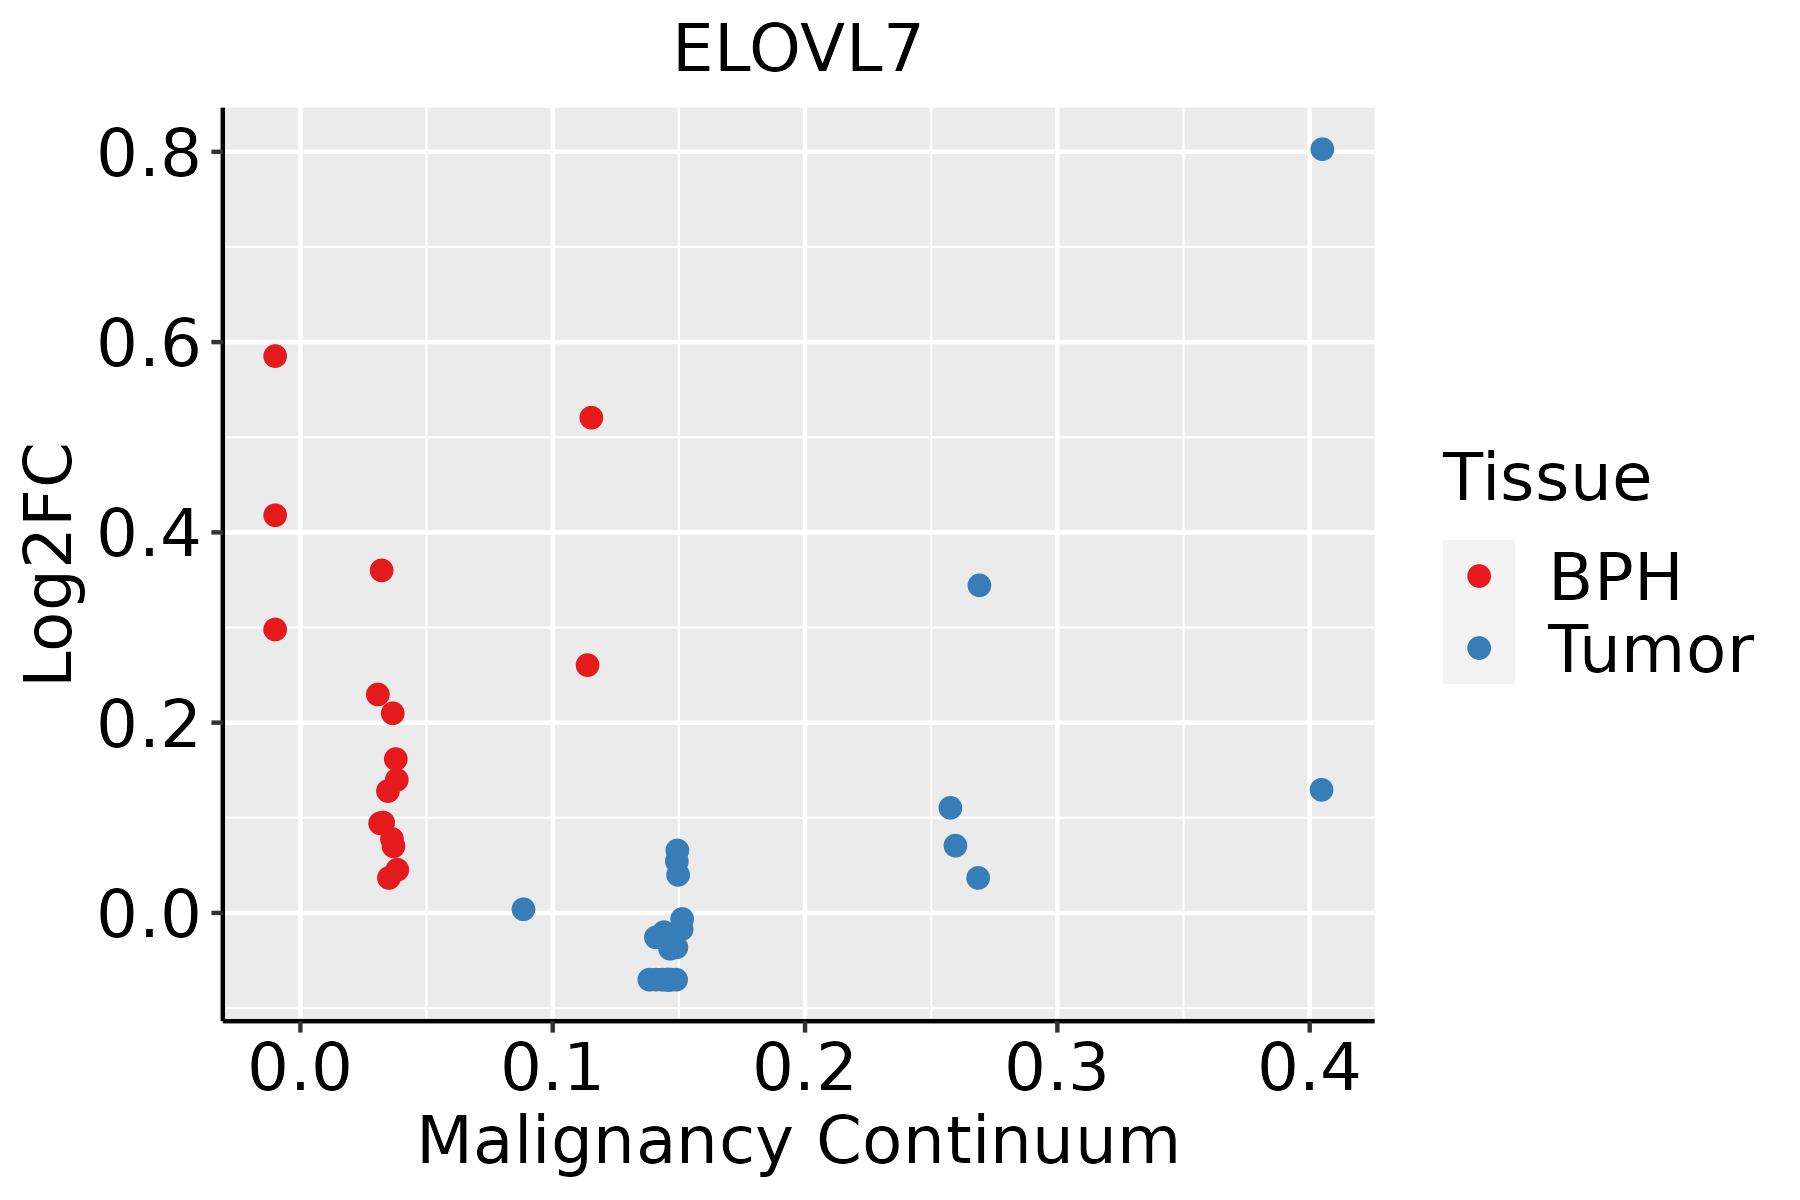 | BPH: Benign Prostatic Hyperplasia |
| ∗log2FC in expression of this searched gene in stem-like cells from each diseased tissue sample relative to stem-like cells in normal samples in each tissue plotted against the malignancy continuum. Samples are colored based on if they are from different disease stage. |
Top |
Malignant transformation related pathway analysis |
| Find out the enriched GO biological processes and KEGG pathways involved in transition from healthy to precancer to cancer |
| Tissue | Disease Stage | Enriched GO biological Processes |
| Colorectum | AD |  |
| Colorectum | SER |  |
| Colorectum | MSS |  |
| Colorectum | MSI-H |  |
| Colorectum | FAP |  |
| ∗Top 15 enriched GO BP terms are showed in the bar plot of each disease state in each tissue. Each row represents a significant GO biological process which is colored according to the -log10(p.adjust). |
| Page: 1 2 3 4 5 6 7 8 9 |
| GO ID | Tissue | Disease Stage | Description | Gene Ratio | Bg Ratio | pvalue | p.adjust | Count |
| GO:000915018 | Prostate | BPH | purine ribonucleotide metabolic process | 107/3107 | 368/18723 | 1.18e-09 | 5.19e-08 | 107 |
| GO:000925917 | Prostate | BPH | ribonucleotide metabolic process | 108/3107 | 385/18723 | 8.73e-09 | 2.97e-07 | 108 |
| GO:000616318 | Prostate | BPH | purine nucleotide metabolic process | 109/3107 | 396/18723 | 2.28e-08 | 6.94e-07 | 109 |
| GO:001969317 | Prostate | BPH | ribose phosphate metabolic process | 109/3107 | 396/18723 | 2.28e-08 | 6.94e-07 | 109 |
| GO:007252118 | Prostate | BPH | purine-containing compound metabolic process | 113/3107 | 416/18723 | 2.77e-08 | 8.13e-07 | 113 |
| GO:000915217 | Prostate | BPH | purine ribonucleotide biosynthetic process | 52/3107 | 169/18723 | 3.46e-06 | 5.42e-05 | 52 |
| GO:000911717 | Prostate | BPH | nucleotide metabolic process | 118/3107 | 489/18723 | 9.68e-06 | 1.35e-04 | 118 |
| GO:000926010 | Prostate | BPH | ribonucleotide biosynthetic process | 53/3107 | 182/18723 | 1.63e-05 | 2.05e-04 | 53 |
| GO:000675316 | Prostate | BPH | nucleoside phosphate metabolic process | 118/3107 | 497/18723 | 2.13e-05 | 2.58e-04 | 118 |
| GO:004639010 | Prostate | BPH | ribose phosphate biosynthetic process | 54/3107 | 190/18723 | 2.90e-05 | 3.34e-04 | 54 |
| GO:00725229 | Prostate | BPH | purine-containing compound biosynthetic process | 55/3107 | 200/18723 | 6.64e-05 | 6.59e-04 | 55 |
| GO:00061649 | Prostate | BPH | purine nucleotide biosynthetic process | 52/3107 | 191/18723 | 1.37e-04 | 1.22e-03 | 52 |
| GO:00353842 | Prostate | BPH | thioester biosynthetic process | 16/3107 | 45/18723 | 1.62e-03 | 9.39e-03 | 16 |
| GO:00716162 | Prostate | BPH | acyl-CoA biosynthetic process | 16/3107 | 45/18723 | 1.62e-03 | 9.39e-03 | 16 |
| GO:00091657 | Prostate | BPH | nucleotide biosynthetic process | 60/3107 | 254/18723 | 2.34e-03 | 1.28e-02 | 60 |
| GO:19012937 | Prostate | BPH | nucleoside phosphate biosynthetic process | 60/3107 | 256/18723 | 2.83e-03 | 1.49e-02 | 60 |
| GO:00469492 | Prostate | BPH | fatty-acyl-CoA biosynthetic process | 10/3107 | 25/18723 | 4.57e-03 | 2.19e-02 | 10 |
| GO:00442723 | Prostate | BPH | sulfur compound biosynthetic process | 37/3107 | 148/18723 | 5.70e-03 | 2.65e-02 | 37 |
| GO:000915019 | Prostate | Tumor | purine ribonucleotide metabolic process | 109/3246 | 368/18723 | 3.30e-09 | 1.36e-07 | 109 |
| GO:000925918 | Prostate | Tumor | ribonucleotide metabolic process | 110/3246 | 385/18723 | 2.45e-08 | 8.29e-07 | 110 |
| Page: 1 2 3 |
| Pathway ID | Tissue | Disease Stage | Description | Gene Ratio | Bg Ratio | pvalue | p.adjust | qvalue | Count |
| hsa012127 | Prostate | BPH | Fatty acid metabolism | 19/1718 | 57/8465 | 1.44e-02 | 4.17e-02 | 2.58e-02 | 19 |
| hsa0121212 | Prostate | BPH | Fatty acid metabolism | 19/1718 | 57/8465 | 1.44e-02 | 4.17e-02 | 2.58e-02 | 19 |
| hsa0121221 | Prostate | Tumor | Fatty acid metabolism | 23/1791 | 57/8465 | 7.60e-04 | 3.59e-03 | 2.23e-03 | 23 |
| hsa0121231 | Prostate | Tumor | Fatty acid metabolism | 23/1791 | 57/8465 | 7.60e-04 | 3.59e-03 | 2.23e-03 | 23 |
| Page: 1 |
Top |
Cell-cell communication analysis |
| Identification of potential cell-cell interactions between two cell types and their ligand-receptor pairs for different disease states |
| Ligand | Receptor | LRpair | Pathway | Tissue | Disease Stage |
| Page: 1 |
Top |
Single-cell gene regulatory network inference analysis |
| Find out the significant the regulons (TFs) and the target genes of each regulon across cell types for different disease states |
| TF | Cell Type | Tissue | Disease Stage | Target Gene | RSS | Regulon Activity |
| ∗The dot plots of a searched regulon are shown for all cell subpopulations in each disease state of each tissue based on the regulon specific score inferred using pySCENIC and by calculating the average expression. |
| Page: 1 |
Top |
Somatic mutation of malignant transformation related genes |
| Annotation of somatic variants for genes involved in malignant transformation |
| Hugo Symbol | Variant Class | Variant Classification | dbSNP RS | HGVSc | HGVSp | HGVSp Short | SWISSPROT | BIOTYPE | SIFT | PolyPhen | Tumor Sample Barcode | Tissue | Histology | Sex | Age | Stage | Therapy Types | Drugs | Outcome |
| ELOVL7 | deletion | Frame_Shift_Del | novel | c.530delN | p.Asn177IlefsTer6 | p.N177Ifs*6 | A1L3X0 | protein_coding | TCGA-D8-A27V-01 | Breast | breast invasive carcinoma | Female | <65 | I/II | Hormone Therapy | tamoxiphen | SD | ||
| ELOVL7 | deletion | Frame_Shift_Del | novel | c.4delN | p.Ala2ProfsTer40 | p.A2Pfs*40 | A1L3X0 | protein_coding | TCGA-D8-A27V-01 | Breast | breast invasive carcinoma | Female | <65 | I/II | Hormone Therapy | tamoxiphen | SD | ||
| ELOVL7 | SNV | Missense_Mutation | novel | c.683N>C | p.Met228Thr | p.M228T | A1L3X0 | protein_coding | tolerated(0.15) | possibly_damaging(0.493) | TCGA-A6-2672-01 | Colorectum | colon adenocarcinoma | Female | >=65 | III/IV | Unknown | Unknown | SD |
| ELOVL7 | SNV | Missense_Mutation | novel | c.722N>C | p.Ile241Thr | p.I241T | A1L3X0 | protein_coding | deleterious(0.02) | benign(0.297) | TCGA-AA-A00N-01 | Colorectum | colon adenocarcinoma | Male | >=65 | I/II | Unknown | Unknown | PD |
| ELOVL7 | SNV | Missense_Mutation | c.251A>G | p.Tyr84Cys | p.Y84C | A1L3X0 | protein_coding | deleterious(0.01) | probably_damaging(0.994) | TCGA-CK-5916-01 | Colorectum | colon adenocarcinoma | Female | >=65 | I/II | Unknown | Unknown | PD | |
| ELOVL7 | insertion | In_Frame_Ins | novel | c.398_399insAGAAAAATA | p.Phe133delinsLeuGluLysTyr | p.F133delinsLEKY | A1L3X0 | protein_coding | TCGA-AM-5820-01 | Colorectum | colon adenocarcinoma | Female | <65 | I/II | Unknown | Unknown | SD | ||
| ELOVL7 | SNV | Missense_Mutation | rs769098257 | c.175N>T | p.Arg59Cys | p.R59C | A1L3X0 | protein_coding | deleterious(0) | probably_damaging(0.997) | TCGA-A5-A0G2-01 | Endometrium | uterine corpus endometrioid carcinoma | Female | <65 | III/IV | Unknown | Unknown | SD |
| ELOVL7 | SNV | Missense_Mutation | rs199955250 | c.209N>T | p.Thr70Met | p.T70M | A1L3X0 | protein_coding | tolerated(0.08) | benign(0.069) | TCGA-AX-A0J1-01 | Endometrium | uterine corpus endometrioid carcinoma | Female | >=65 | I/II | Unknown | Unknown | SD |
| ELOVL7 | SNV | Missense_Mutation | rs748522826 | c.79G>T | p.Asp27Tyr | p.D27Y | A1L3X0 | protein_coding | deleterious(0) | possibly_damaging(0.498) | TCGA-AX-A2HC-01 | Endometrium | uterine corpus endometrioid carcinoma | Female | <65 | III/IV | Chemotherapy | paclitaxel | PD |
| ELOVL7 | SNV | Missense_Mutation | rs866345231 | c.463C>T | p.Pro155Ser | p.P155S | A1L3X0 | protein_coding | deleterious(0) | probably_damaging(0.994) | TCGA-AX-A2HD-01 | Endometrium | uterine corpus endometrioid carcinoma | Female | >=65 | III/IV | Unknown | Unknown | SD |
| Page: 1 2 3 4 |
Top |
Related drugs of malignant transformation related genes |
| Identification of chemicals and drugs interact with genes involved in malignant transfromation |
| (DGIdb 4.0) |
| Entrez ID | Symbol | Category | Interaction Types | Drug Claim Name | Drug Name | PMIDs |
| Page: 1 |

Copyright 2023-Present -The University of Texas Health Science Center at Houston |