
|
|||||
|
 | |
| |
| |
| |
| |
| |
|
Gene: ELOVL6 |
Gene summary for ELOVL6 |
| Gene information | Species | Human | Gene symbol | ELOVL6 | Gene ID | 79071 |
| Gene name | ELOVL fatty acid elongase 6 | |
| Gene Alias | FACE | |
| Cytomap | 4q25 | |
| Gene Type | protein-coding | GO ID | GO:0000038 | UniProtAcc | A0A024RDK5 |
Top |
Malignant transformation analysis |
| Identification of the aberrant gene expression in precancerous and cancerous lesions by comparing the gene expression of stem-like cells in diseased tissues with normal stem cells |
| Entrez ID | Symbol | Replicates | Species | Organ | Tissue | Adj P-value | Log2FC | Malignancy |
| 79071 | ELOVL6 | HTA11_3410_2000001011 | Human | Colorectum | AD | 1.79e-08 | -4.03e-01 | 0.0155 |
| 79071 | ELOVL6 | HTA11_866_3004761011 | Human | Colorectum | AD | 1.21e-02 | -3.64e-01 | 0.096 |
| 79071 | ELOVL6 | HTA11_10711_2000001011 | Human | Colorectum | AD | 4.08e-02 | -3.86e-01 | 0.0338 |
| 79071 | ELOVL6 | HTA11_7696_3000711011 | Human | Colorectum | AD | 1.24e-07 | -4.12e-01 | 0.0674 |
| 79071 | ELOVL6 | HTA11_99999973899_84307 | Human | Colorectum | MSS | 1.87e-05 | -5.77e-01 | 0.2585 |
| 79071 | ELOVL6 | HTA11_99999974143_84620 | Human | Colorectum | MSS | 3.90e-20 | -5.42e-01 | 0.3005 |
| 79071 | ELOVL6 | F007 | Human | Colorectum | FAP | 4.30e-07 | -4.79e-01 | 0.1176 |
| 79071 | ELOVL6 | A002-C-010 | Human | Colorectum | FAP | 1.32e-09 | -3.54e-01 | 0.242 |
| 79071 | ELOVL6 | A001-C-207 | Human | Colorectum | FAP | 4.76e-10 | -4.75e-01 | 0.1278 |
| 79071 | ELOVL6 | A015-C-203 | Human | Colorectum | FAP | 2.34e-23 | -5.03e-01 | -0.1294 |
| 79071 | ELOVL6 | A015-C-204 | Human | Colorectum | FAP | 1.44e-14 | -5.47e-01 | -0.0228 |
| 79071 | ELOVL6 | A014-C-040 | Human | Colorectum | FAP | 1.89e-05 | -5.84e-01 | -0.1184 |
| 79071 | ELOVL6 | A002-C-201 | Human | Colorectum | FAP | 1.63e-19 | -5.13e-01 | 0.0324 |
| 79071 | ELOVL6 | A002-C-203 | Human | Colorectum | FAP | 3.09e-05 | -3.48e-01 | 0.2786 |
| 79071 | ELOVL6 | A001-C-119 | Human | Colorectum | FAP | 1.04e-11 | -5.58e-01 | -0.1557 |
| 79071 | ELOVL6 | A001-C-108 | Human | Colorectum | FAP | 1.96e-18 | -4.58e-01 | -0.0272 |
| 79071 | ELOVL6 | A002-C-205 | Human | Colorectum | FAP | 1.78e-21 | -5.45e-01 | -0.1236 |
| 79071 | ELOVL6 | A014-C-108 | Human | Colorectum | FAP | 2.49e-04 | -4.20e-01 | -0.124 |
| 79071 | ELOVL6 | A001-C-104 | Human | Colorectum | FAP | 4.89e-10 | -4.14e-01 | 0.0184 |
| 79071 | ELOVL6 | A015-C-005 | Human | Colorectum | FAP | 2.11e-05 | -3.63e-01 | -0.0336 |
| Page: 1 2 3 |
| Tissue | Expression Dynamics | Abbreviation |
| Colorectum (GSE201348) |  | FAP: Familial adenomatous polyposis |
| CRC: Colorectal cancer | ||
| Colorectum (HTA11) |  | AD: Adenomas |
| SER: Sessile serrated lesions | ||
| MSI-H: Microsatellite-high colorectal cancer | ||
| MSS: Microsatellite stable colorectal cancer | ||
| Liver |  | HCC: Hepatocellular carcinoma |
| NAFLD: Non-alcoholic fatty liver disease | ||
| Oral Cavity | 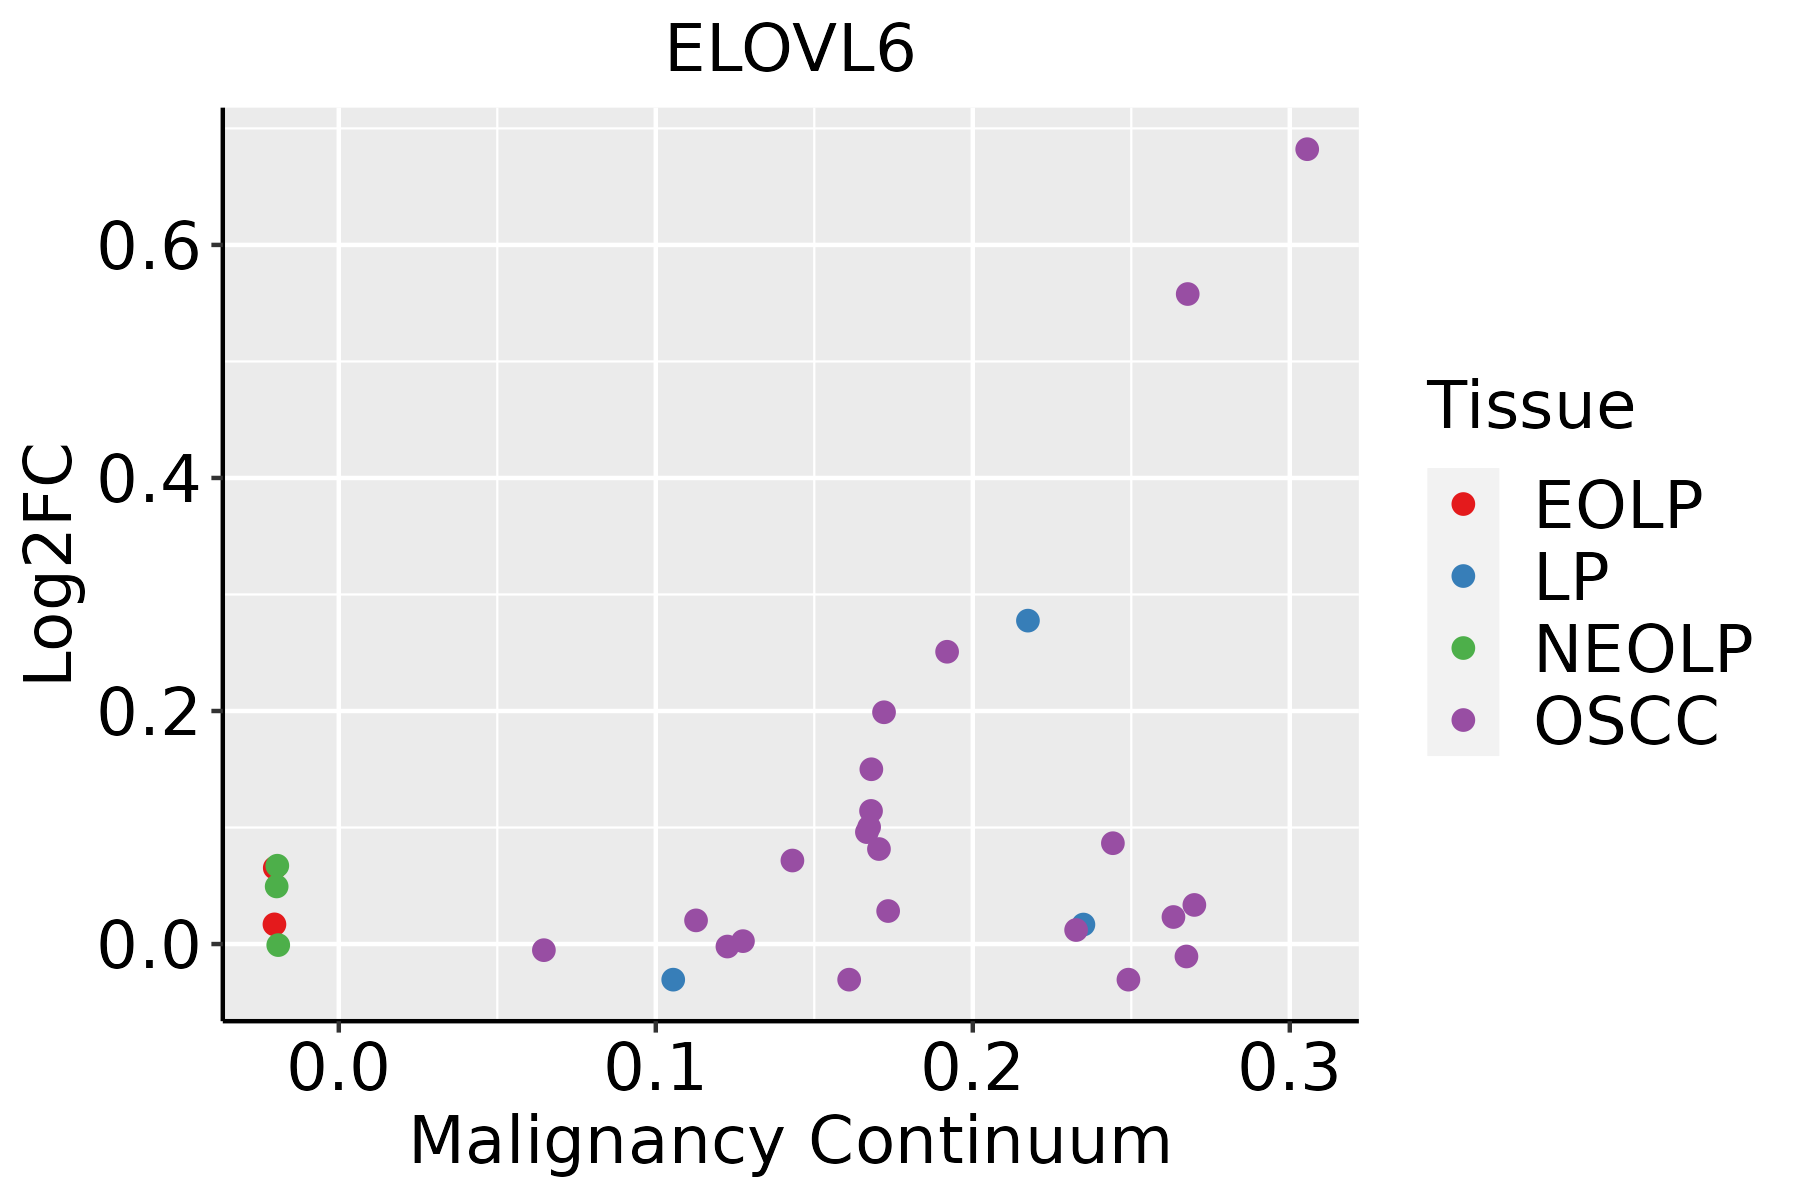 | EOLP: Erosive Oral lichen planus |
| LP: leukoplakia | ||
| NEOLP: Non-erosive oral lichen planus | ||
| OSCC: Oral squamous cell carcinoma |
| ∗log2FC in expression of this searched gene in stem-like cells from each diseased tissue sample relative to stem-like cells in normal samples in each tissue plotted against the malignancy continuum. Samples are colored based on if they are from different disease stage. |
Top |
Malignant transformation related pathway analysis |
| Find out the enriched GO biological processes and KEGG pathways involved in transition from healthy to precancer to cancer |
| Tissue | Disease Stage | Enriched GO biological Processes |
| Colorectum | AD |  |
| Colorectum | SER |  |
| Colorectum | MSS |  |
| Colorectum | MSI-H |  |
| Colorectum | FAP |  |
| ∗Top 15 enriched GO BP terms are showed in the bar plot of each disease state in each tissue. Each row represents a significant GO biological process which is colored according to the -log10(p.adjust). |
| Page: 1 2 3 4 5 6 7 8 9 |
| GO ID | Tissue | Disease Stage | Description | Gene Ratio | Bg Ratio | pvalue | p.adjust | Count |
| GO:0009150 | Colorectum | AD | purine ribonucleotide metabolic process | 142/3918 | 368/18723 | 4.29e-15 | 1.17e-12 | 142 |
| GO:0006163 | Colorectum | AD | purine nucleotide metabolic process | 149/3918 | 396/18723 | 1.08e-14 | 2.80e-12 | 149 |
| GO:0072521 | Colorectum | AD | purine-containing compound metabolic process | 153/3918 | 416/18723 | 4.34e-14 | 1.01e-11 | 153 |
| GO:0009259 | Colorectum | AD | ribonucleotide metabolic process | 144/3918 | 385/18723 | 5.25e-14 | 1.13e-11 | 144 |
| GO:0019693 | Colorectum | AD | ribose phosphate metabolic process | 145/3918 | 396/18723 | 3.01e-13 | 5.71e-11 | 145 |
| GO:0009117 | Colorectum | AD | nucleotide metabolic process | 168/3918 | 489/18723 | 2.20e-12 | 3.36e-10 | 168 |
| GO:0006753 | Colorectum | AD | nucleoside phosphate metabolic process | 169/3918 | 497/18723 | 4.99e-12 | 6.98e-10 | 169 |
| GO:0009152 | Colorectum | AD | purine ribonucleotide biosynthetic process | 64/3918 | 169/18723 | 3.09e-07 | 1.22e-05 | 64 |
| GO:0009260 | Colorectum | AD | ribonucleotide biosynthetic process | 66/3918 | 182/18723 | 1.25e-06 | 4.02e-05 | 66 |
| GO:0046390 | Colorectum | AD | ribose phosphate biosynthetic process | 67/3918 | 190/18723 | 3.21e-06 | 9.05e-05 | 67 |
| GO:0006164 | Colorectum | AD | purine nucleotide biosynthetic process | 66/3918 | 191/18723 | 8.22e-06 | 1.97e-04 | 66 |
| GO:0072522 | Colorectum | AD | purine-containing compound biosynthetic process | 68/3918 | 200/18723 | 1.12e-05 | 2.55e-04 | 68 |
| GO:0006631 | Colorectum | AD | fatty acid metabolic process | 114/3918 | 390/18723 | 5.58e-05 | 9.44e-04 | 114 |
| GO:1901293 | Colorectum | AD | nucleoside phosphate biosynthetic process | 80/3918 | 256/18723 | 6.31e-05 | 1.05e-03 | 80 |
| GO:0006790 | Colorectum | AD | sulfur compound metabolic process | 101/3918 | 339/18723 | 6.46e-05 | 1.07e-03 | 101 |
| GO:0009165 | Colorectum | AD | nucleotide biosynthetic process | 79/3918 | 254/18723 | 8.33e-05 | 1.30e-03 | 79 |
| GO:0033865 | Colorectum | AD | nucleoside bisphosphate metabolic process | 42/3918 | 128/18723 | 1.12e-03 | 1.02e-02 | 42 |
| GO:0033875 | Colorectum | AD | ribonucleoside bisphosphate metabolic process | 42/3918 | 128/18723 | 1.12e-03 | 1.02e-02 | 42 |
| GO:0034032 | Colorectum | AD | purine nucleoside bisphosphate metabolic process | 42/3918 | 128/18723 | 1.12e-03 | 1.02e-02 | 42 |
| GO:0120162 | Colorectum | AD | positive regulation of cold-induced thermogenesis | 32/3918 | 97/18723 | 3.74e-03 | 2.63e-02 | 32 |
| Page: 1 2 3 4 5 6 7 8 |
| Pathway ID | Tissue | Disease Stage | Description | Gene Ratio | Bg Ratio | pvalue | p.adjust | qvalue | Count |
| hsa01212 | Colorectum | CRC | Fatty acid metabolism | 14/1091 | 57/8465 | 1.17e-02 | 4.99e-02 | 3.38e-02 | 14 |
| hsa012121 | Colorectum | CRC | Fatty acid metabolism | 14/1091 | 57/8465 | 1.17e-02 | 4.99e-02 | 3.38e-02 | 14 |
| hsa012124 | Liver | HCC | Fatty acid metabolism | 45/4020 | 57/8465 | 1.05e-06 | 1.10e-05 | 6.09e-06 | 45 |
| hsa000622 | Liver | HCC | Fatty acid elongation | 20/4020 | 27/8465 | 4.58e-03 | 1.36e-02 | 7.55e-03 | 20 |
| hsa010402 | Liver | HCC | Biosynthesis of unsaturated fatty acids | 19/4020 | 27/8465 | 1.37e-02 | 3.33e-02 | 1.85e-02 | 19 |
| hsa012125 | Liver | HCC | Fatty acid metabolism | 45/4020 | 57/8465 | 1.05e-06 | 1.10e-05 | 6.09e-06 | 45 |
| hsa0006211 | Liver | HCC | Fatty acid elongation | 20/4020 | 27/8465 | 4.58e-03 | 1.36e-02 | 7.55e-03 | 20 |
| hsa010403 | Liver | HCC | Biosynthesis of unsaturated fatty acids | 19/4020 | 27/8465 | 1.37e-02 | 3.33e-02 | 1.85e-02 | 19 |
| hsa012128 | Oral cavity | OSCC | Fatty acid metabolism | 35/3704 | 57/8465 | 5.37e-03 | 1.29e-02 | 6.55e-03 | 35 |
| hsa0121213 | Oral cavity | OSCC | Fatty acid metabolism | 35/3704 | 57/8465 | 5.37e-03 | 1.29e-02 | 6.55e-03 | 35 |
| Page: 1 |
Top |
Cell-cell communication analysis |
| Identification of potential cell-cell interactions between two cell types and their ligand-receptor pairs for different disease states |
| Ligand | Receptor | LRpair | Pathway | Tissue | Disease Stage |
| Page: 1 |
Top |
Single-cell gene regulatory network inference analysis |
| Find out the significant the regulons (TFs) and the target genes of each regulon across cell types for different disease states |
| TF | Cell Type | Tissue | Disease Stage | Target Gene | RSS | Regulon Activity |
| ∗The dot plots of a searched regulon are shown for all cell subpopulations in each disease state of each tissue based on the regulon specific score inferred using pySCENIC and by calculating the average expression. |
| Page: 1 |
Top |
Somatic mutation of malignant transformation related genes |
| Annotation of somatic variants for genes involved in malignant transformation |
| Hugo Symbol | Variant Class | Variant Classification | dbSNP RS | HGVSc | HGVSp | HGVSp Short | SWISSPROT | BIOTYPE | SIFT | PolyPhen | Tumor Sample Barcode | Tissue | Histology | Sex | Age | Stage | Therapy Types | Drugs | Outcome |
| ELOVL6 | SNV | Missense_Mutation | novel | c.327C>G | p.Ser109Arg | p.S109R | Q9H5J4 | protein_coding | deleterious(0.05) | benign(0.287) | TCGA-A8-A09A-01 | Breast | breast invasive carcinoma | Female | <65 | I/II | Hormone Therapy | tamoxiphen | SD |
| ELOVL6 | SNV | Missense_Mutation | c.793N>A | p.Glu265Lys | p.E265K | Q9H5J4 | protein_coding | tolerated(0.2) | benign(0) | TCGA-AC-A23H-01 | Breast | breast invasive carcinoma | Female | >=65 | I/II | Unknown | Unknown | PD | |
| ELOVL6 | SNV | Missense_Mutation | c.39N>A | p.Phe13Leu | p.F13L | Q9H5J4 | protein_coding | deleterious(0.03) | benign(0.057) | TCGA-BH-A0HX-01 | Breast | breast invasive carcinoma | Female | <65 | I/II | Chemotherapy | adrimycin | SD | |
| ELOVL6 | SNV | Missense_Mutation | novel | c.253N>G | p.Met85Val | p.M85V | Q9H5J4 | protein_coding | deleterious(0.01) | benign(0.038) | TCGA-EA-A3HS-01 | Cervix | cervical & endocervical cancer | Female | <65 | I/II | Unknown | Unknown | SD |
| ELOVL6 | SNV | Missense_Mutation | c.778A>G | p.Lys260Glu | p.K260E | Q9H5J4 | protein_coding | tolerated(0.11) | benign(0.385) | TCGA-AA-3663-01 | Colorectum | colon adenocarcinoma | Male | <65 | I/II | Unknown | Unknown | SD | |
| ELOVL6 | SNV | Missense_Mutation | c.226N>G | p.Phe76Val | p.F76V | Q9H5J4 | protein_coding | tolerated(0.51) | benign(0.01) | TCGA-AA-3977-01 | Colorectum | colon adenocarcinoma | Male | >=65 | I/II | Unknown | Unknown | SD | |
| ELOVL6 | SNV | Missense_Mutation | c.272N>G | p.Thr91Ser | p.T91S | Q9H5J4 | protein_coding | tolerated(0.28) | benign(0.038) | TCGA-CM-6674-01 | Colorectum | colon adenocarcinoma | Male | <65 | I/II | Unknown | Unknown | SD | |
| ELOVL6 | SNV | Missense_Mutation | novel | c.611N>T | p.Thr204Ile | p.T204I | Q9H5J4 | protein_coding | deleterious(0.02) | benign(0.012) | TCGA-D5-6530-01 | Colorectum | colon adenocarcinoma | Male | <65 | I/II | Unknown | Unknown | SD |
| ELOVL6 | SNV | Missense_Mutation | c.349N>C | p.Val117Leu | p.V117L | Q9H5J4 | protein_coding | tolerated(0.18) | benign(0.085) | TCGA-DY-A1DC-01 | Colorectum | rectum adenocarcinoma | Female | >=65 | I/II | Chemotherapy | capecitabine | PR | |
| ELOVL6 | SNV | Missense_Mutation | novel | c.690G>T | p.Gln230His | p.Q230H | Q9H5J4 | protein_coding | tolerated(0.06) | benign(0.005) | TCGA-F5-6814-01 | Colorectum | rectum adenocarcinoma | Male | <65 | I/II | Unknown | Unknown | SD |
| Page: 1 2 3 4 |
Top |
Related drugs of malignant transformation related genes |
| Identification of chemicals and drugs interact with genes involved in malignant transfromation |
| (DGIdb 4.0) |
| Entrez ID | Symbol | Category | Interaction Types | Drug Claim Name | Drug Name | PMIDs |
| Page: 1 |

Copyright 2023-Present -The University of Texas Health Science Center at Houston |