
|
|||||
|
 | |
| |
| |
| |
| |
| |
|
Gene: ELOVL1 |
Gene summary for ELOVL1 |
| Gene information | Species | Human | Gene symbol | ELOVL1 | Gene ID | 64834 |
| Gene name | ELOVL fatty acid elongase 1 | |
| Gene Alias | CGI-88 | |
| Cytomap | 1p34.2 | |
| Gene Type | protein-coding | GO ID | GO:0000038 | UniProtAcc | Q9BW60 |
Top |
Malignant transformation analysis |
| Identification of the aberrant gene expression in precancerous and cancerous lesions by comparing the gene expression of stem-like cells in diseased tissues with normal stem cells |
| Entrez ID | Symbol | Replicates | Species | Organ | Tissue | Adj P-value | Log2FC | Malignancy |
| 64834 | ELOVL1 | HTA11_3410_2000001011 | Human | Colorectum | AD | 2.38e-02 | 1.09e-01 | 0.0155 |
| 64834 | ELOVL1 | HTA11_2487_2000001011 | Human | Colorectum | SER | 9.73e-12 | 4.57e-01 | -0.1808 |
| 64834 | ELOVL1 | HTA11_1938_2000001011 | Human | Colorectum | AD | 2.12e-12 | 4.83e-01 | -0.0811 |
| 64834 | ELOVL1 | HTA11_78_2000001011 | Human | Colorectum | AD | 2.29e-08 | 2.98e-01 | -0.1088 |
| 64834 | ELOVL1 | HTA11_347_2000001011 | Human | Colorectum | AD | 5.66e-18 | 3.88e-01 | -0.1954 |
| 64834 | ELOVL1 | HTA11_411_2000001011 | Human | Colorectum | SER | 1.49e-02 | 5.35e-01 | -0.2602 |
| 64834 | ELOVL1 | HTA11_2112_2000001011 | Human | Colorectum | SER | 1.69e-06 | 6.24e-01 | -0.2196 |
| 64834 | ELOVL1 | HTA11_3361_2000001011 | Human | Colorectum | AD | 2.60e-07 | 3.25e-01 | -0.1207 |
| 64834 | ELOVL1 | HTA11_83_2000001011 | Human | Colorectum | SER | 3.78e-17 | 5.40e-01 | -0.1526 |
| 64834 | ELOVL1 | HTA11_696_2000001011 | Human | Colorectum | AD | 4.30e-12 | 3.61e-01 | -0.1464 |
| 64834 | ELOVL1 | HTA11_866_2000001011 | Human | Colorectum | AD | 3.41e-06 | 2.25e-01 | -0.1001 |
| 64834 | ELOVL1 | HTA11_1391_2000001011 | Human | Colorectum | AD | 7.59e-16 | 5.24e-01 | -0.059 |
| 64834 | ELOVL1 | HTA11_5212_2000001011 | Human | Colorectum | AD | 8.38e-03 | 2.87e-01 | -0.2061 |
| 64834 | ELOVL1 | HTA11_866_3004761011 | Human | Colorectum | AD | 9.89e-10 | 3.11e-01 | 0.096 |
| 64834 | ELOVL1 | HTA11_8622_2000001021 | Human | Colorectum | SER | 3.02e-07 | 3.31e-01 | 0.0528 |
| 64834 | ELOVL1 | HTA11_7663_2000001011 | Human | Colorectum | SER | 2.41e-05 | 4.42e-01 | 0.0131 |
| 64834 | ELOVL1 | HTA11_10623_2000001011 | Human | Colorectum | AD | 2.06e-03 | 3.01e-01 | -0.0177 |
| 64834 | ELOVL1 | HTA11_6801_2000001011 | Human | Colorectum | SER | 1.09e-02 | 3.53e-01 | 0.0171 |
| 64834 | ELOVL1 | HTA11_10711_2000001011 | Human | Colorectum | AD | 1.13e-04 | 2.77e-01 | 0.0338 |
| 64834 | ELOVL1 | HTA11_7696_3000711011 | Human | Colorectum | AD | 6.34e-09 | 2.97e-01 | 0.0674 |
| Page: 1 2 3 4 5 6 7 8 |
| Tissue | Expression Dynamics | Abbreviation |
| Colorectum (GSE201348) |  | FAP: Familial adenomatous polyposis |
| CRC: Colorectal cancer | ||
| Colorectum (HTA11) |  | AD: Adenomas |
| SER: Sessile serrated lesions | ||
| MSI-H: Microsatellite-high colorectal cancer | ||
| MSS: Microsatellite stable colorectal cancer | ||
| Esophagus | 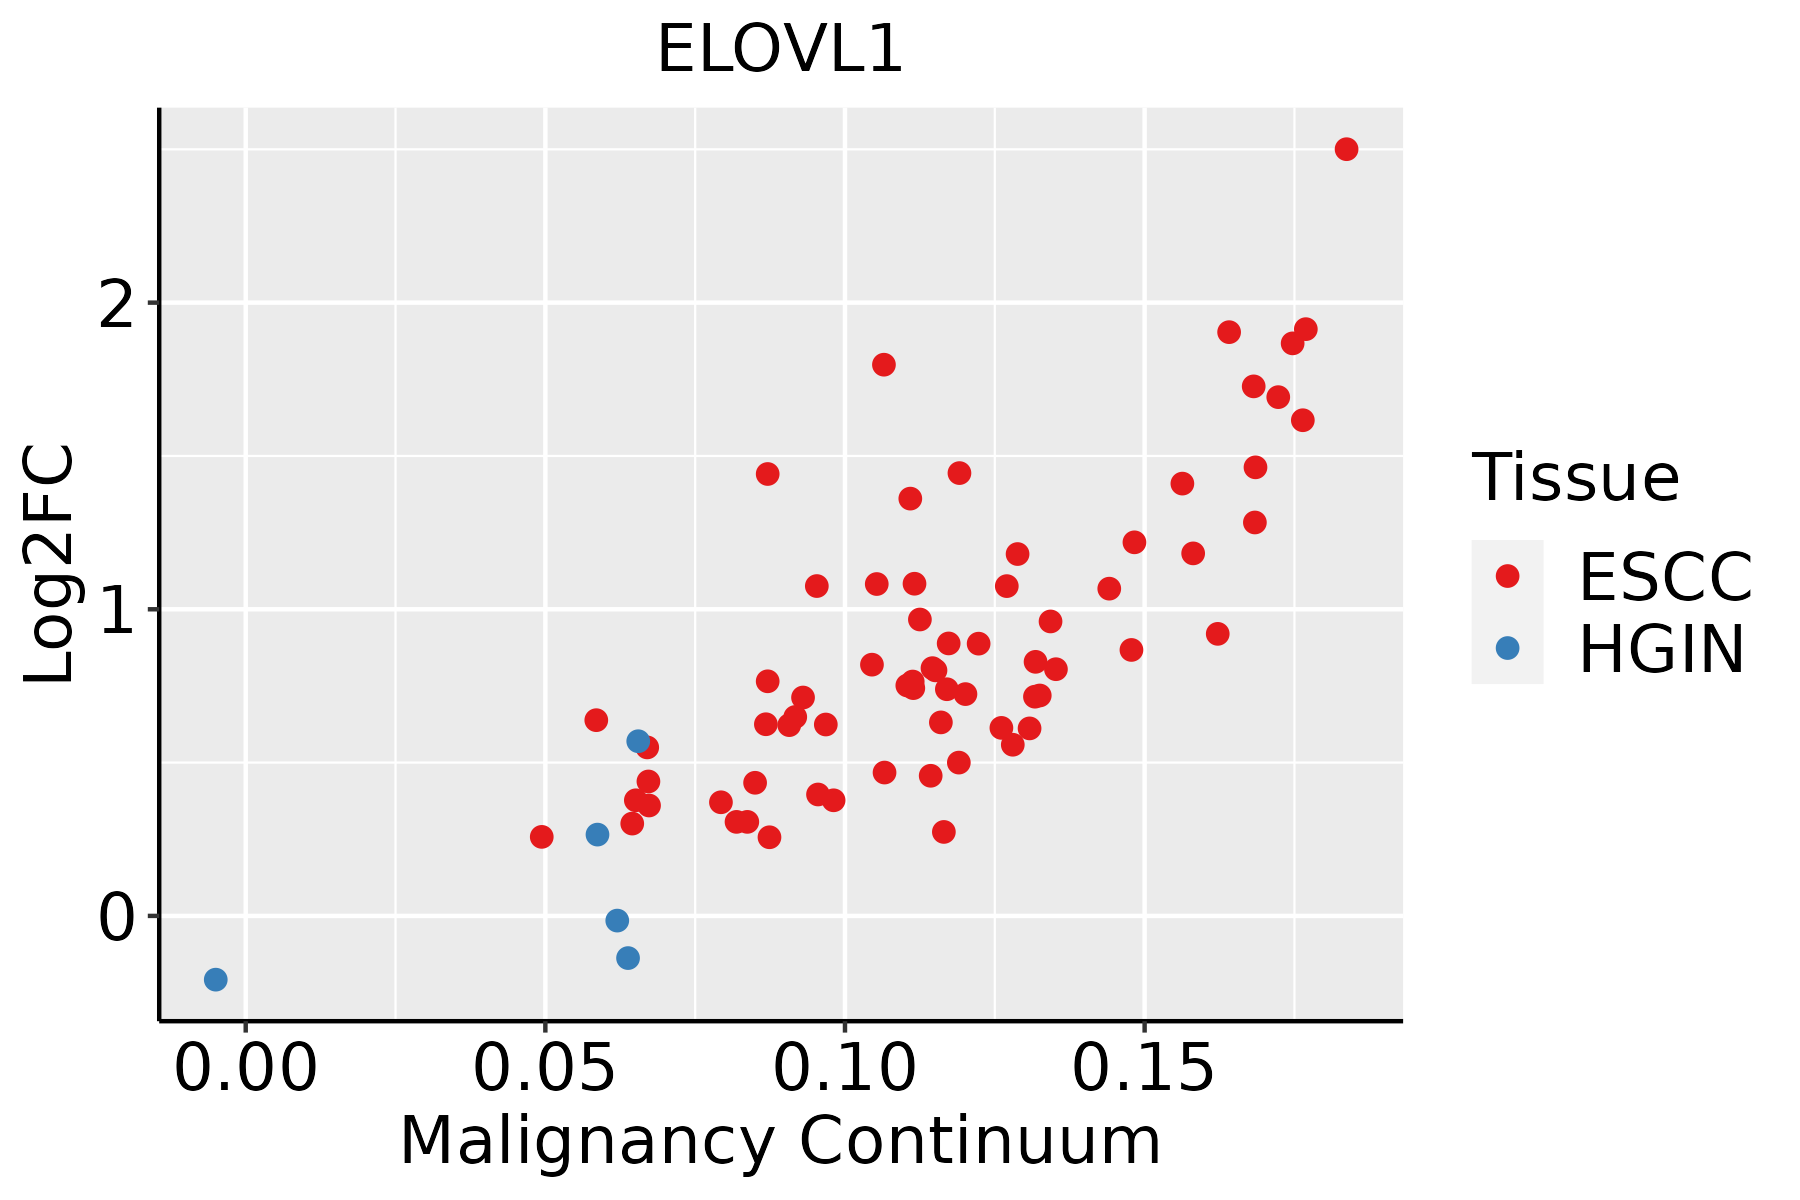 | ESCC: Esophageal squamous cell carcinoma |
| HGIN: High-grade intraepithelial neoplasias | ||
| LGIN: Low-grade intraepithelial neoplasias | ||
| Liver | 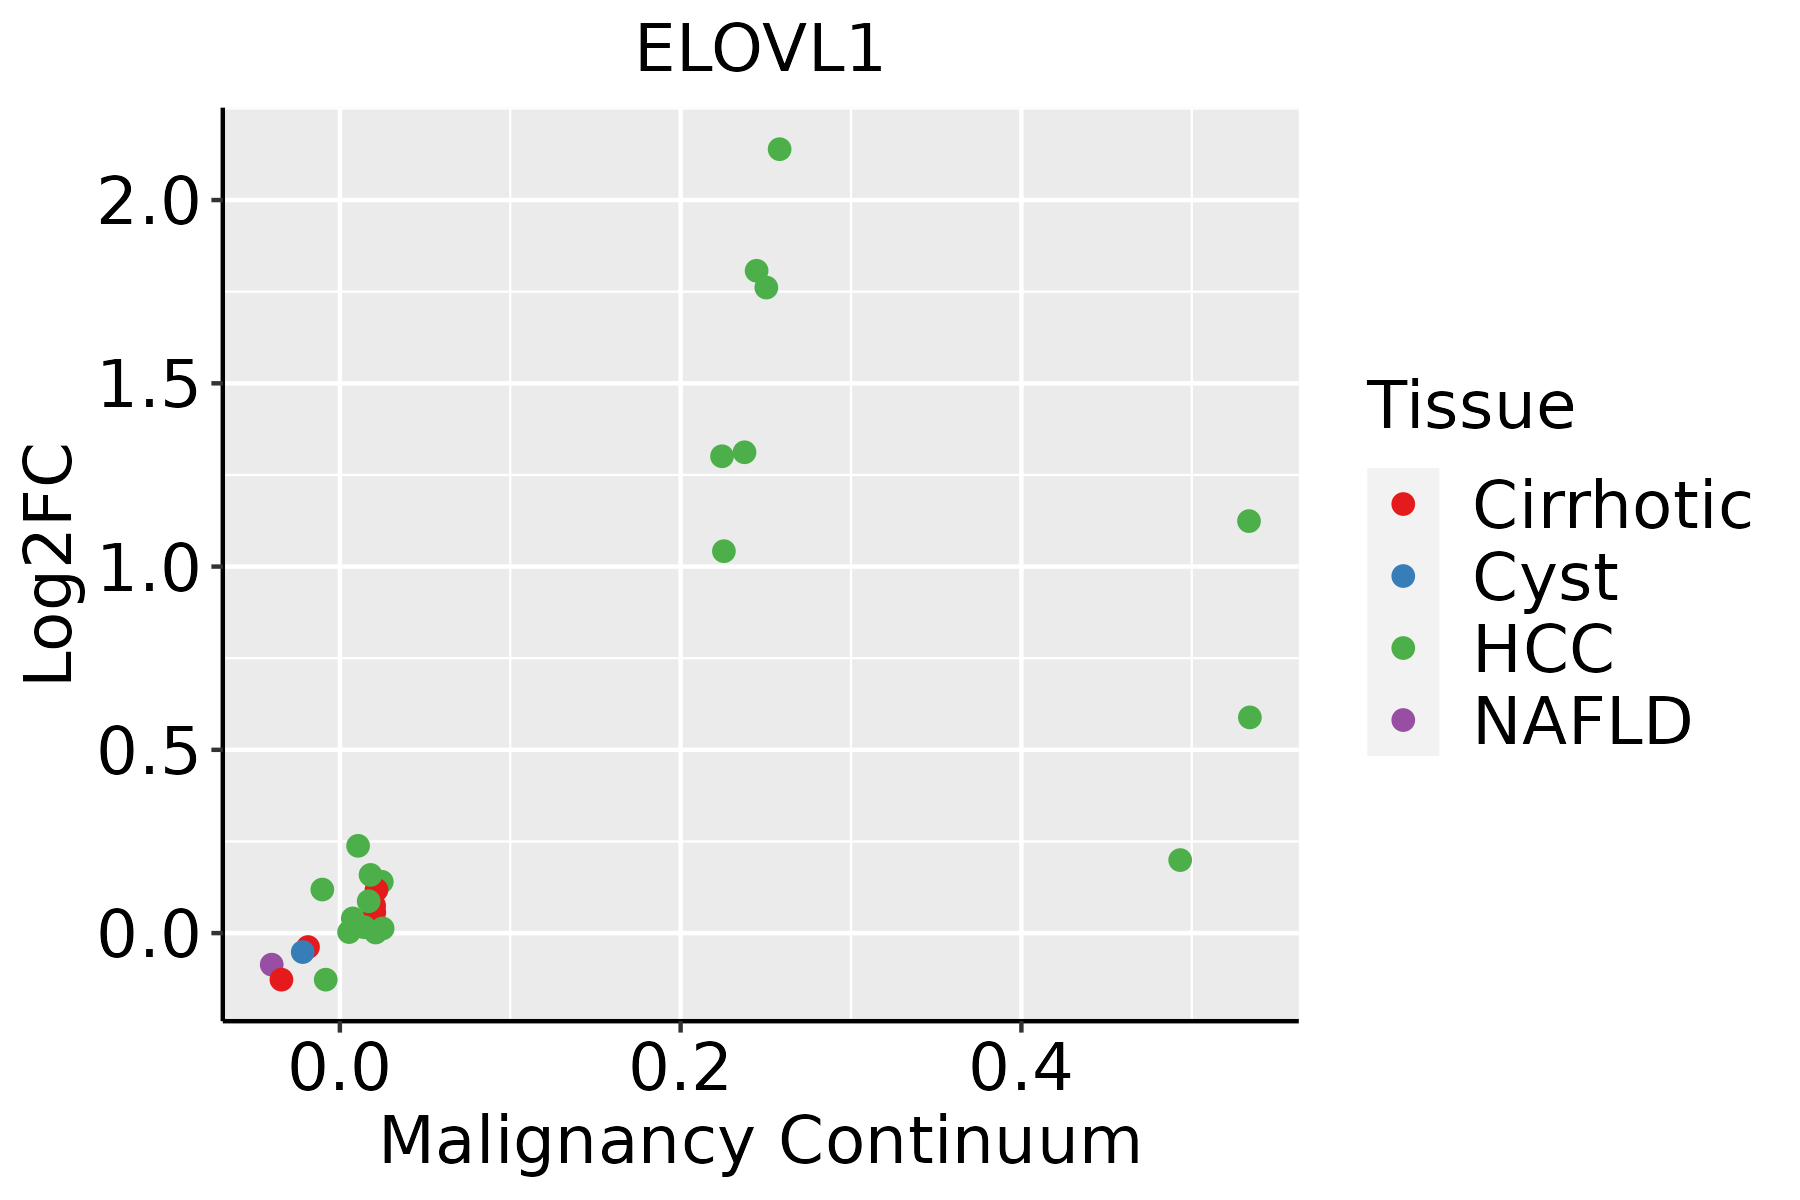 | HCC: Hepatocellular carcinoma |
| NAFLD: Non-alcoholic fatty liver disease | ||
| Oral Cavity | 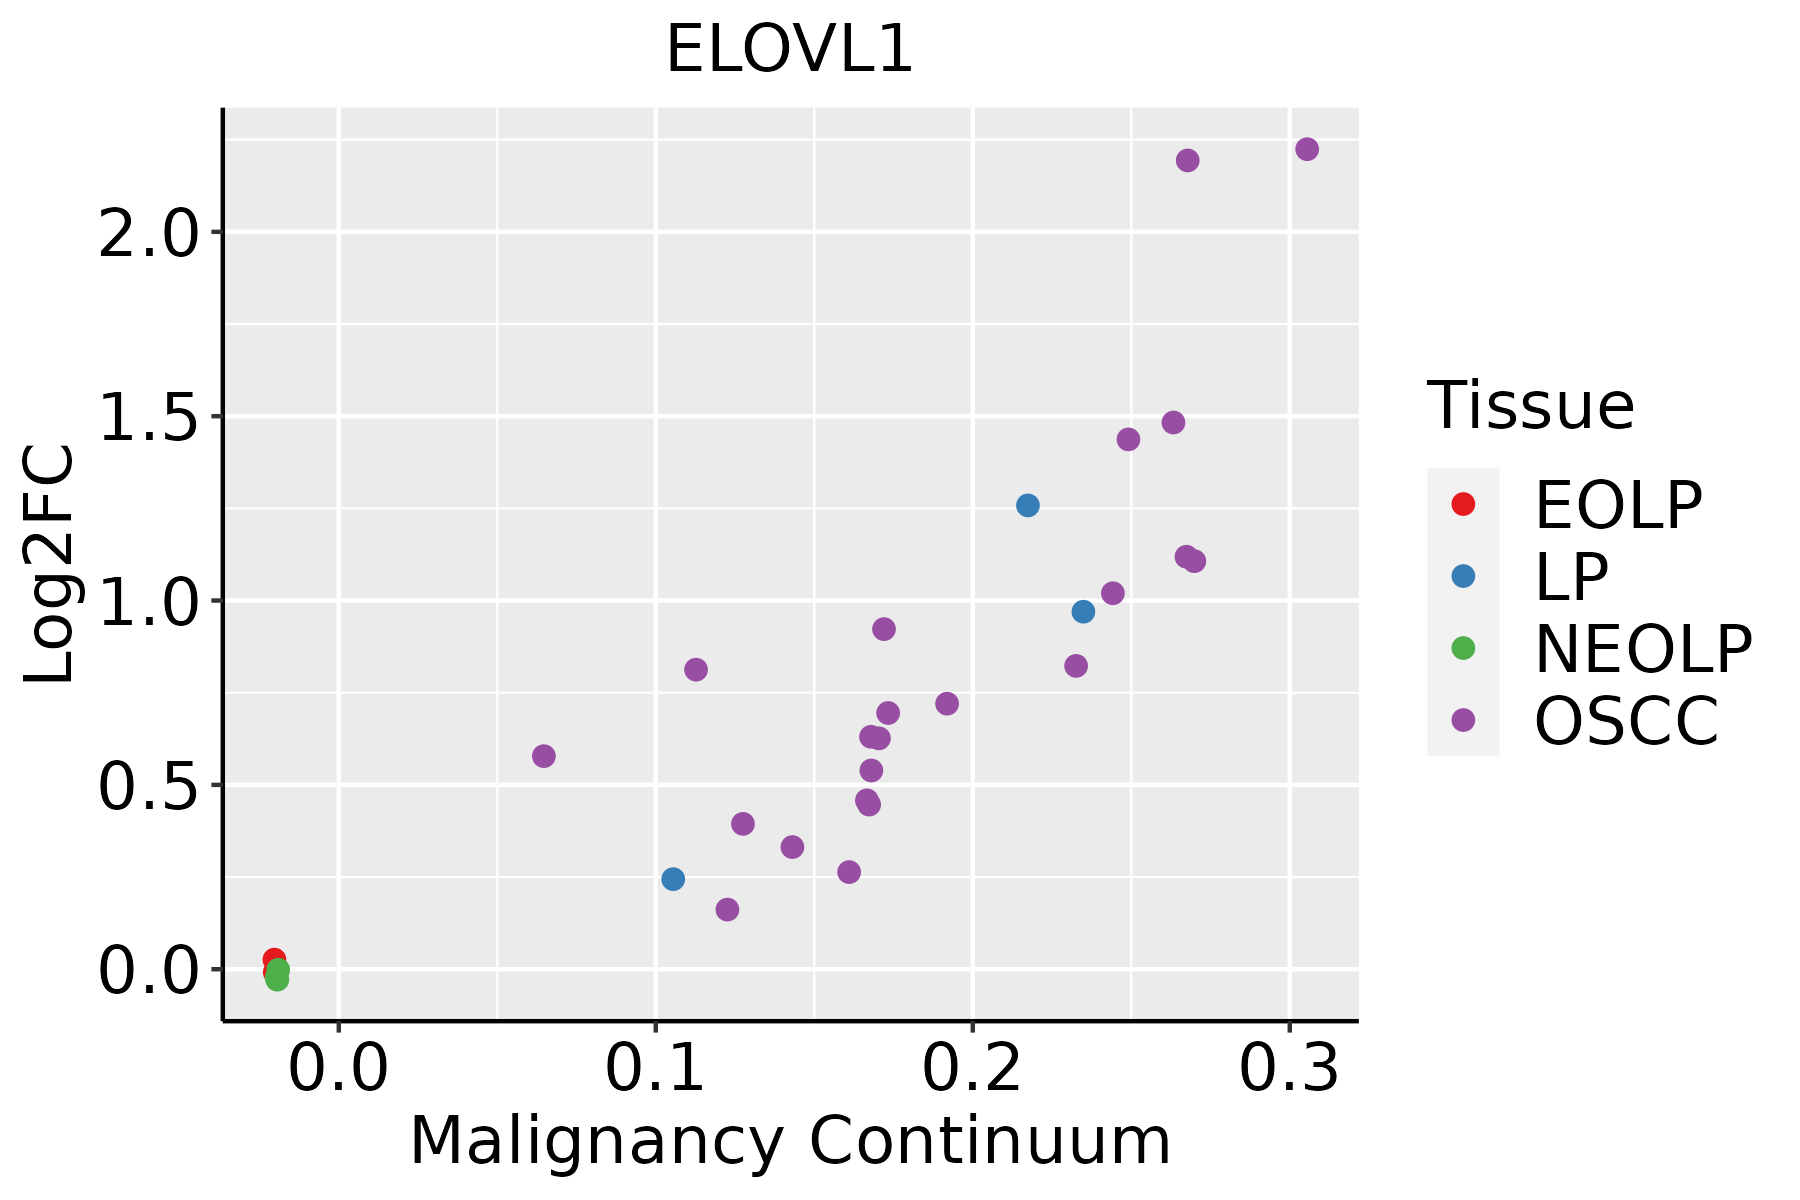 | EOLP: Erosive Oral lichen planus |
| LP: leukoplakia | ||
| NEOLP: Non-erosive oral lichen planus | ||
| OSCC: Oral squamous cell carcinoma | ||
| Skin | 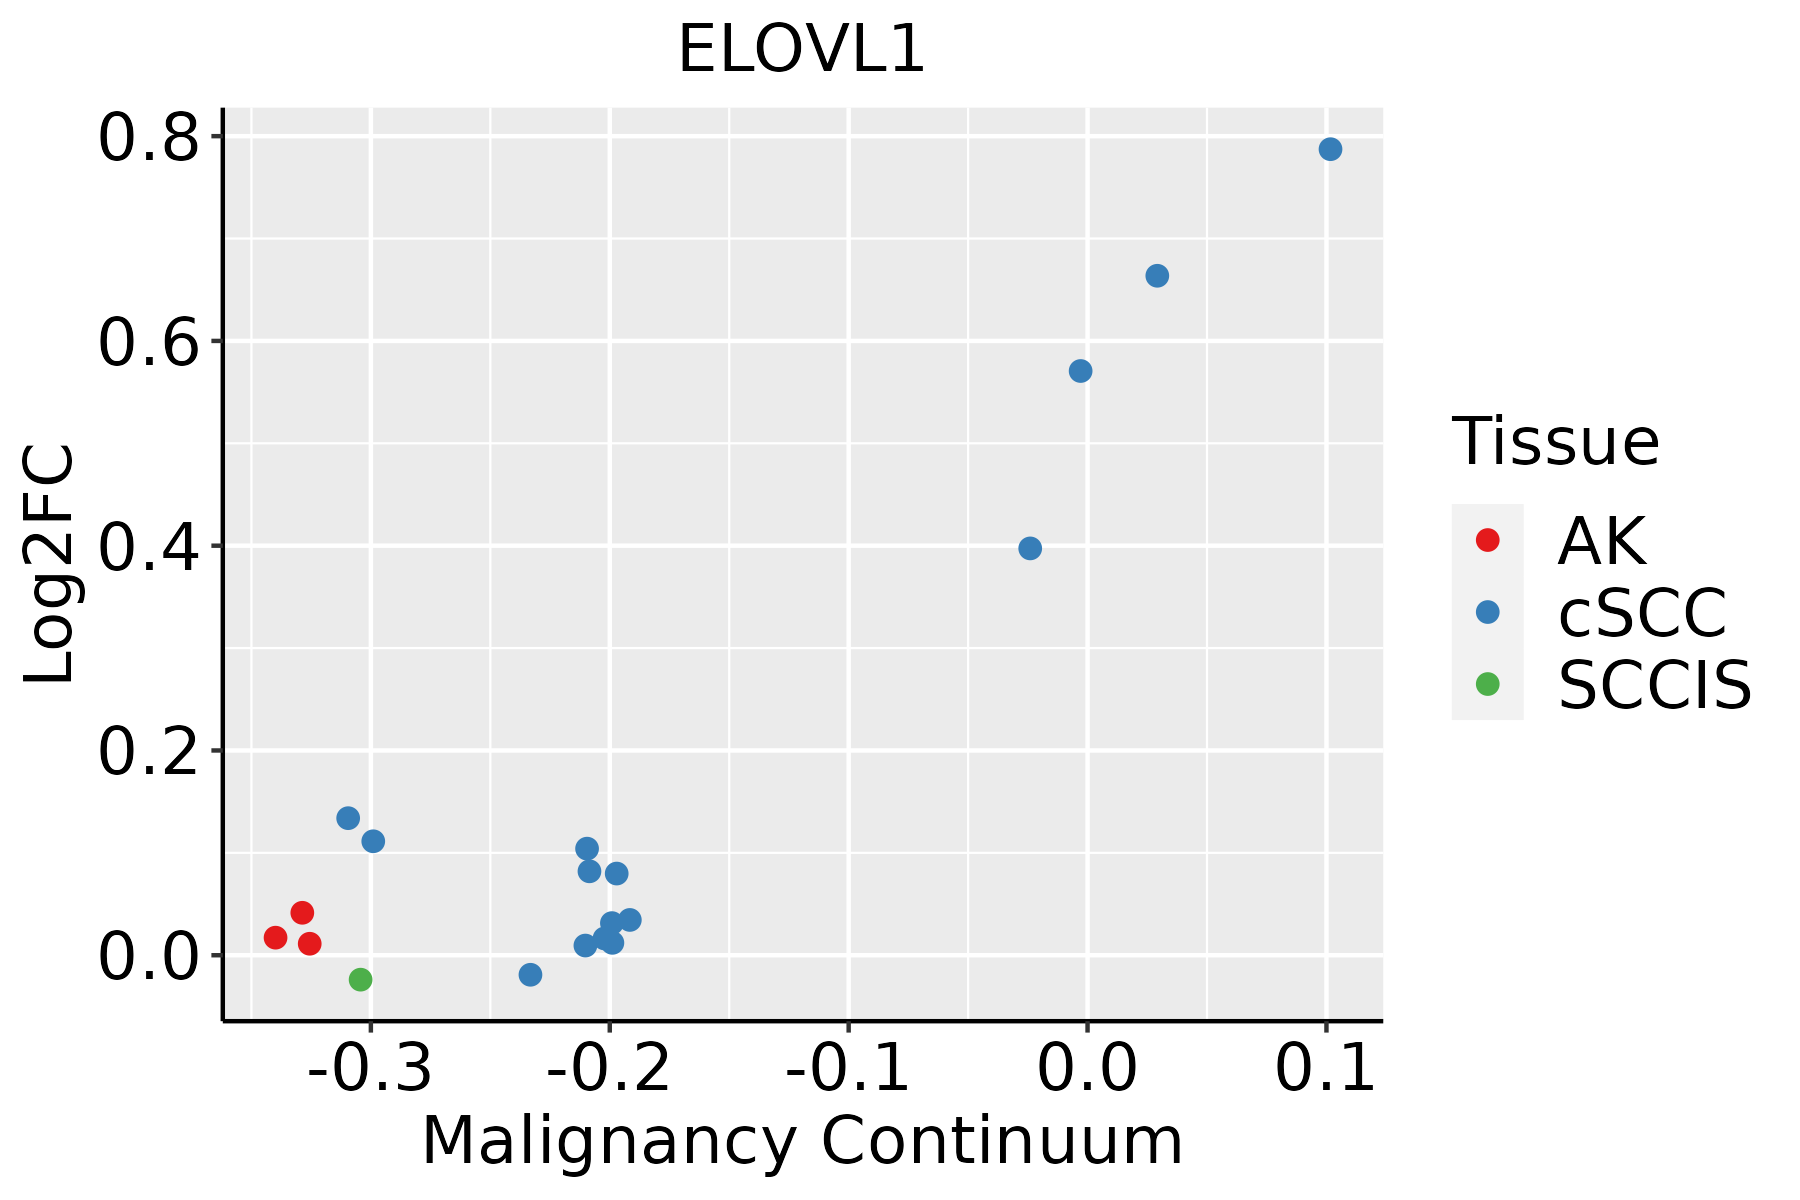 | AK: Actinic keratosis |
| cSCC: Cutaneous squamous cell carcinoma | ||
| SCCIS:squamous cell carcinoma in situ | ||
| Thyroid | 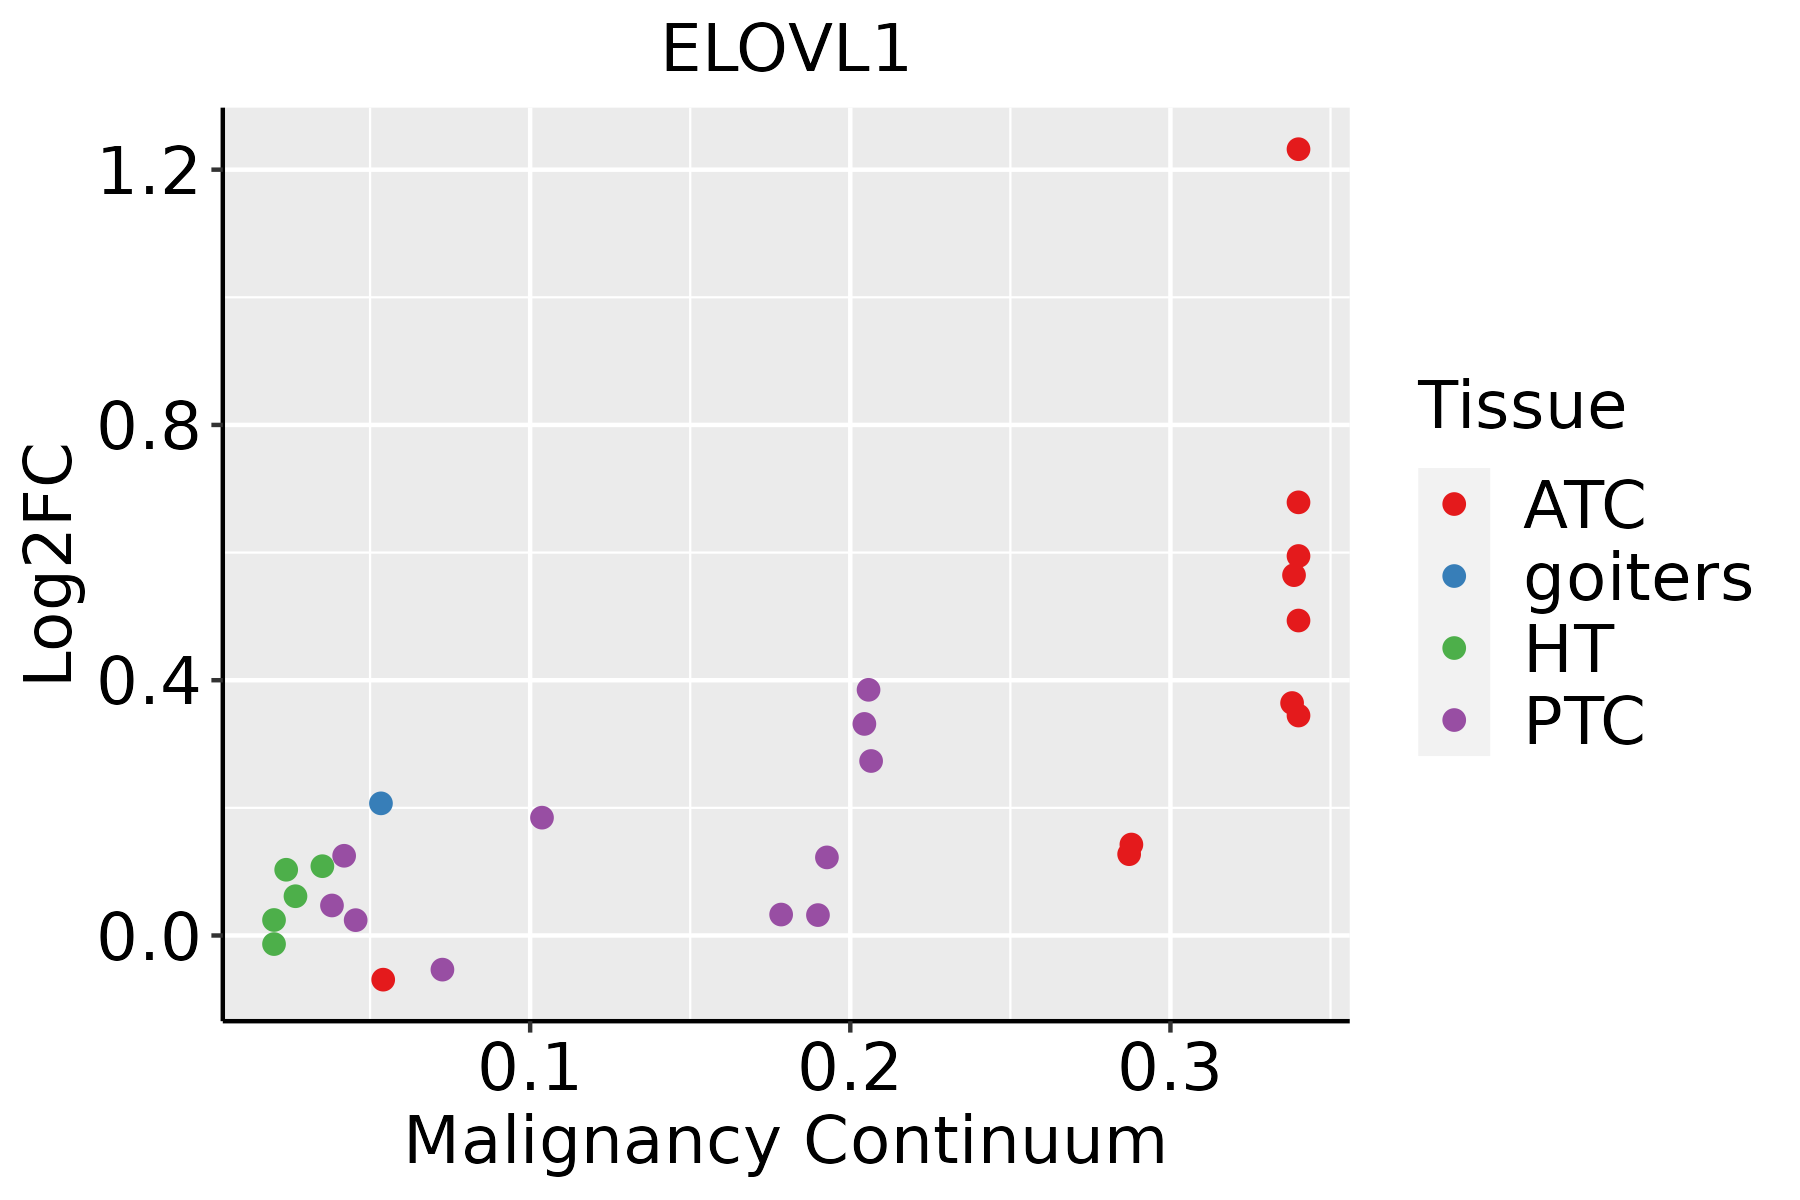 | ATC: Anaplastic thyroid cancer |
| HT: Hashimoto's thyroiditis | ||
| PTC: Papillary thyroid cancer |
| ∗log2FC in expression of this searched gene in stem-like cells from each diseased tissue sample relative to stem-like cells in normal samples in each tissue plotted against the malignancy continuum. Samples are colored based on if they are from different disease stage. |
Top |
Malignant transformation related pathway analysis |
| Find out the enriched GO biological processes and KEGG pathways involved in transition from healthy to precancer to cancer |
| Tissue | Disease Stage | Enriched GO biological Processes |
| Colorectum | AD |  |
| Colorectum | SER |  |
| Colorectum | MSS |  |
| Colorectum | MSI-H |  |
| Colorectum | FAP |  |
| ∗Top 15 enriched GO BP terms are showed in the bar plot of each disease state in each tissue. Each row represents a significant GO biological process which is colored according to the -log10(p.adjust). |
| Page: 1 2 3 4 5 6 7 8 9 |
| GO ID | Tissue | Disease Stage | Description | Gene Ratio | Bg Ratio | pvalue | p.adjust | Count |
| GO:0009150 | Colorectum | AD | purine ribonucleotide metabolic process | 142/3918 | 368/18723 | 4.29e-15 | 1.17e-12 | 142 |
| GO:0006163 | Colorectum | AD | purine nucleotide metabolic process | 149/3918 | 396/18723 | 1.08e-14 | 2.80e-12 | 149 |
| GO:0072521 | Colorectum | AD | purine-containing compound metabolic process | 153/3918 | 416/18723 | 4.34e-14 | 1.01e-11 | 153 |
| GO:0009259 | Colorectum | AD | ribonucleotide metabolic process | 144/3918 | 385/18723 | 5.25e-14 | 1.13e-11 | 144 |
| GO:0019693 | Colorectum | AD | ribose phosphate metabolic process | 145/3918 | 396/18723 | 3.01e-13 | 5.71e-11 | 145 |
| GO:0009117 | Colorectum | AD | nucleotide metabolic process | 168/3918 | 489/18723 | 2.20e-12 | 3.36e-10 | 168 |
| GO:0006753 | Colorectum | AD | nucleoside phosphate metabolic process | 169/3918 | 497/18723 | 4.99e-12 | 6.98e-10 | 169 |
| GO:0009152 | Colorectum | AD | purine ribonucleotide biosynthetic process | 64/3918 | 169/18723 | 3.09e-07 | 1.22e-05 | 64 |
| GO:0009260 | Colorectum | AD | ribonucleotide biosynthetic process | 66/3918 | 182/18723 | 1.25e-06 | 4.02e-05 | 66 |
| GO:0046390 | Colorectum | AD | ribose phosphate biosynthetic process | 67/3918 | 190/18723 | 3.21e-06 | 9.05e-05 | 67 |
| GO:0006164 | Colorectum | AD | purine nucleotide biosynthetic process | 66/3918 | 191/18723 | 8.22e-06 | 1.97e-04 | 66 |
| GO:0072522 | Colorectum | AD | purine-containing compound biosynthetic process | 68/3918 | 200/18723 | 1.12e-05 | 2.55e-04 | 68 |
| GO:0006631 | Colorectum | AD | fatty acid metabolic process | 114/3918 | 390/18723 | 5.58e-05 | 9.44e-04 | 114 |
| GO:1901293 | Colorectum | AD | nucleoside phosphate biosynthetic process | 80/3918 | 256/18723 | 6.31e-05 | 1.05e-03 | 80 |
| GO:0006790 | Colorectum | AD | sulfur compound metabolic process | 101/3918 | 339/18723 | 6.46e-05 | 1.07e-03 | 101 |
| GO:0009165 | Colorectum | AD | nucleotide biosynthetic process | 79/3918 | 254/18723 | 8.33e-05 | 1.30e-03 | 79 |
| GO:0050878 | Colorectum | AD | regulation of body fluid levels | 108/3918 | 379/18723 | 2.54e-04 | 3.20e-03 | 108 |
| GO:0033865 | Colorectum | AD | nucleoside bisphosphate metabolic process | 42/3918 | 128/18723 | 1.12e-03 | 1.02e-02 | 42 |
| GO:0033875 | Colorectum | AD | ribonucleoside bisphosphate metabolic process | 42/3918 | 128/18723 | 1.12e-03 | 1.02e-02 | 42 |
| GO:0034032 | Colorectum | AD | purine nucleoside bisphosphate metabolic process | 42/3918 | 128/18723 | 1.12e-03 | 1.02e-02 | 42 |
| Page: 1 2 3 4 5 6 7 8 9 10 11 12 13 14 |
| Pathway ID | Tissue | Disease Stage | Description | Gene Ratio | Bg Ratio | pvalue | p.adjust | qvalue | Count |
| hsa00062 | Colorectum | SER | Fatty acid elongation | 11/1580 | 27/8465 | 6.38e-03 | 3.68e-02 | 2.67e-02 | 11 |
| hsa000621 | Colorectum | SER | Fatty acid elongation | 11/1580 | 27/8465 | 6.38e-03 | 3.68e-02 | 2.67e-02 | 11 |
| hsa012129 | Esophagus | ESCC | Fatty acid metabolism | 41/4205 | 57/8465 | 5.13e-04 | 1.75e-03 | 8.98e-04 | 41 |
| hsa0121214 | Esophagus | ESCC | Fatty acid metabolism | 41/4205 | 57/8465 | 5.13e-04 | 1.75e-03 | 8.98e-04 | 41 |
| hsa012122 | Liver | Cirrhotic | Fatty acid metabolism | 32/2530 | 57/8465 | 3.12e-05 | 2.47e-04 | 1.52e-04 | 32 |
| hsa01040 | Liver | Cirrhotic | Biosynthesis of unsaturated fatty acids | 14/2530 | 27/8465 | 1.36e-02 | 4.25e-02 | 2.62e-02 | 14 |
| hsa012123 | Liver | Cirrhotic | Fatty acid metabolism | 32/2530 | 57/8465 | 3.12e-05 | 2.47e-04 | 1.52e-04 | 32 |
| hsa010401 | Liver | Cirrhotic | Biosynthesis of unsaturated fatty acids | 14/2530 | 27/8465 | 1.36e-02 | 4.25e-02 | 2.62e-02 | 14 |
| hsa012124 | Liver | HCC | Fatty acid metabolism | 45/4020 | 57/8465 | 1.05e-06 | 1.10e-05 | 6.09e-06 | 45 |
| hsa000622 | Liver | HCC | Fatty acid elongation | 20/4020 | 27/8465 | 4.58e-03 | 1.36e-02 | 7.55e-03 | 20 |
| hsa010402 | Liver | HCC | Biosynthesis of unsaturated fatty acids | 19/4020 | 27/8465 | 1.37e-02 | 3.33e-02 | 1.85e-02 | 19 |
| hsa012125 | Liver | HCC | Fatty acid metabolism | 45/4020 | 57/8465 | 1.05e-06 | 1.10e-05 | 6.09e-06 | 45 |
| hsa0006211 | Liver | HCC | Fatty acid elongation | 20/4020 | 27/8465 | 4.58e-03 | 1.36e-02 | 7.55e-03 | 20 |
| hsa010403 | Liver | HCC | Biosynthesis of unsaturated fatty acids | 19/4020 | 27/8465 | 1.37e-02 | 3.33e-02 | 1.85e-02 | 19 |
| hsa012128 | Oral cavity | OSCC | Fatty acid metabolism | 35/3704 | 57/8465 | 5.37e-03 | 1.29e-02 | 6.55e-03 | 35 |
| hsa0121213 | Oral cavity | OSCC | Fatty acid metabolism | 35/3704 | 57/8465 | 5.37e-03 | 1.29e-02 | 6.55e-03 | 35 |
| Page: 1 |
Top |
Cell-cell communication analysis |
| Identification of potential cell-cell interactions between two cell types and their ligand-receptor pairs for different disease states |
| Ligand | Receptor | LRpair | Pathway | Tissue | Disease Stage |
| Page: 1 |
Top |
Single-cell gene regulatory network inference analysis |
| Find out the significant the regulons (TFs) and the target genes of each regulon across cell types for different disease states |
| TF | Cell Type | Tissue | Disease Stage | Target Gene | RSS | Regulon Activity |
| ∗The dot plots of a searched regulon are shown for all cell subpopulations in each disease state of each tissue based on the regulon specific score inferred using pySCENIC and by calculating the average expression. |
| Page: 1 |
Top |
Somatic mutation of malignant transformation related genes |
| Annotation of somatic variants for genes involved in malignant transformation |
| Hugo Symbol | Variant Class | Variant Classification | dbSNP RS | HGVSc | HGVSp | HGVSp Short | SWISSPROT | BIOTYPE | SIFT | PolyPhen | Tumor Sample Barcode | Tissue | Histology | Sex | Age | Stage | Therapy Types | Drugs | Outcome |
| ELOVL1 | SNV | Missense_Mutation | c.672N>A | p.Ser224Arg | p.S224R | Q9BW60 | protein_coding | deleterious(0.01) | benign(0.003) | TCGA-JW-A5VG-01 | Cervix | cervical & endocervical cancer | Female | <65 | I/II | Chemotherapy | cisplatin | SD | |
| ELOVL1 | SNV | Missense_Mutation | c.788G>A | p.Arg263His | p.R263H | Q9BW60 | protein_coding | deleterious(0.03) | benign(0.223) | TCGA-A6-5661-01 | Colorectum | colon adenocarcinoma | Female | >=65 | I/II | Unknown | Unknown | SD | |
| ELOVL1 | SNV | Missense_Mutation | rs754465886 | c.143N>A | p.Arg48His | p.R48H | Q9BW60 | protein_coding | deleterious(0) | probably_damaging(0.953) | TCGA-A6-6653-01 | Colorectum | colon adenocarcinoma | Male | >=65 | I/II | Unknown | Unknown | SD |
| ELOVL1 | SNV | Missense_Mutation | c.601N>G | p.Met201Val | p.M201V | Q9BW60 | protein_coding | deleterious(0) | benign(0.088) | TCGA-AA-3715-01 | Colorectum | colon adenocarcinoma | Male | >=65 | I/II | Unknown | Unknown | PD | |
| ELOVL1 | SNV | Missense_Mutation | rs201783931 | c.325N>T | p.Arg109Trp | p.R109W | Q9BW60 | protein_coding | tolerated(0.08) | benign(0.052) | TCGA-CA-6717-01 | Colorectum | colon adenocarcinoma | Male | <65 | I/II | Chemotherapy | oxaliplatin | CR |
| ELOVL1 | SNV | Missense_Mutation | c.684G>C | p.Gln228His | p.Q228H | Q9BW60 | protein_coding | deleterious(0.01) | probably_damaging(0.996) | TCGA-RU-A8FL-01 | Colorectum | colon adenocarcinoma | Male | <65 | III/IV | Chemotherapy | folfox | PD | |
| ELOVL1 | SNV | Missense_Mutation | c.602T>C | p.Met201Thr | p.M201T | Q9BW60 | protein_coding | deleterious(0) | possibly_damaging(0.665) | TCGA-AP-A056-01 | Endometrium | uterine corpus endometrioid carcinoma | Female | <65 | I/II | Unknown | Unknown | SD | |
| ELOVL1 | SNV | Missense_Mutation | rs201270403 | c.157C>T | p.Arg53Trp | p.R53W | Q9BW60 | protein_coding | deleterious(0) | probably_damaging(0.999) | TCGA-AX-A2HC-01 | Endometrium | uterine corpus endometrioid carcinoma | Female | <65 | III/IV | Chemotherapy | paclitaxel | PD |
| ELOVL1 | SNV | Missense_Mutation | rs754465886 | c.143G>A | p.Arg48His | p.R48H | Q9BW60 | protein_coding | deleterious(0) | probably_damaging(0.953) | TCGA-B5-A1MX-01 | Endometrium | uterine corpus endometrioid carcinoma | Female | <65 | I/II | Hormone Therapy | megace | SD |
| ELOVL1 | SNV | Missense_Mutation | c.52N>T | p.Arg18Trp | p.R18W | Q9BW60 | protein_coding | deleterious(0) | probably_damaging(1) | TCGA-BG-A0MQ-01 | Endometrium | uterine corpus endometrioid carcinoma | Female | >=65 | I/II | Unknown | Unknown | SD |
| Page: 1 2 3 |
Top |
Related drugs of malignant transformation related genes |
| Identification of chemicals and drugs interact with genes involved in malignant transfromation |
| (DGIdb 4.0) |
| Entrez ID | Symbol | Category | Interaction Types | Drug Claim Name | Drug Name | PMIDs |
| Page: 1 |

Copyright 2023-Present -The University of Texas Health Science Center at Houston |