
|
|||||
|
 | |
| |
| |
| |
| |
| |
|
Gene: ELOC |
Gene summary for ELOC |
| Gene information | Species | Human | Gene symbol | ELOC | Gene ID | 6921 |
| Gene name | elongin C | |
| Gene Alias | SIII | |
| Cytomap | 8q21.11 | |
| Gene Type | protein-coding | GO ID | GO:0006139 | UniProtAcc | A0A024R7Y5 |
Top |
Malignant transformation analysis |
| Identification of the aberrant gene expression in precancerous and cancerous lesions by comparing the gene expression of stem-like cells in diseased tissues with normal stem cells |
| Entrez ID | Symbol | Replicates | Species | Organ | Tissue | Adj P-value | Log2FC | Malignancy |
| 6921 | ELOC | GSM4909281 | Human | Breast | IDC | 2.00e-28 | 6.61e-01 | 0.21 |
| 6921 | ELOC | GSM4909282 | Human | Breast | IDC | 2.55e-25 | 7.15e-01 | -0.0288 |
| 6921 | ELOC | GSM4909285 | Human | Breast | IDC | 2.69e-16 | 4.66e-01 | 0.21 |
| 6921 | ELOC | GSM4909286 | Human | Breast | IDC | 4.10e-23 | 3.31e-01 | 0.1081 |
| 6921 | ELOC | GSM4909289 | Human | Breast | IDC | 1.95e-03 | 5.05e-01 | 0.1064 |
| 6921 | ELOC | GSM4909290 | Human | Breast | IDC | 1.39e-07 | 3.70e-01 | 0.2096 |
| 6921 | ELOC | GSM4909291 | Human | Breast | IDC | 5.34e-46 | 1.03e+00 | 0.1753 |
| 6921 | ELOC | GSM4909293 | Human | Breast | IDC | 8.82e-08 | 1.36e-01 | 0.1581 |
| 6921 | ELOC | GSM4909295 | Human | Breast | IDC | 1.60e-05 | 4.41e-01 | 0.0898 |
| 6921 | ELOC | GSM4909296 | Human | Breast | IDC | 8.58e-07 | 3.53e-01 | 0.1524 |
| 6921 | ELOC | GSM4909297 | Human | Breast | IDC | 1.62e-05 | 2.16e-01 | 0.1517 |
| 6921 | ELOC | GSM4909298 | Human | Breast | IDC | 3.25e-08 | 1.85e-01 | 0.1551 |
| 6921 | ELOC | GSM4909301 | Human | Breast | IDC | 1.68e-02 | 3.40e-01 | 0.1577 |
| 6921 | ELOC | GSM4909304 | Human | Breast | IDC | 2.69e-06 | 2.86e-01 | 0.1636 |
| 6921 | ELOC | GSM4909305 | Human | Breast | IDC | 1.15e-09 | 4.17e-01 | 0.0436 |
| 6921 | ELOC | GSM4909306 | Human | Breast | IDC | 1.38e-26 | 7.01e-01 | 0.1564 |
| 6921 | ELOC | GSM4909307 | Human | Breast | IDC | 7.59e-09 | 4.28e-01 | 0.1569 |
| 6921 | ELOC | GSM4909308 | Human | Breast | IDC | 4.45e-15 | 4.06e-01 | 0.158 |
| 6921 | ELOC | GSM4909309 | Human | Breast | IDC | 1.77e-03 | 3.23e-01 | 0.0483 |
| 6921 | ELOC | GSM4909311 | Human | Breast | IDC | 7.21e-19 | 2.08e-01 | 0.1534 |
| Page: 1 2 3 4 5 6 7 8 9 |
| Tissue | Expression Dynamics | Abbreviation |
| Breast |  | IDC: Invasive ductal carcinoma |
| DCIS: Ductal carcinoma in situ | ||
| Precancer(BRCA1-mut): Precancerous lesion from BRCA1 mutation carriers | ||
| Endometrium | 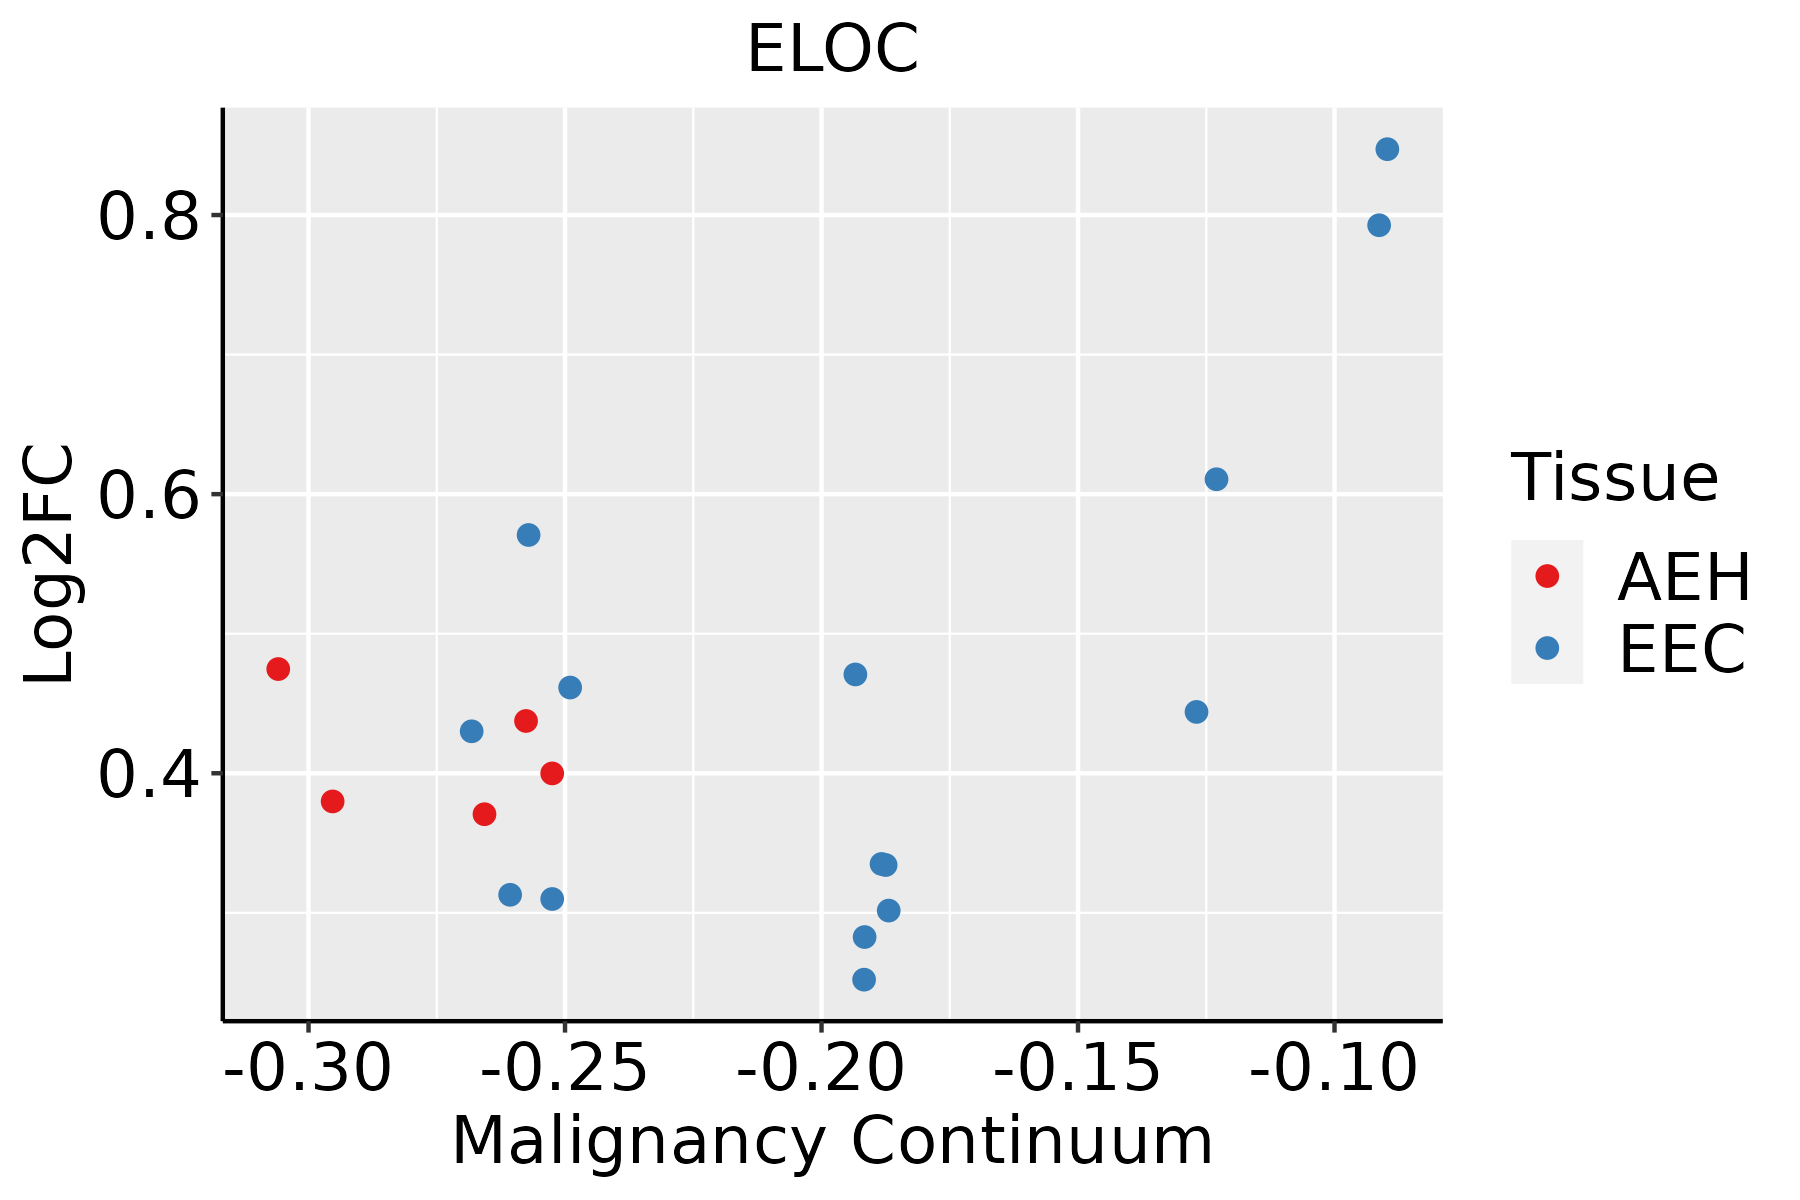 | AEH: Atypical endometrial hyperplasia |
| EEC: Endometrioid Cancer | ||
| Esophagus |  | ESCC: Esophageal squamous cell carcinoma |
| HGIN: High-grade intraepithelial neoplasias | ||
| LGIN: Low-grade intraepithelial neoplasias | ||
| GC | 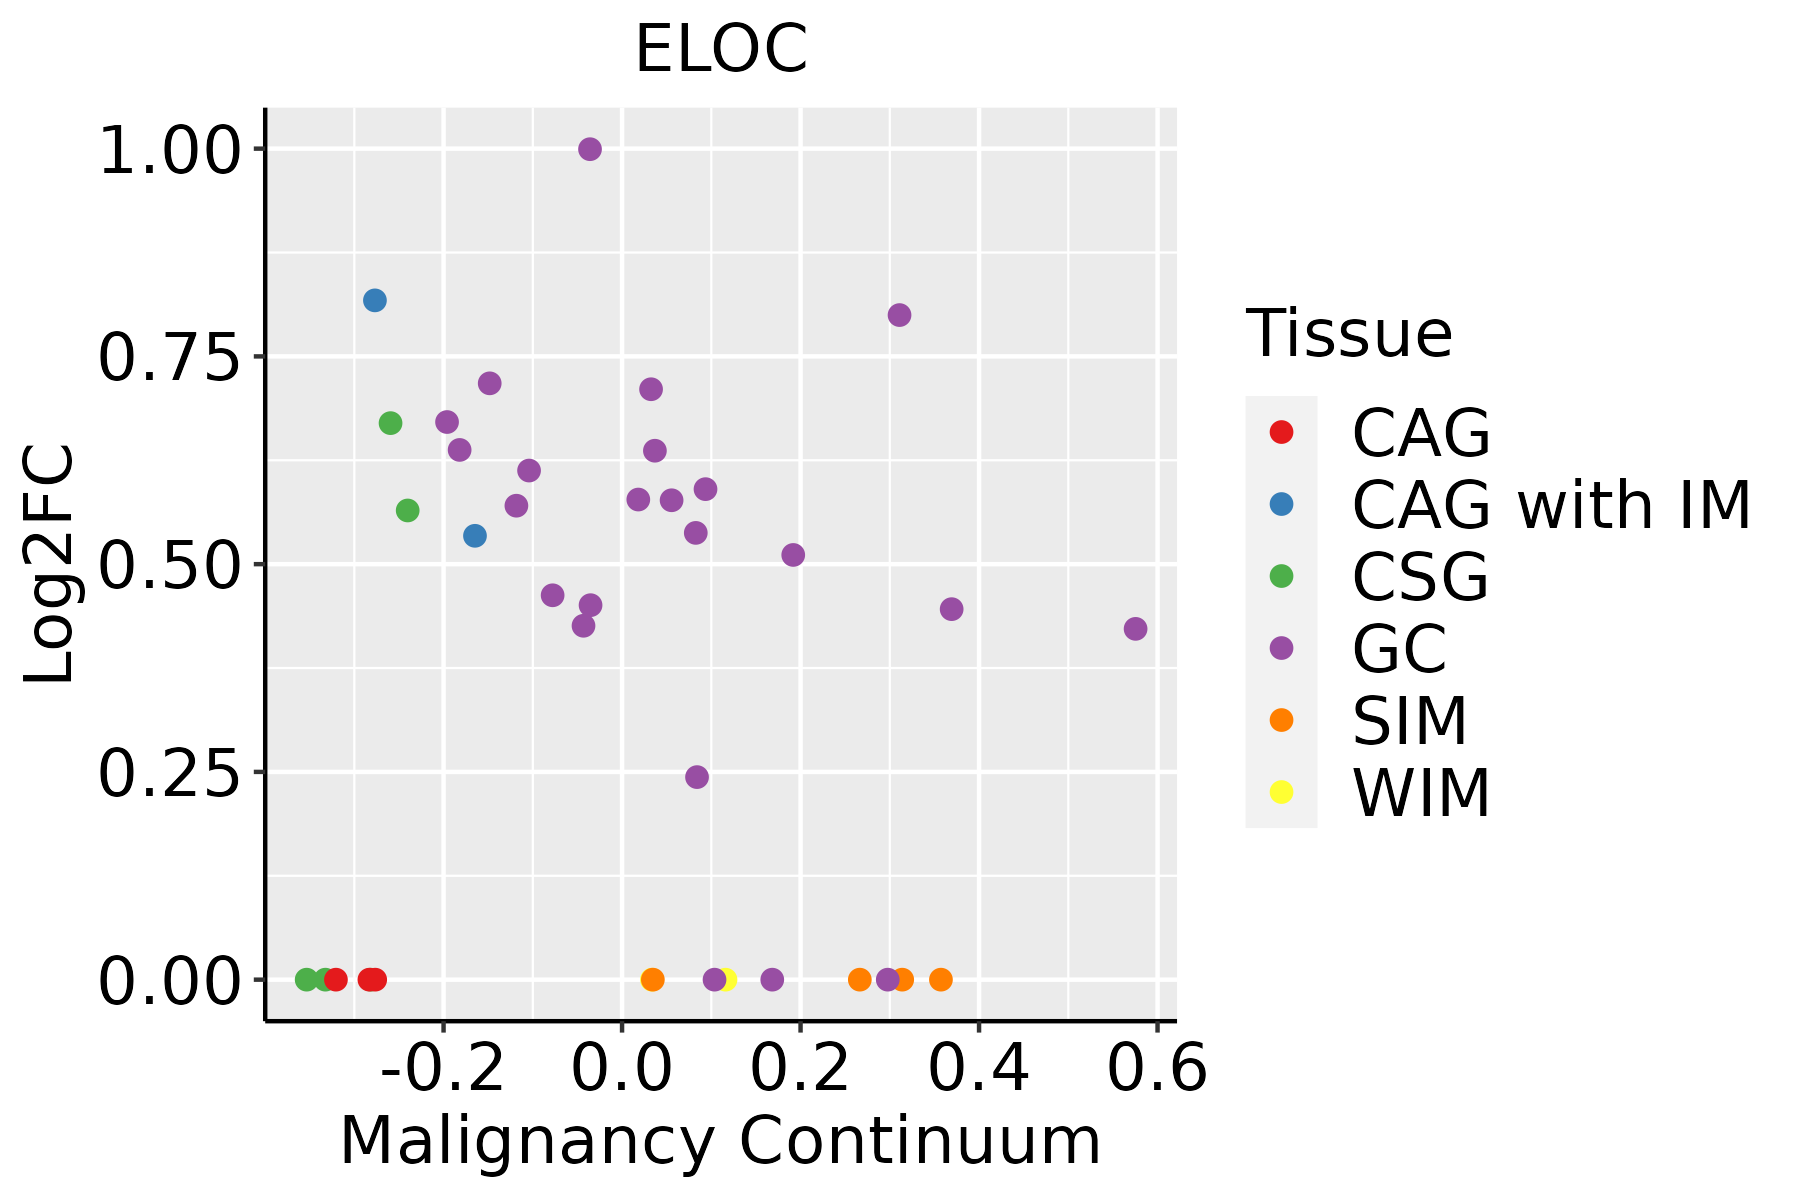 | CAG: Chronic atrophic gastritis |
| CAG with IM: Chronic atrophic gastritis with intestinal metaplasia | ||
| CSG: Chronic superficial gastritis | ||
| GC: Gastric cancer | ||
| SIM: Severe intestinal metaplasia | ||
| WIM: Wild intestinal metaplasia | ||
| Liver | 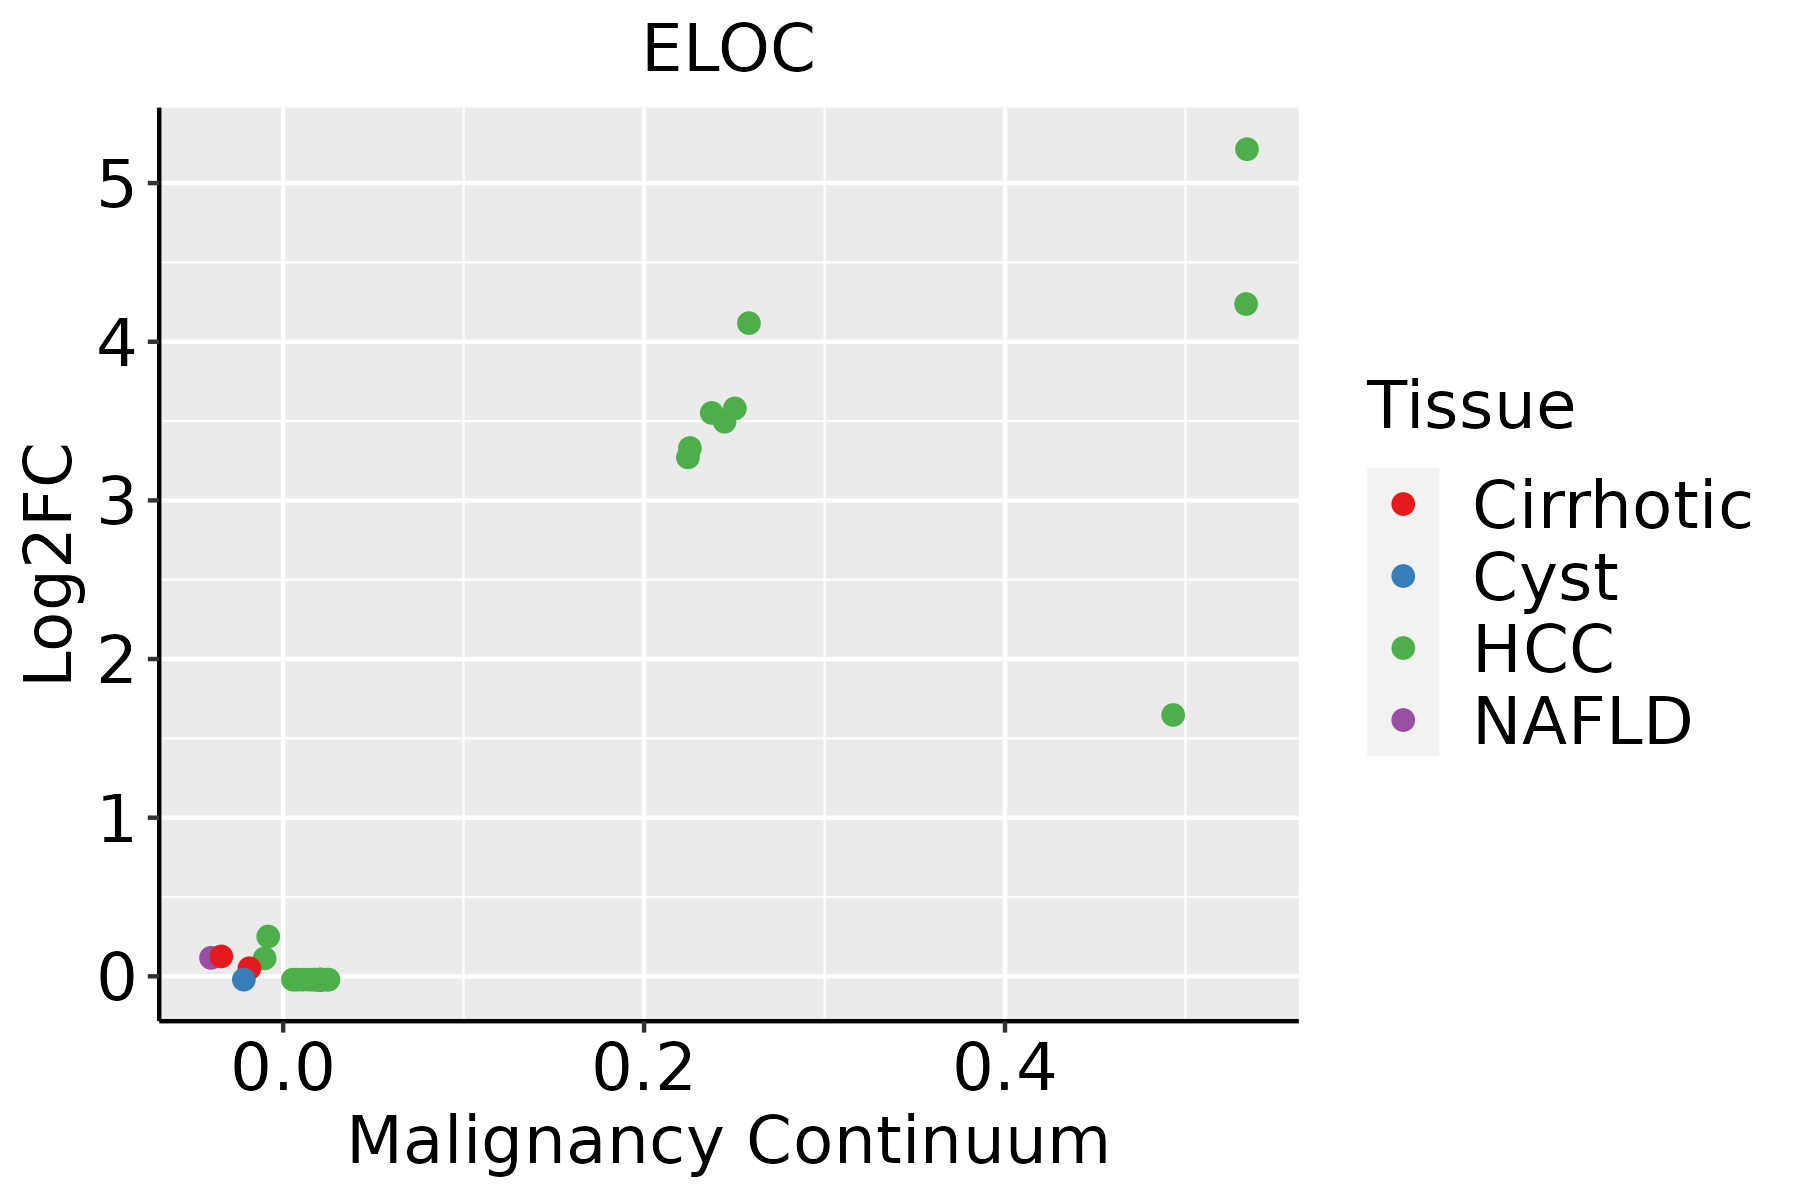 | HCC: Hepatocellular carcinoma |
| NAFLD: Non-alcoholic fatty liver disease | ||
| Lung | 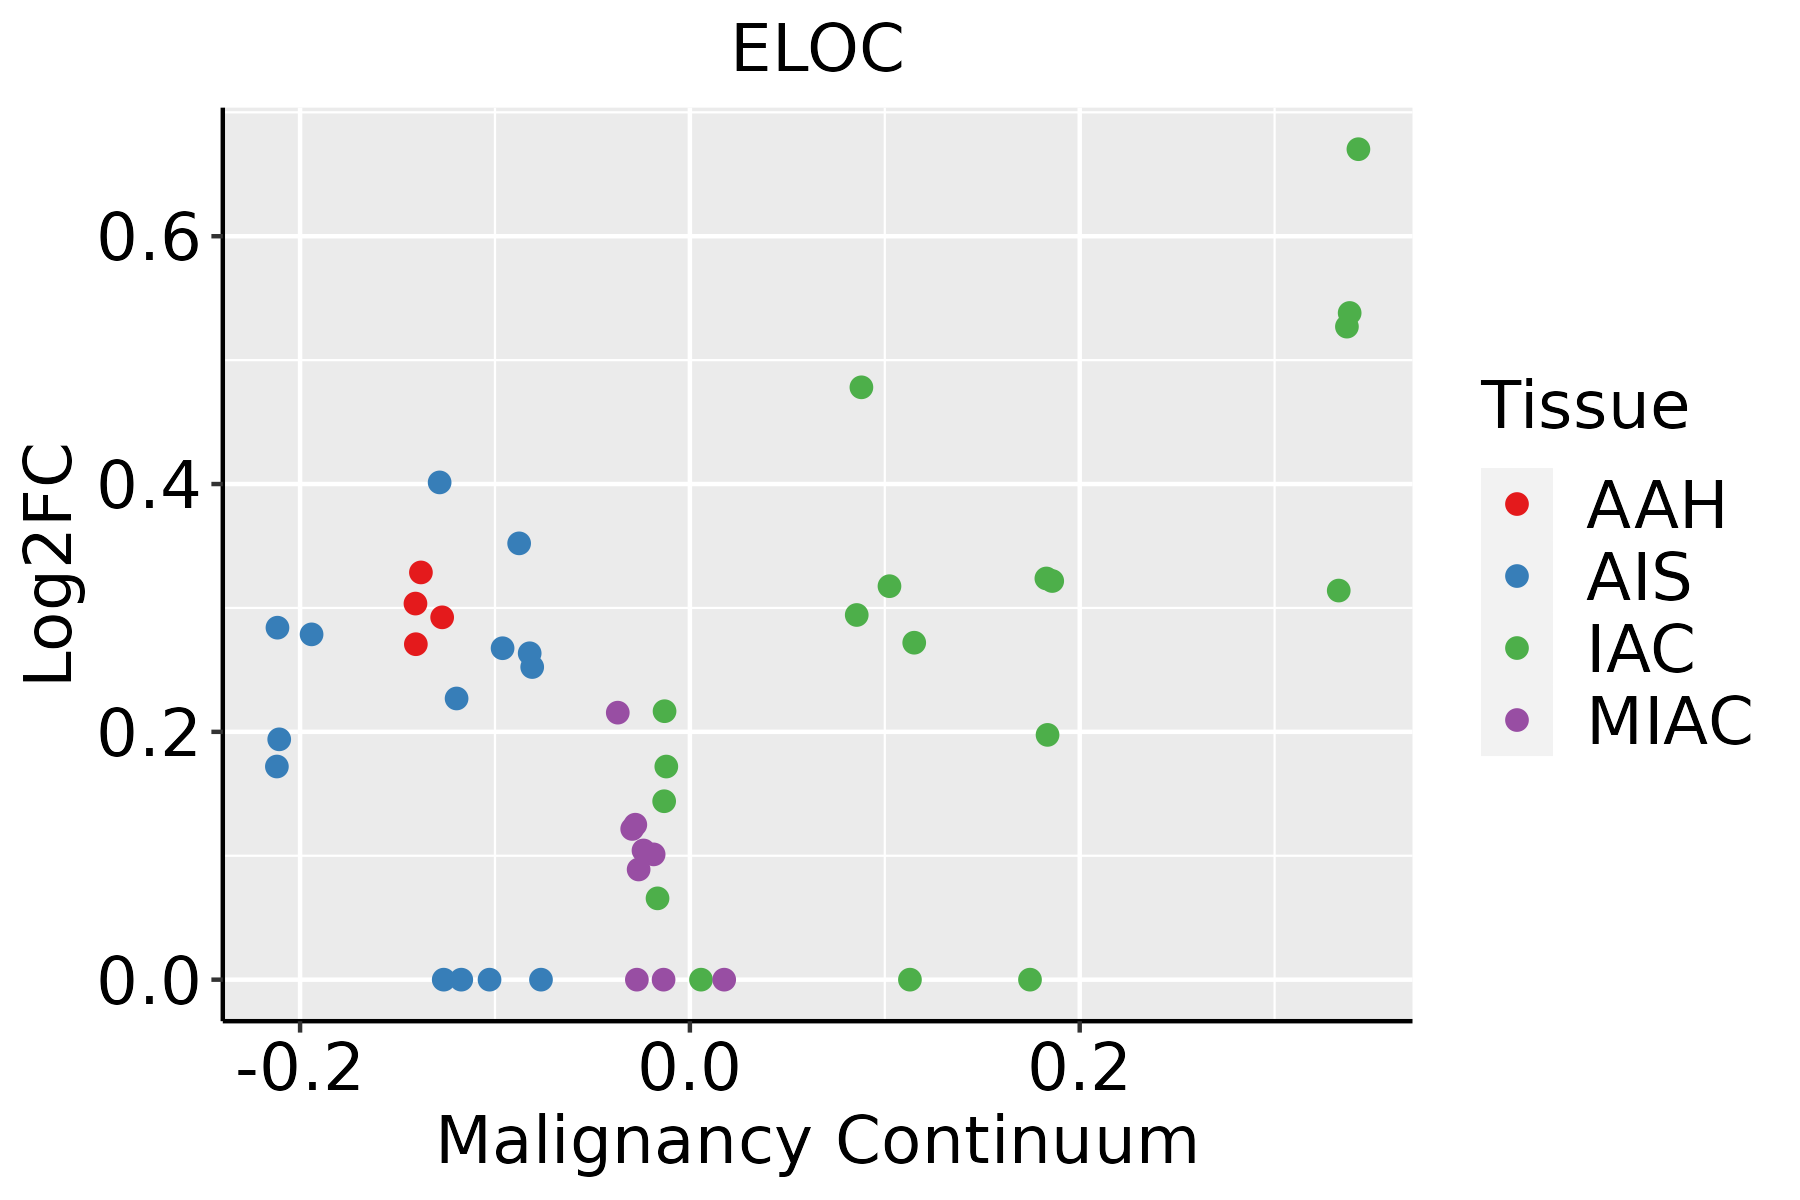 | AAH: Atypical adenomatous hyperplasia |
| AIS: Adenocarcinoma in situ | ||
| IAC: Invasive lung adenocarcinoma | ||
| MIA: Minimally invasive adenocarcinoma | ||
| Prostate |  | BPH: Benign Prostatic Hyperplasia |
| Skin | 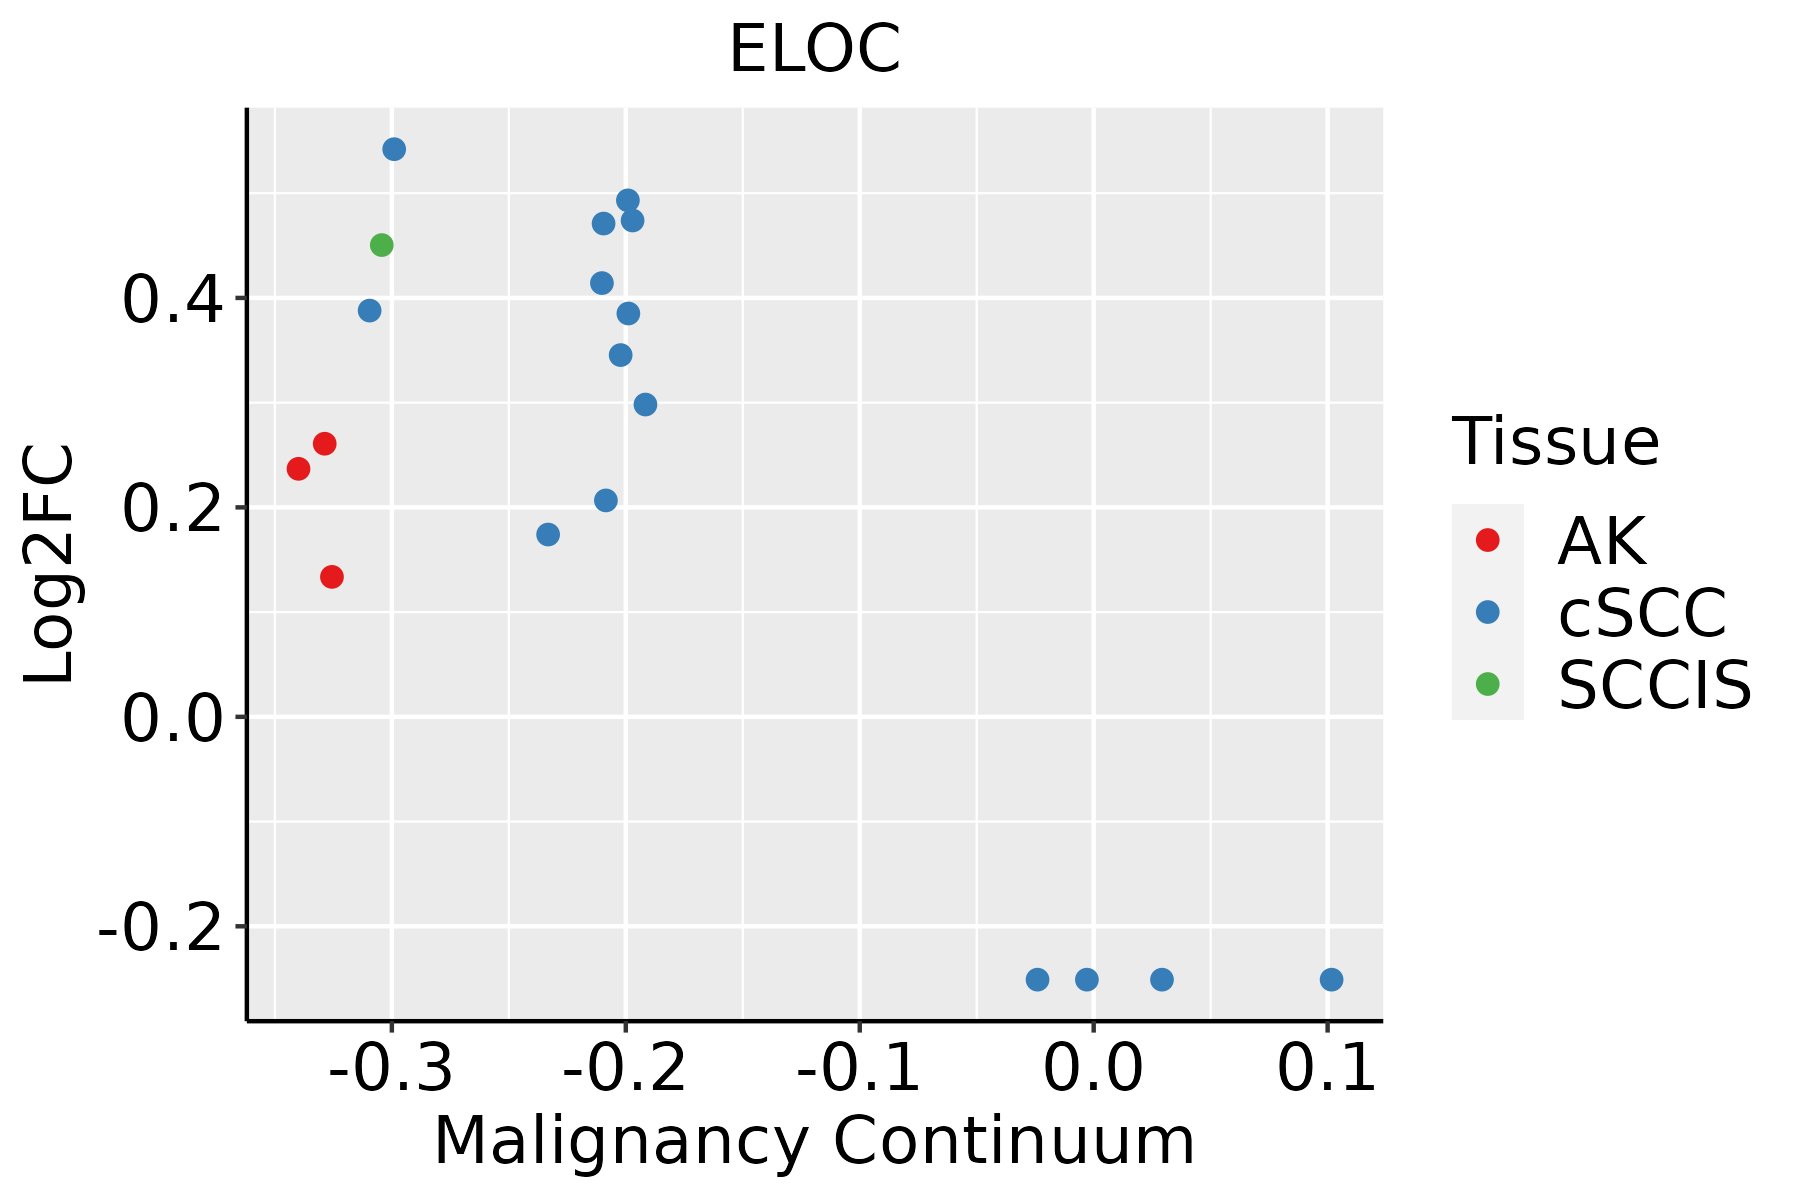 | AK: Actinic keratosis |
| cSCC: Cutaneous squamous cell carcinoma | ||
| SCCIS:squamous cell carcinoma in situ | ||
| Thyroid |  | ATC: Anaplastic thyroid cancer |
| HT: Hashimoto's thyroiditis | ||
| PTC: Papillary thyroid cancer |
| ∗log2FC in expression of this searched gene in stem-like cells from each diseased tissue sample relative to stem-like cells in normal samples in each tissue plotted against the malignancy continuum. Samples are colored based on if they are from different disease stage. |
Top |
Malignant transformation related pathway analysis |
| Find out the enriched GO biological processes and KEGG pathways involved in transition from healthy to precancer to cancer |
| Tissue | Disease Stage | Enriched GO biological Processes |
| Colorectum | AD |  |
| Colorectum | SER |  |
| Colorectum | MSS |  |
| Colorectum | MSI-H |  |
| Colorectum | FAP |  |
| ∗Top 15 enriched GO BP terms are showed in the bar plot of each disease state in each tissue. Each row represents a significant GO biological process which is colored according to the -log10(p.adjust). |
| Page: 1 2 3 4 5 6 7 8 9 |
| GO ID | Tissue | Disease Stage | Description | Gene Ratio | Bg Ratio | pvalue | p.adjust | Count |
| Page: 1 |
| Pathway ID | Tissue | Disease Stage | Description | Gene Ratio | Bg Ratio | pvalue | p.adjust | qvalue | Count |
| hsa0406616 | Breast | Precancer | HIF-1 signaling pathway | 23/684 | 109/8465 | 1.51e-05 | 1.59e-04 | 1.22e-04 | 23 |
| hsa0406617 | Breast | Precancer | HIF-1 signaling pathway | 23/684 | 109/8465 | 1.51e-05 | 1.59e-04 | 1.22e-04 | 23 |
| hsa0406623 | Breast | IDC | HIF-1 signaling pathway | 22/867 | 109/8465 | 1.36e-03 | 1.00e-02 | 7.50e-03 | 22 |
| hsa052118 | Breast | IDC | Renal cell carcinoma | 14/867 | 69/8465 | 9.16e-03 | 4.37e-02 | 3.27e-02 | 14 |
| hsa0517014 | Breast | IDC | Human immunodeficiency virus 1 infection | 33/867 | 212/8465 | 9.28e-03 | 4.37e-02 | 3.27e-02 | 33 |
| hsa0406633 | Breast | IDC | HIF-1 signaling pathway | 22/867 | 109/8465 | 1.36e-03 | 1.00e-02 | 7.50e-03 | 22 |
| hsa0521113 | Breast | IDC | Renal cell carcinoma | 14/867 | 69/8465 | 9.16e-03 | 4.37e-02 | 3.27e-02 | 14 |
| hsa0517015 | Breast | IDC | Human immunodeficiency virus 1 infection | 33/867 | 212/8465 | 9.28e-03 | 4.37e-02 | 3.27e-02 | 33 |
| hsa0406642 | Breast | DCIS | HIF-1 signaling pathway | 22/846 | 109/8465 | 9.83e-04 | 7.05e-03 | 5.20e-03 | 22 |
| hsa0517024 | Breast | DCIS | Human immunodeficiency virus 1 infection | 33/846 | 212/8465 | 6.49e-03 | 3.22e-02 | 2.37e-02 | 33 |
| hsa0521123 | Breast | DCIS | Renal cell carcinoma | 14/846 | 69/8465 | 7.42e-03 | 3.48e-02 | 2.56e-02 | 14 |
| hsa0406652 | Breast | DCIS | HIF-1 signaling pathway | 22/846 | 109/8465 | 9.83e-04 | 7.05e-03 | 5.20e-03 | 22 |
| hsa0517034 | Breast | DCIS | Human immunodeficiency virus 1 infection | 33/846 | 212/8465 | 6.49e-03 | 3.22e-02 | 2.37e-02 | 33 |
| hsa0521133 | Breast | DCIS | Renal cell carcinoma | 14/846 | 69/8465 | 7.42e-03 | 3.48e-02 | 2.56e-02 | 14 |
| hsa0412016 | Endometrium | AEH | Ubiquitin mediated proteolysis | 41/1197 | 142/8465 | 3.42e-06 | 4.27e-05 | 3.13e-05 | 41 |
| hsa0406620 | Endometrium | AEH | HIF-1 signaling pathway | 29/1197 | 109/8465 | 4.23e-04 | 3.11e-03 | 2.27e-03 | 29 |
| hsa0517018 | Endometrium | AEH | Human immunodeficiency virus 1 infection | 43/1197 | 212/8465 | 8.19e-03 | 4.22e-02 | 3.09e-02 | 43 |
| hsa0412017 | Endometrium | AEH | Ubiquitin mediated proteolysis | 41/1197 | 142/8465 | 3.42e-06 | 4.27e-05 | 3.13e-05 | 41 |
| hsa04066110 | Endometrium | AEH | HIF-1 signaling pathway | 29/1197 | 109/8465 | 4.23e-04 | 3.11e-03 | 2.27e-03 | 29 |
| hsa0517019 | Endometrium | AEH | Human immunodeficiency virus 1 infection | 43/1197 | 212/8465 | 8.19e-03 | 4.22e-02 | 3.09e-02 | 43 |
| Page: 1 2 3 4 5 |
Top |
Cell-cell communication analysis |
| Identification of potential cell-cell interactions between two cell types and their ligand-receptor pairs for different disease states |
| Ligand | Receptor | LRpair | Pathway | Tissue | Disease Stage |
| Page: 1 |
Top |
Single-cell gene regulatory network inference analysis |
| Find out the significant the regulons (TFs) and the target genes of each regulon across cell types for different disease states |
| TF | Cell Type | Tissue | Disease Stage | Target Gene | RSS | Regulon Activity |
| ∗The dot plots of a searched regulon are shown for all cell subpopulations in each disease state of each tissue based on the regulon specific score inferred using pySCENIC and by calculating the average expression. |
| Page: 1 |
Top |
Somatic mutation of malignant transformation related genes |
| Annotation of somatic variants for genes involved in malignant transformation |
| Hugo Symbol | Variant Class | Variant Classification | dbSNP RS | HGVSc | HGVSp | HGVSp Short | SWISSPROT | BIOTYPE | SIFT | PolyPhen | Tumor Sample Barcode | Tissue | Histology | Sex | Age | Stage | Therapy Types | Drugs | Outcome |
| ELOC | SNV | Missense_Mutation | c.200N>T | p.Ser67Leu | p.S67L | Q15369 | protein_coding | deleterious(0.01) | benign(0.061) | TCGA-AR-A256-01 | Breast | breast invasive carcinoma | Female | <65 | I/II | Chemotherapy | doxorubicin | PD | |
| ELOC | SNV | Missense_Mutation | c.122N>T | p.Thr41Met | p.T41M | Q15369 | protein_coding | tolerated(0.05) | possibly_damaging(0.604) | TCGA-AD-5900-01 | Colorectum | colon adenocarcinoma | Male | >=65 | I/II | Unknown | Unknown | SD | |
| ELOC | insertion | In_Frame_Ins | novel | c.192_193insTTCAACTGC | p.Glu64_Ile65insPheAsnCys | p.E64_I65insFNC | Q15369 | protein_coding | TCGA-F4-6703-01 | Colorectum | colon adenocarcinoma | Male | <65 | I/II | Unknown | Unknown | SD | ||
| ELOC | SNV | Missense_Mutation | novel | c.212C>T | p.Ser71Leu | p.S71L | Q15369 | protein_coding | tolerated(0.25) | benign(0.003) | TCGA-A5-A2K5-01 | Endometrium | uterine corpus endometrioid carcinoma | Female | >=65 | I/II | Unknown | Unknown | SD |
| ELOC | SNV | Missense_Mutation | novel | c.158N>A | p.Ala53Asp | p.A53D | Q15369 | protein_coding | deleterious(0.02) | benign(0.367) | TCGA-AJ-A3EK-01 | Endometrium | uterine corpus endometrioid carcinoma | Female | <65 | I/II | Chemotherapy | carboplatin | CR |
| ELOC | SNV | Missense_Mutation | c.256A>G | p.Ser86Gly | p.S86G | Q15369 | protein_coding | deleterious(0.01) | benign(0.284) | TCGA-AP-A05N-01 | Endometrium | uterine corpus endometrioid carcinoma | Female | <65 | I/II | Unknown | Unknown | SD | |
| ELOC | SNV | Missense_Mutation | c.122N>T | p.Thr41Met | p.T41M | Q15369 | protein_coding | tolerated(0.05) | possibly_damaging(0.604) | TCGA-B5-A11E-01 | Endometrium | uterine corpus endometrioid carcinoma | Female | <65 | I/II | Unknown | Unknown | SD | |
| ELOC | SNV | Missense_Mutation | novel | c.272N>A | p.Pro91His | p.P91H | Q15369 | protein_coding | deleterious(0) | possibly_damaging(0.481) | TCGA-B5-A1MX-01 | Endometrium | uterine corpus endometrioid carcinoma | Female | <65 | I/II | Hormone Therapy | megace | SD |
| ELOC | SNV | Missense_Mutation | rs762993549 | c.233N>T | p.Thr78Met | p.T78M | Q15369 | protein_coding | tolerated(0.18) | benign(0.067) | TCGA-EO-A22R-01 | Endometrium | uterine corpus endometrioid carcinoma | Female | <65 | I/II | Unknown | Unknown | SD |
| ELOC | SNV | Missense_Mutation | novel | c.158C>T | p.Ala53Val | p.A53V | Q15369 | protein_coding | tolerated(0.08) | benign(0.056) | TCGA-EO-A22U-01 | Endometrium | uterine corpus endometrioid carcinoma | Female | >=65 | I/II | Unknown | Unknown | SD |
| Page: 1 2 |
Top |
Related drugs of malignant transformation related genes |
| Identification of chemicals and drugs interact with genes involved in malignant transfromation |
| (DGIdb 4.0) |
| Entrez ID | Symbol | Category | Interaction Types | Drug Claim Name | Drug Name | PMIDs |
| Page: 1 |

Copyright 2023-Present -The University of Texas Health Science Center at Houston |