
|
|||||
|
 | |
| |
| |
| |
| |
| |
|
Gene: ELOB |
Gene summary for ELOB |
| Gene information | Species | Human | Gene symbol | ELOB | Gene ID | 6923 |
| Gene name | elongin B | |
| Gene Alias | SIII | |
| Cytomap | 16p13.3 | |
| Gene Type | protein-coding | GO ID | GO:0006139 | UniProtAcc | Q15370 |
Top |
Malignant transformation analysis |
| Identification of the aberrant gene expression in precancerous and cancerous lesions by comparing the gene expression of stem-like cells in diseased tissues with normal stem cells |
| Entrez ID | Symbol | Replicates | Species | Organ | Tissue | Adj P-value | Log2FC | Malignancy |
| 6923 | ELOB | GSM4909281 | Human | Breast | IDC | 3.09e-17 | 5.13e-01 | 0.21 |
| 6923 | ELOB | GSM4909282 | Human | Breast | IDC | 2.46e-41 | 6.97e-01 | -0.0288 |
| 6923 | ELOB | GSM4909285 | Human | Breast | IDC | 1.19e-15 | 4.57e-02 | 0.21 |
| 6923 | ELOB | GSM4909286 | Human | Breast | IDC | 1.38e-19 | 2.26e-01 | 0.1081 |
| 6923 | ELOB | GSM4909287 | Human | Breast | IDC | 1.04e-29 | 7.06e-01 | 0.2057 |
| 6923 | ELOB | GSM4909290 | Human | Breast | IDC | 1.80e-22 | 6.33e-01 | 0.2096 |
| 6923 | ELOB | GSM4909291 | Human | Breast | IDC | 1.96e-23 | 7.14e-01 | 0.1753 |
| 6923 | ELOB | GSM4909293 | Human | Breast | IDC | 7.72e-29 | 5.57e-01 | 0.1581 |
| 6923 | ELOB | GSM4909294 | Human | Breast | IDC | 2.71e-21 | 6.21e-01 | 0.2022 |
| 6923 | ELOB | GSM4909295 | Human | Breast | IDC | 4.53e-09 | 5.60e-01 | 0.0898 |
| 6923 | ELOB | GSM4909296 | Human | Breast | IDC | 2.05e-22 | 6.13e-01 | 0.1524 |
| 6923 | ELOB | GSM4909297 | Human | Breast | IDC | 1.84e-09 | 1.93e-01 | 0.1517 |
| 6923 | ELOB | GSM4909298 | Human | Breast | IDC | 8.34e-45 | 7.61e-01 | 0.1551 |
| 6923 | ELOB | GSM4909299 | Human | Breast | IDC | 2.03e-10 | 3.19e-01 | 0.035 |
| 6923 | ELOB | GSM4909300 | Human | Breast | IDC | 2.17e-04 | 2.82e-01 | 0.0334 |
| 6923 | ELOB | GSM4909301 | Human | Breast | IDC | 1.87e-97 | 1.03e+00 | 0.1577 |
| 6923 | ELOB | GSM4909302 | Human | Breast | IDC | 1.87e-08 | 4.24e-01 | 0.1545 |
| 6923 | ELOB | GSM4909303 | Human | Breast | IDC | 1.41e-04 | 4.99e-01 | 0.0438 |
| 6923 | ELOB | GSM4909304 | Human | Breast | IDC | 6.07e-75 | 9.14e-01 | 0.1636 |
| 6923 | ELOB | GSM4909305 | Human | Breast | IDC | 5.79e-20 | 4.18e-01 | 0.0436 |
| Page: 1 2 3 4 5 6 7 8 9 10 11 12 13 |
| Tissue | Expression Dynamics | Abbreviation |
| Breast |  | IDC: Invasive ductal carcinoma |
| DCIS: Ductal carcinoma in situ | ||
| Precancer(BRCA1-mut): Precancerous lesion from BRCA1 mutation carriers | ||
| Cervix |  | CC: Cervix cancer |
| HSIL_HPV: HPV-infected high-grade squamous intraepithelial lesions | ||
| N_HPV: HPV-infected normal cervix | ||
| Colorectum (GSE201348) |  | FAP: Familial adenomatous polyposis |
| CRC: Colorectal cancer | ||
| Colorectum (HTA11) |  | AD: Adenomas |
| SER: Sessile serrated lesions | ||
| MSI-H: Microsatellite-high colorectal cancer | ||
| MSS: Microsatellite stable colorectal cancer | ||
| Endometrium | 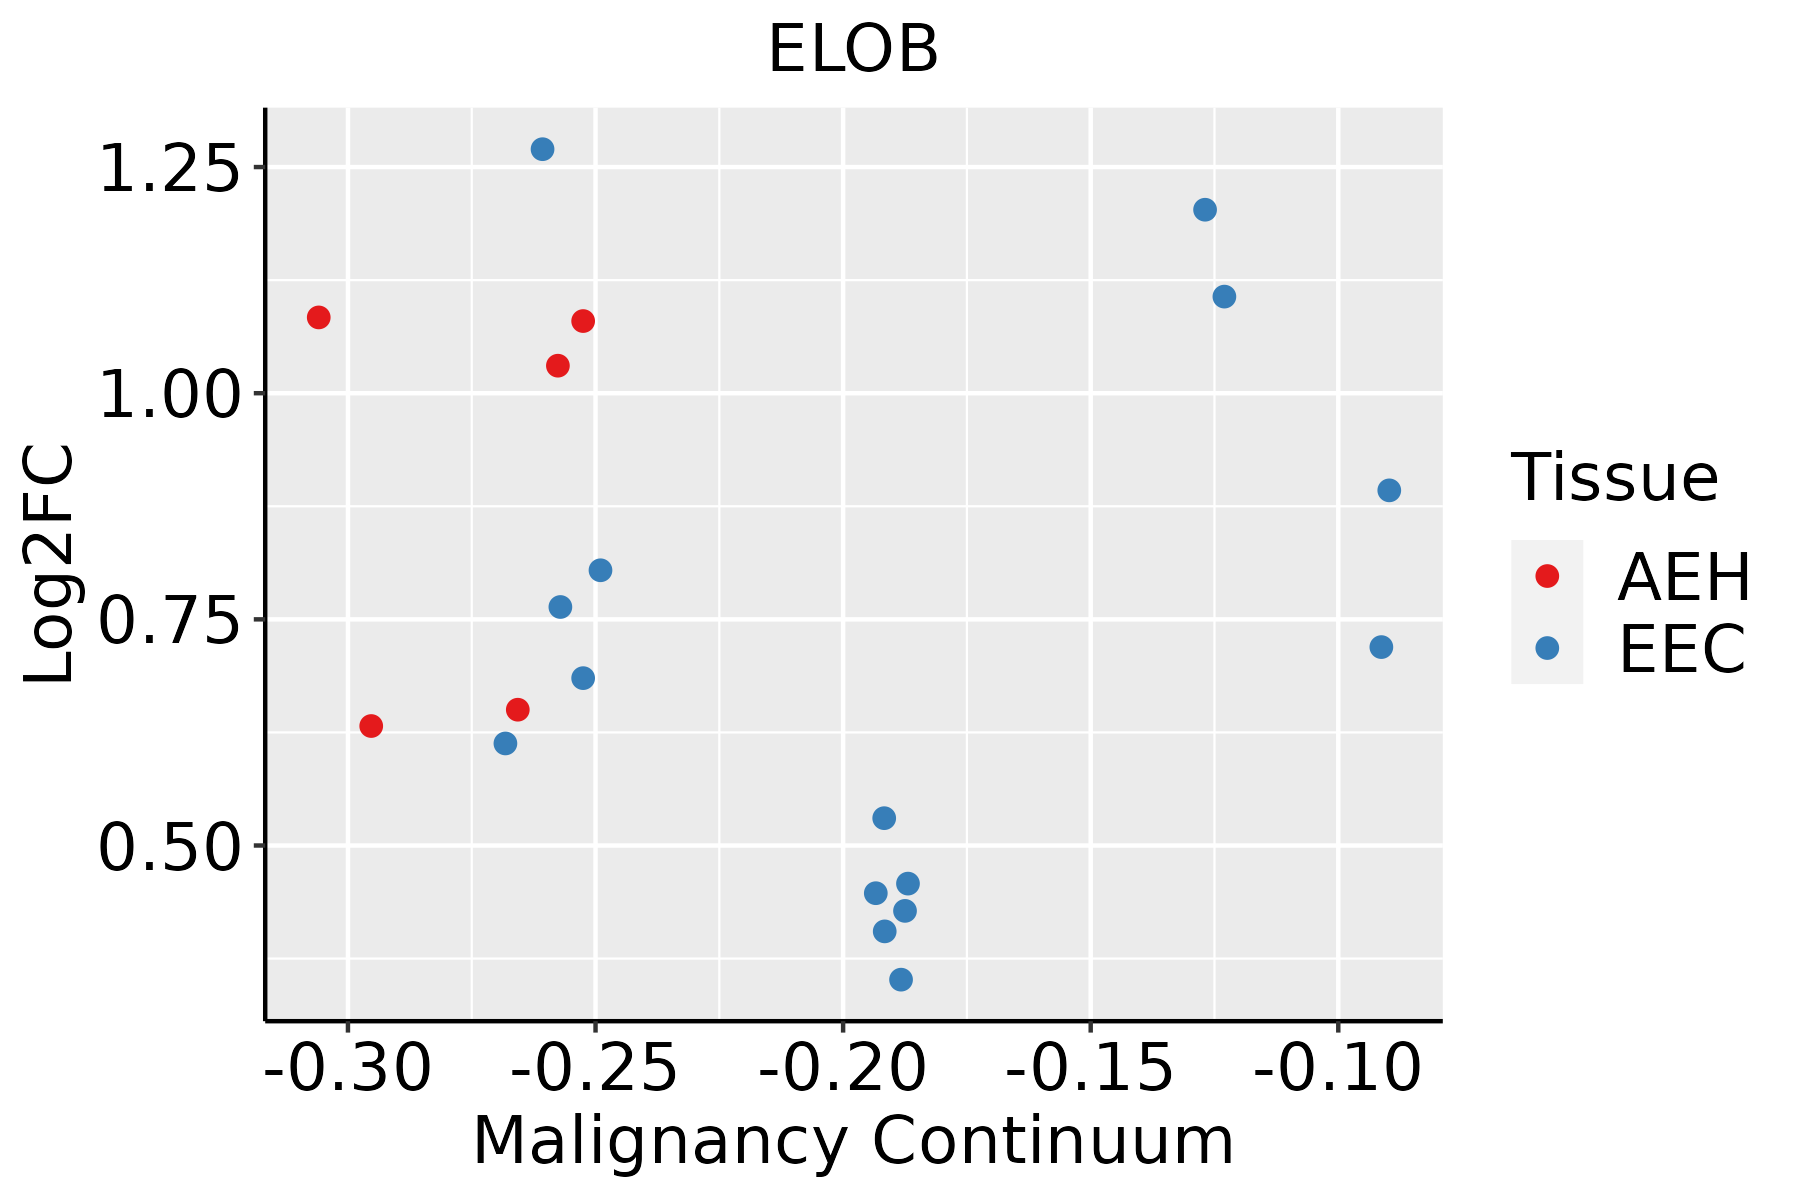 | AEH: Atypical endometrial hyperplasia |
| EEC: Endometrioid Cancer | ||
| Esophagus | 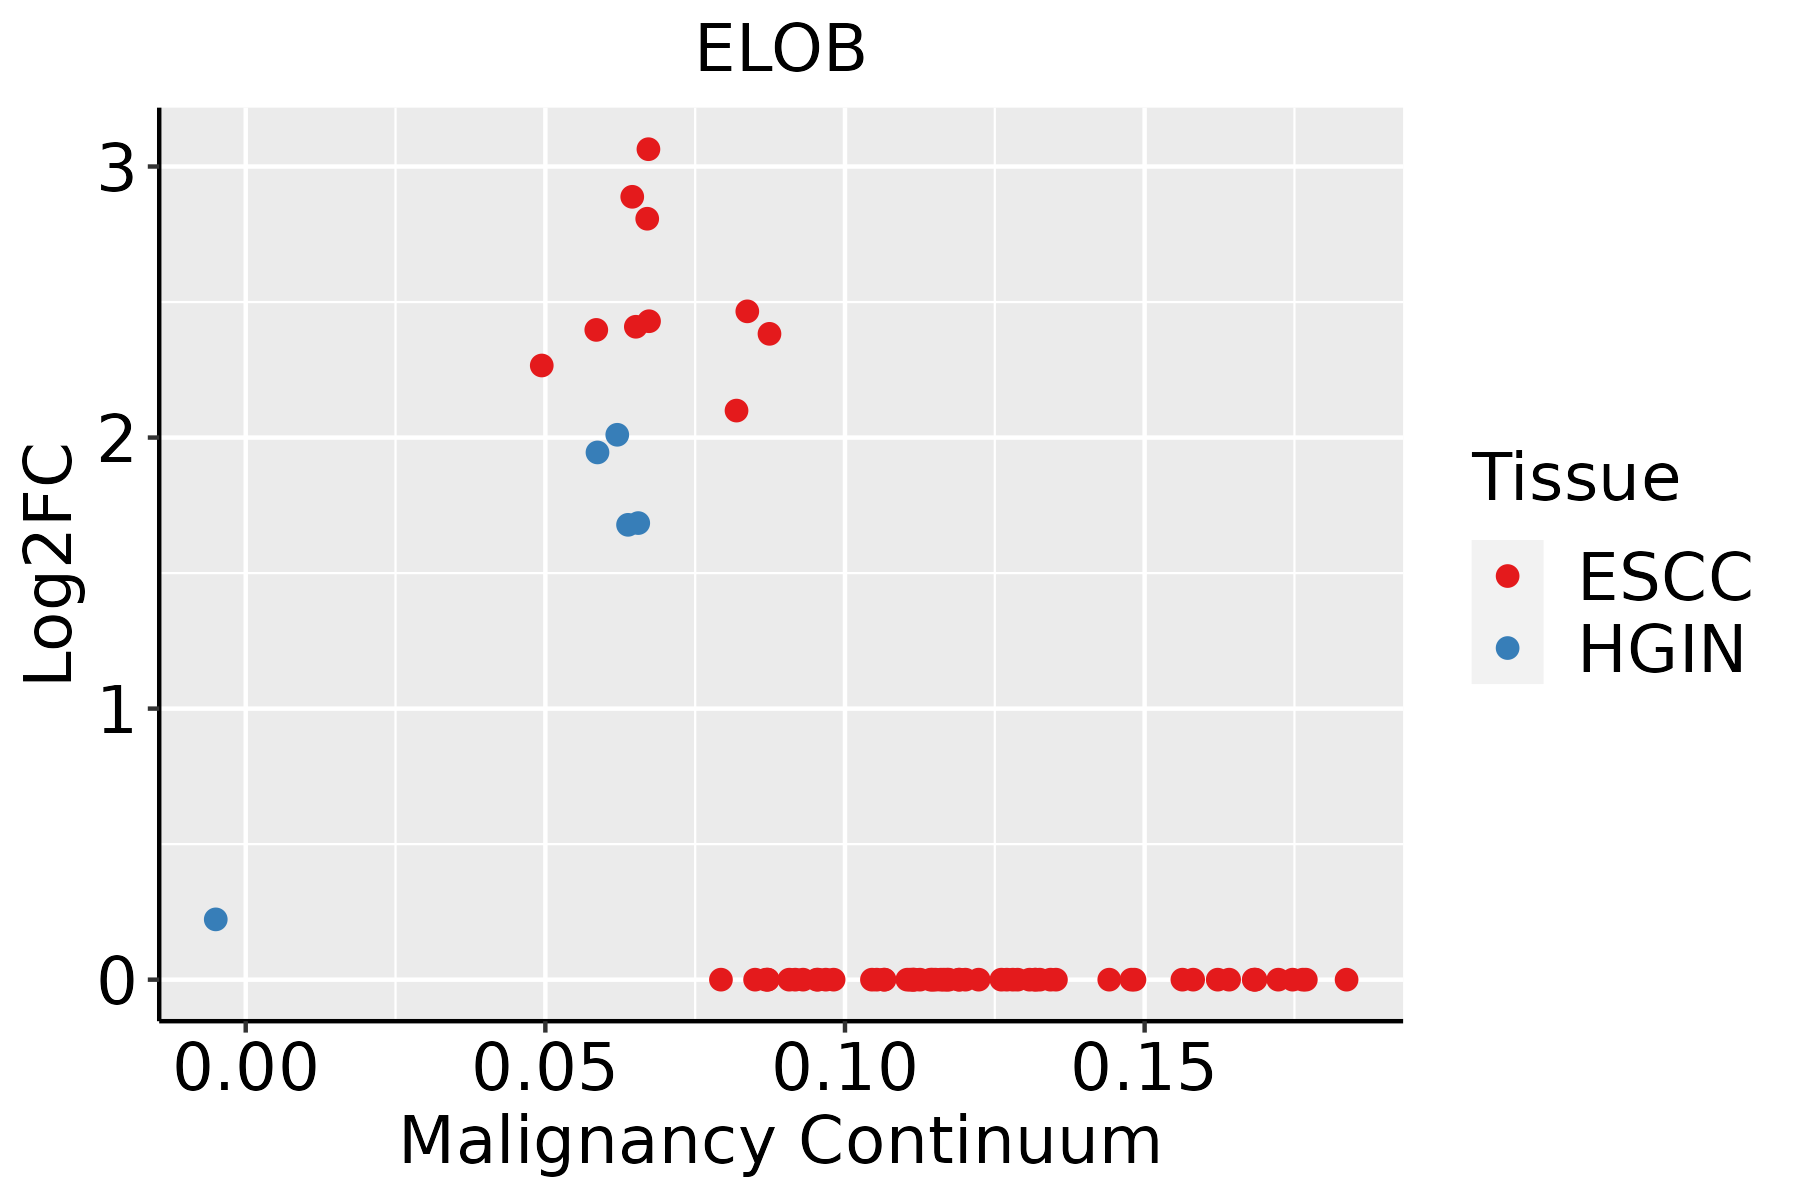 | ESCC: Esophageal squamous cell carcinoma |
| HGIN: High-grade intraepithelial neoplasias | ||
| LGIN: Low-grade intraepithelial neoplasias | ||
| GC | 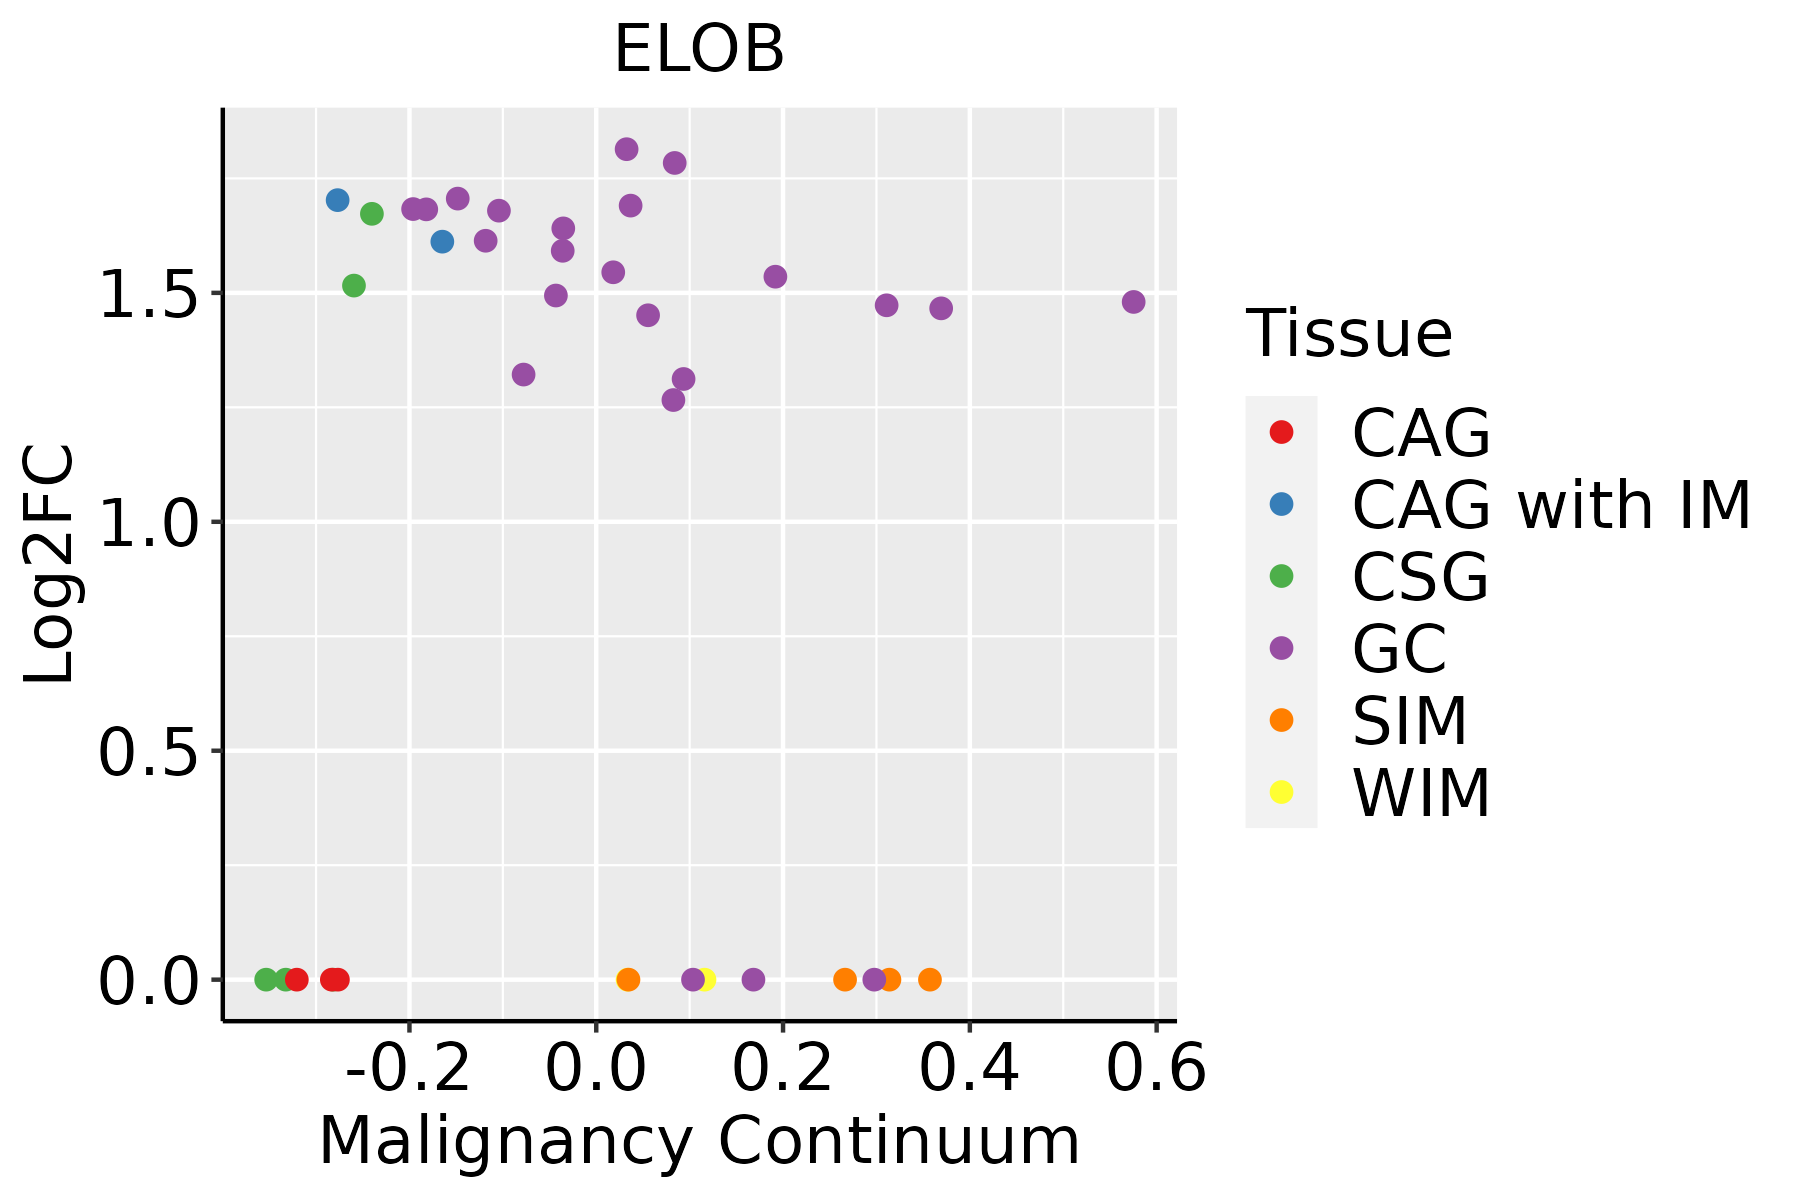 | CAG: Chronic atrophic gastritis |
| CAG with IM: Chronic atrophic gastritis with intestinal metaplasia | ||
| CSG: Chronic superficial gastritis | ||
| GC: Gastric cancer | ||
| SIM: Severe intestinal metaplasia | ||
| WIM: Wild intestinal metaplasia | ||
| Liver | 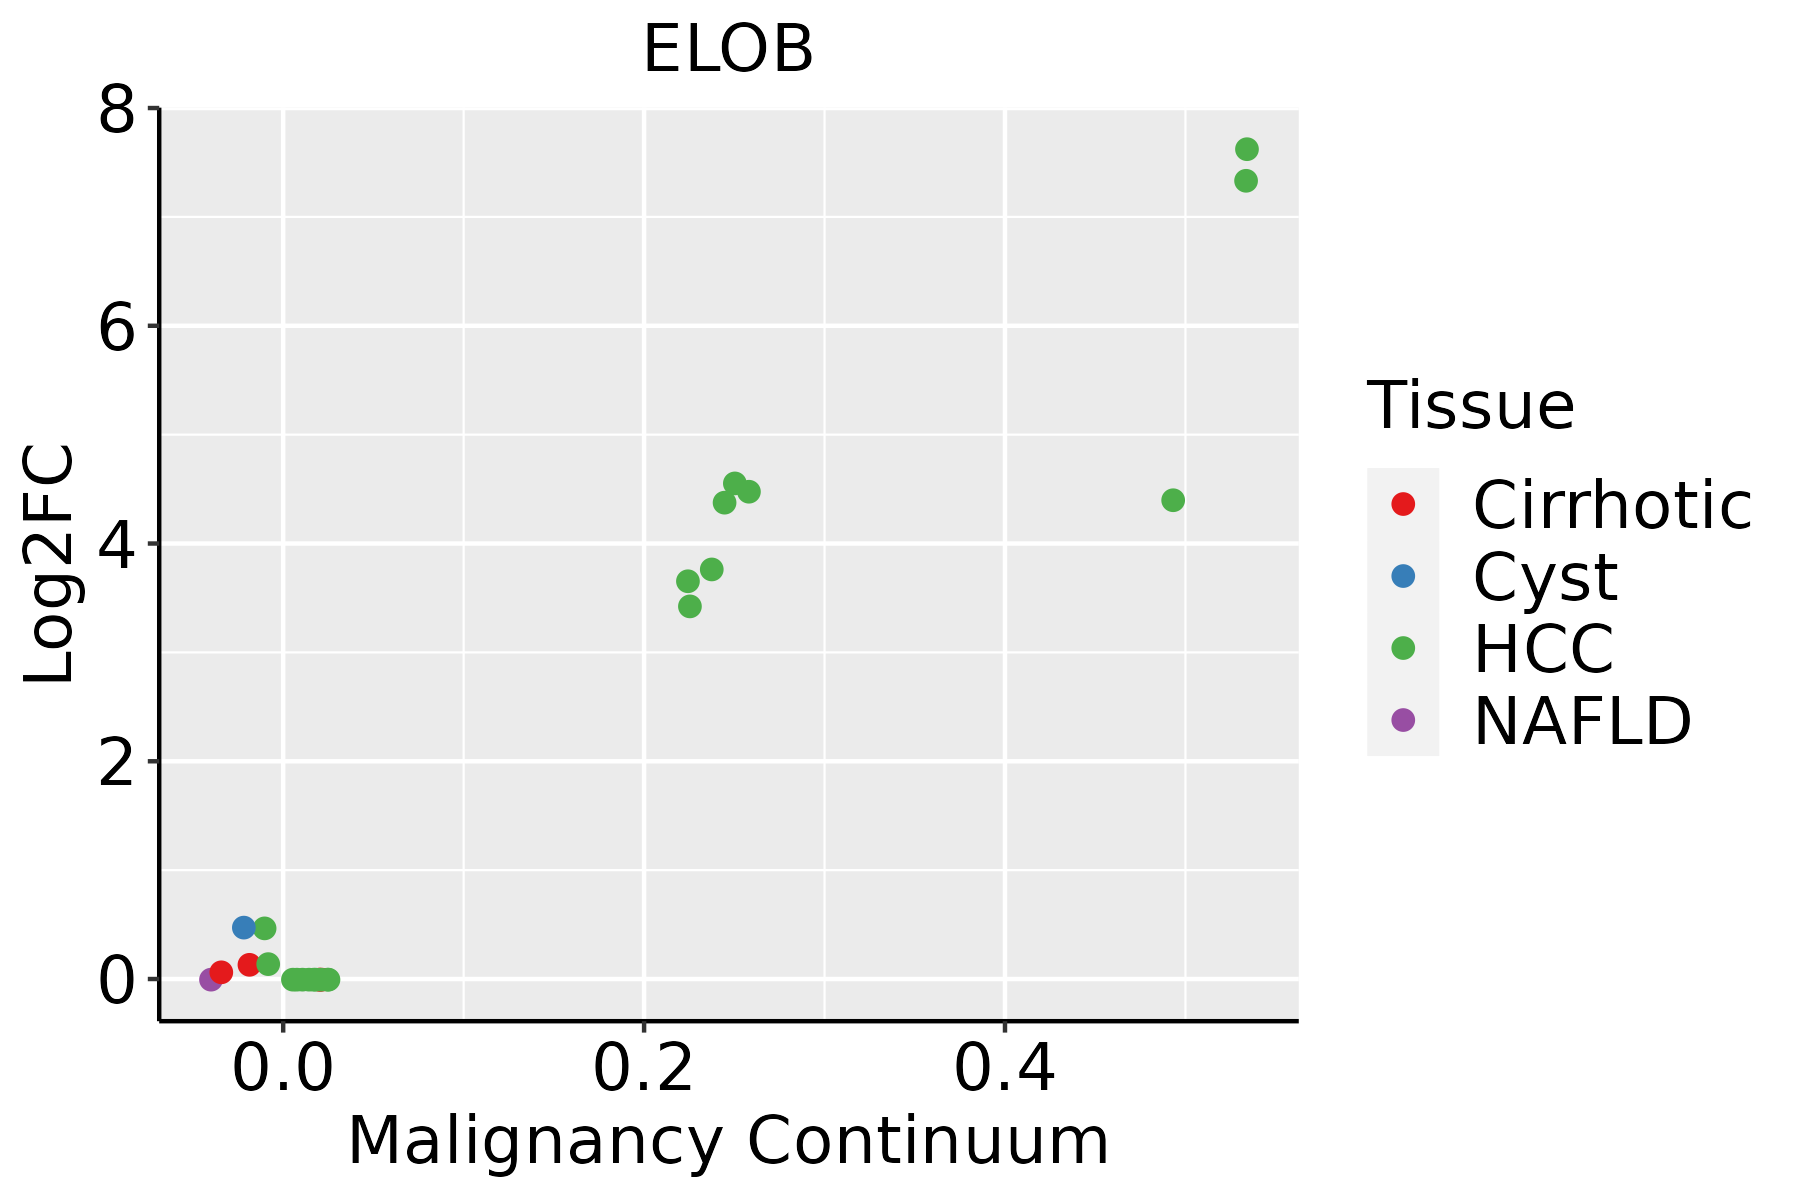 | HCC: Hepatocellular carcinoma |
| NAFLD: Non-alcoholic fatty liver disease | ||
| Lung | 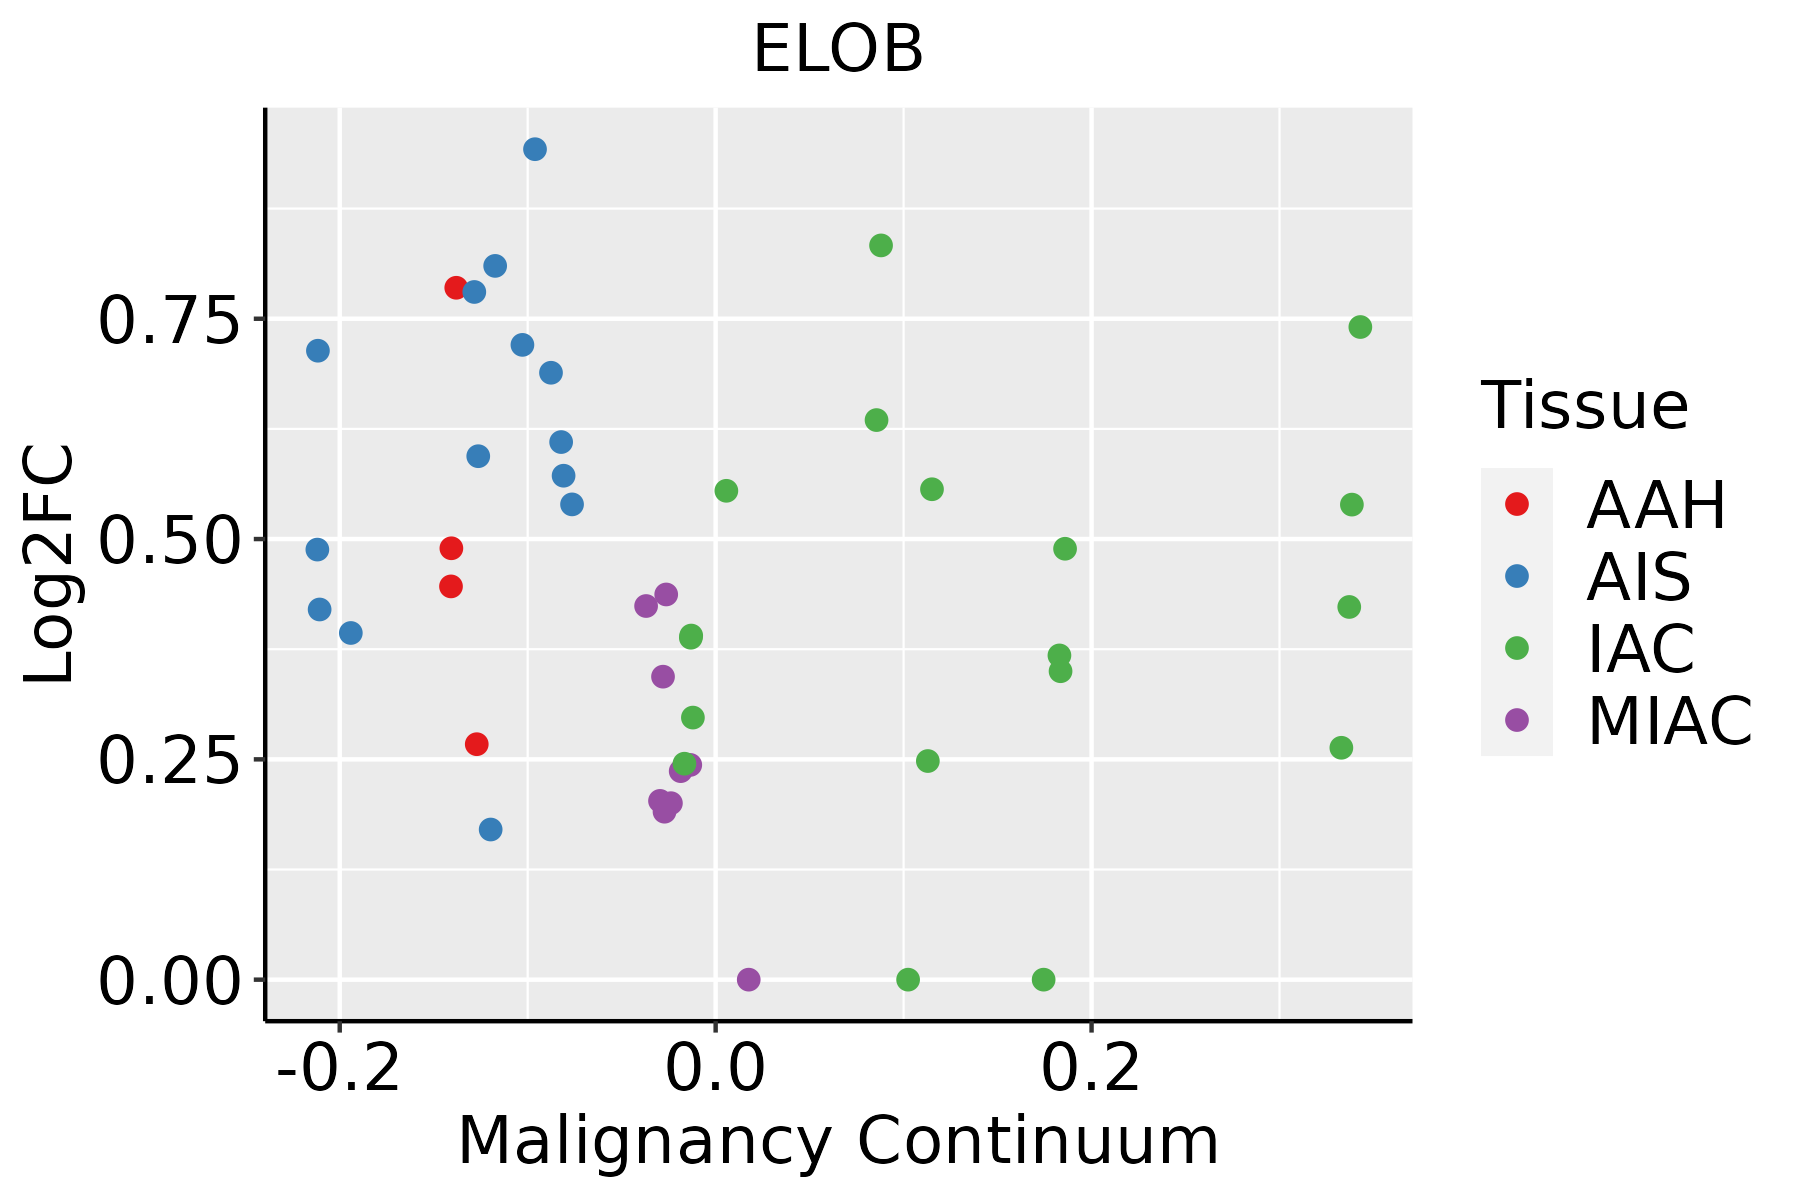 | AAH: Atypical adenomatous hyperplasia |
| AIS: Adenocarcinoma in situ | ||
| IAC: Invasive lung adenocarcinoma | ||
| MIA: Minimally invasive adenocarcinoma | ||
| Prostate |  | BPH: Benign Prostatic Hyperplasia |
| Skin | 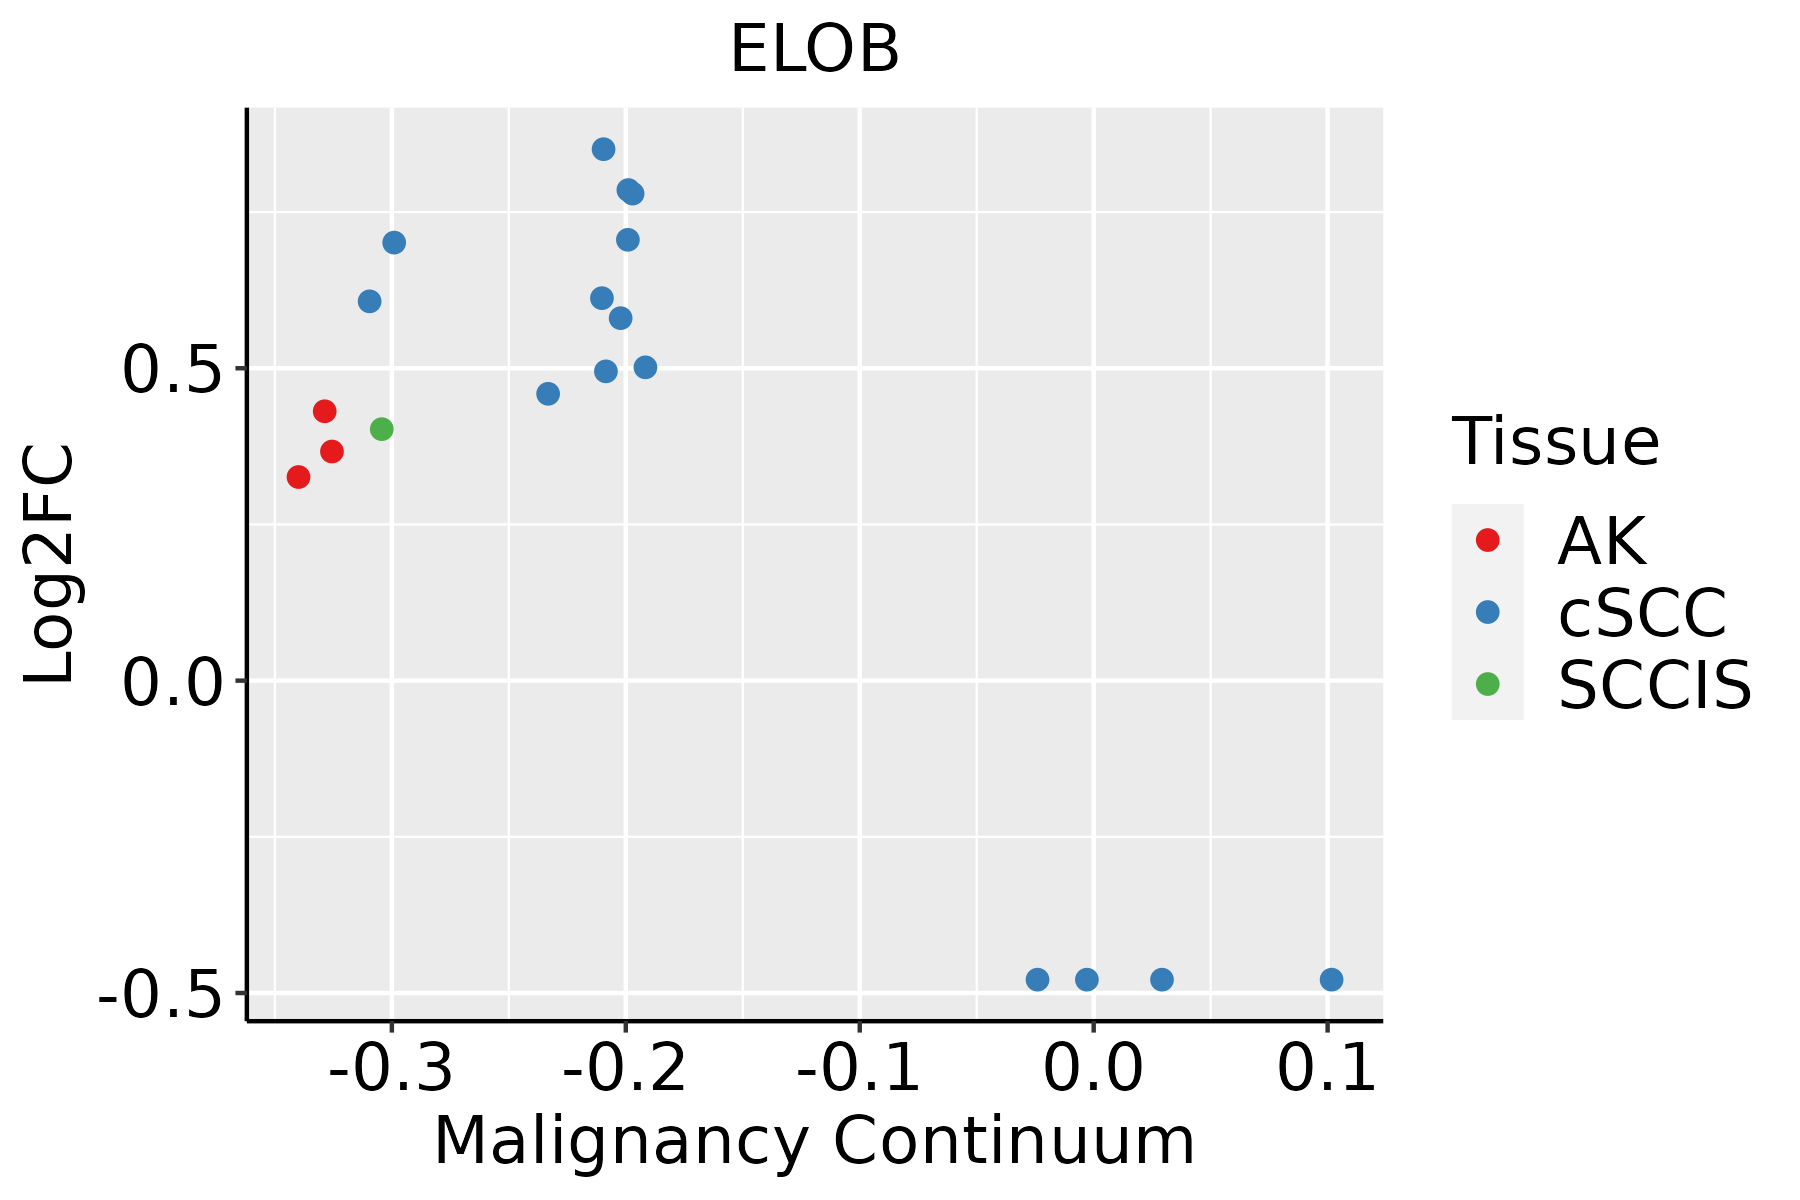 | AK: Actinic keratosis |
| cSCC: Cutaneous squamous cell carcinoma | ||
| SCCIS:squamous cell carcinoma in situ | ||
| Thyroid | 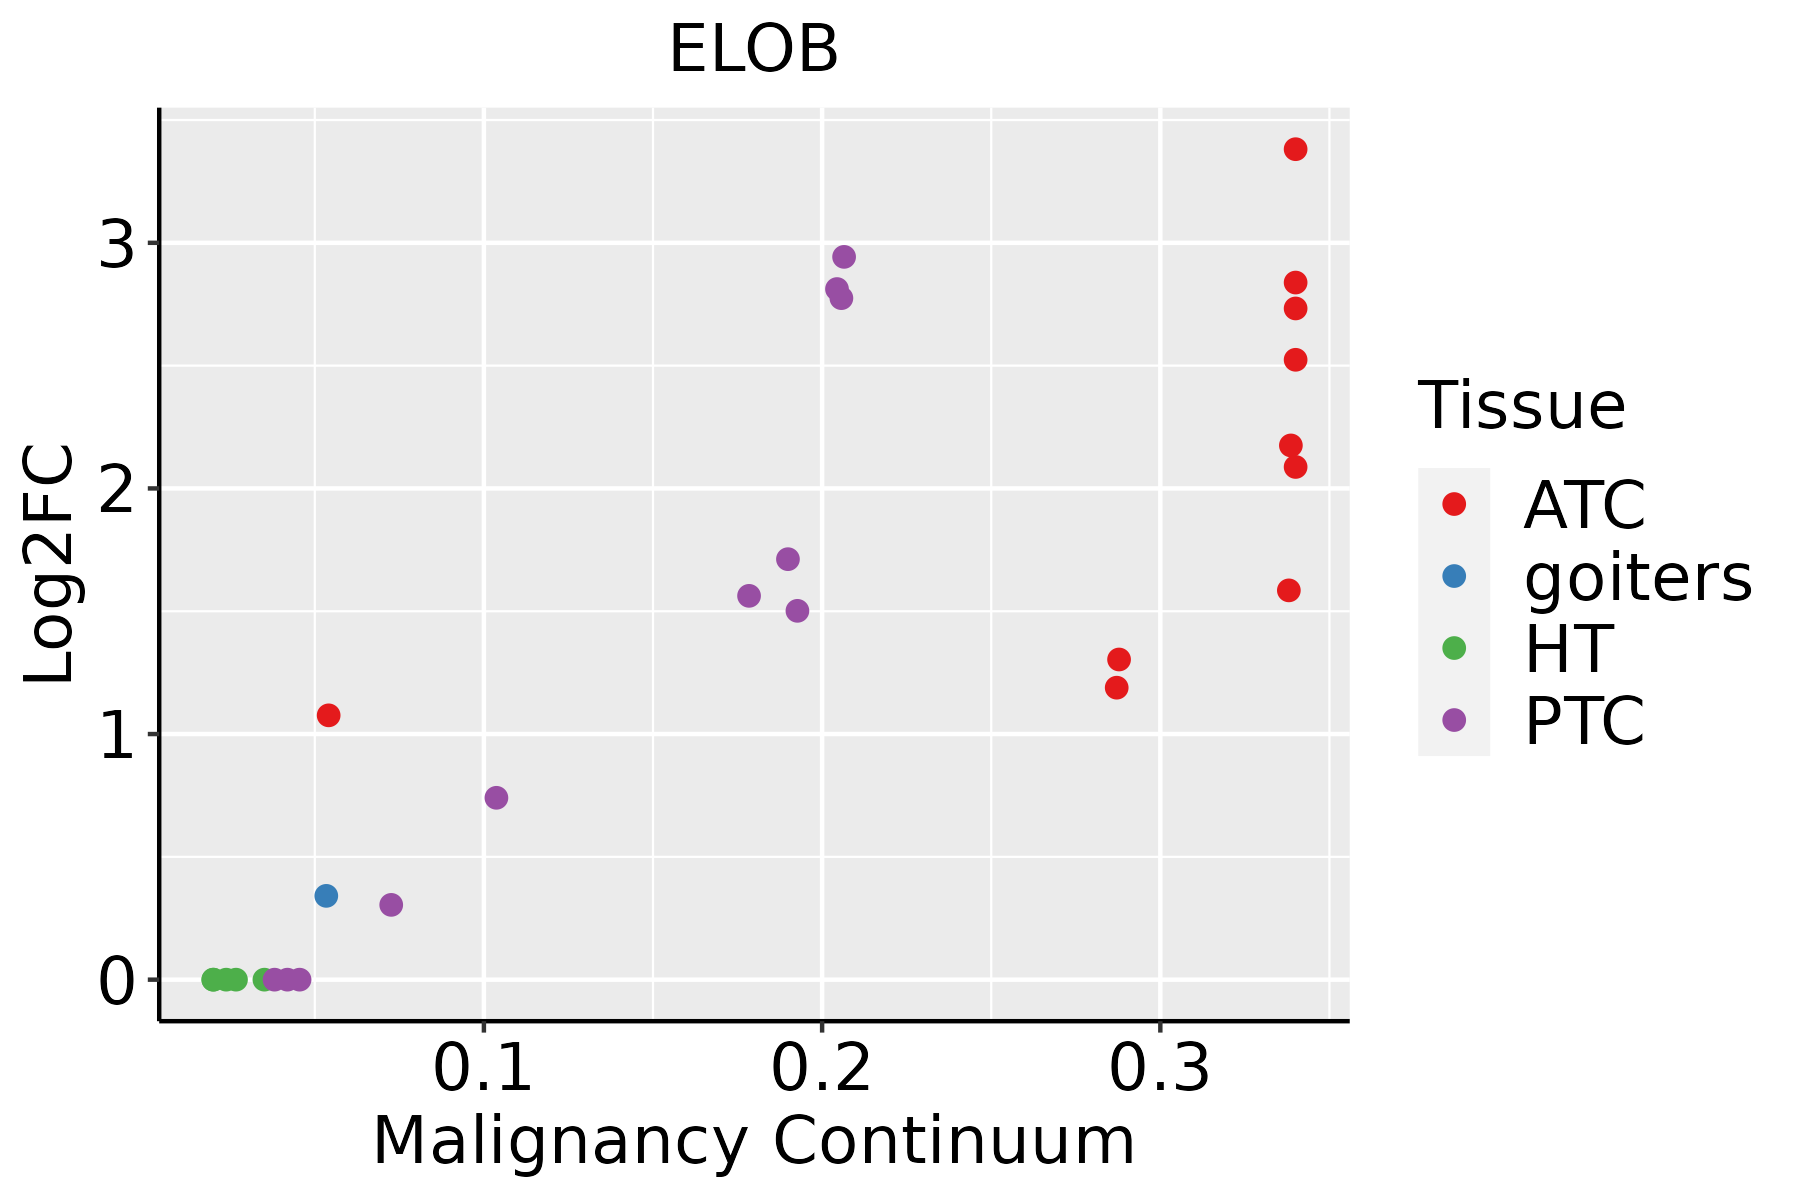 | ATC: Anaplastic thyroid cancer |
| HT: Hashimoto's thyroiditis | ||
| PTC: Papillary thyroid cancer |
| ∗log2FC in expression of this searched gene in stem-like cells from each diseased tissue sample relative to stem-like cells in normal samples in each tissue plotted against the malignancy continuum. Samples are colored based on if they are from different disease stage. |
Top |
Malignant transformation related pathway analysis |
| Find out the enriched GO biological processes and KEGG pathways involved in transition from healthy to precancer to cancer |
| Tissue | Disease Stage | Enriched GO biological Processes |
| Colorectum | AD |  |
| Colorectum | SER |  |
| Colorectum | MSS |  |
| Colorectum | MSI-H |  |
| Colorectum | FAP |  |
| ∗Top 15 enriched GO BP terms are showed in the bar plot of each disease state in each tissue. Each row represents a significant GO biological process which is colored according to the -log10(p.adjust). |
| Page: 1 2 3 4 5 6 7 8 9 |
| GO ID | Tissue | Disease Stage | Description | Gene Ratio | Bg Ratio | pvalue | p.adjust | Count |
| GO:00458629 | Breast | Precancer | positive regulation of proteolysis | 51/1080 | 372/18723 | 7.77e-09 | 5.70e-07 | 51 |
| GO:00104989 | Breast | Precancer | proteasomal protein catabolic process | 58/1080 | 490/18723 | 1.54e-07 | 8.05e-06 | 58 |
| GO:19033629 | Breast | Precancer | regulation of cellular protein catabolic process | 36/1080 | 255/18723 | 6.03e-07 | 2.55e-05 | 36 |
| GO:00421769 | Breast | Precancer | regulation of protein catabolic process | 47/1080 | 391/18723 | 1.50e-06 | 5.58e-05 | 47 |
| GO:19030509 | Breast | Precancer | regulation of proteolysis involved in cellular protein catabolic process | 31/1080 | 221/18723 | 4.10e-06 | 1.27e-04 | 31 |
| GO:00611369 | Breast | Precancer | regulation of proteasomal protein catabolic process | 24/1080 | 187/18723 | 1.99e-04 | 3.14e-03 | 24 |
| GO:00431619 | Breast | Precancer | proteasome-mediated ubiquitin-dependent protein catabolic process | 42/1080 | 412/18723 | 2.49e-04 | 3.72e-03 | 42 |
| GO:00098969 | Breast | Precancer | positive regulation of catabolic process | 48/1080 | 492/18723 | 2.62e-04 | 3.84e-03 | 48 |
| GO:00313319 | Breast | Precancer | positive regulation of cellular catabolic process | 43/1080 | 427/18723 | 2.75e-04 | 4.00e-03 | 43 |
| GO:20000589 | Breast | Precancer | regulation of ubiquitin-dependent protein catabolic process | 21/1080 | 164/18723 | 5.00e-04 | 6.53e-03 | 21 |
| GO:19033649 | Breast | Precancer | positive regulation of cellular protein catabolic process | 20/1080 | 155/18723 | 6.10e-04 | 7.67e-03 | 20 |
| GO:19030527 | Breast | Precancer | positive regulation of proteolysis involved in cellular protein catabolic process | 17/1080 | 133/18723 | 1.68e-03 | 1.70e-02 | 17 |
| GO:00457329 | Breast | Precancer | positive regulation of protein catabolic process | 25/1080 | 231/18723 | 1.87e-03 | 1.82e-02 | 25 |
| GO:19018007 | Breast | Precancer | positive regulation of proteasomal protein catabolic process | 15/1080 | 114/18723 | 2.31e-03 | 2.15e-02 | 15 |
| GO:00324349 | Breast | Precancer | regulation of proteasomal ubiquitin-dependent protein catabolic process | 16/1080 | 134/18723 | 4.51e-03 | 3.50e-02 | 16 |
| GO:004586214 | Breast | IDC | positive regulation of proteolysis | 66/1434 | 372/18723 | 9.76e-11 | 1.29e-08 | 66 |
| GO:001049814 | Breast | IDC | proteasomal protein catabolic process | 75/1434 | 490/18723 | 5.59e-09 | 4.41e-07 | 75 |
| GO:004217614 | Breast | IDC | regulation of protein catabolic process | 63/1434 | 391/18723 | 1.32e-08 | 9.61e-07 | 63 |
| GO:190336214 | Breast | IDC | regulation of cellular protein catabolic process | 46/1434 | 255/18723 | 4.00e-08 | 2.68e-06 | 46 |
| GO:190305014 | Breast | IDC | regulation of proteolysis involved in cellular protein catabolic process | 41/1434 | 221/18723 | 9.77e-08 | 5.84e-06 | 41 |
| Page: 1 2 3 4 5 6 7 8 9 10 11 12 13 14 15 16 17 18 19 20 21 22 |
| Pathway ID | Tissue | Disease Stage | Description | Gene Ratio | Bg Ratio | pvalue | p.adjust | qvalue | Count |
| hsa0406616 | Breast | Precancer | HIF-1 signaling pathway | 23/684 | 109/8465 | 1.51e-05 | 1.59e-04 | 1.22e-04 | 23 |
| hsa0406617 | Breast | Precancer | HIF-1 signaling pathway | 23/684 | 109/8465 | 1.51e-05 | 1.59e-04 | 1.22e-04 | 23 |
| hsa0406623 | Breast | IDC | HIF-1 signaling pathway | 22/867 | 109/8465 | 1.36e-03 | 1.00e-02 | 7.50e-03 | 22 |
| hsa0517014 | Breast | IDC | Human immunodeficiency virus 1 infection | 33/867 | 212/8465 | 9.28e-03 | 4.37e-02 | 3.27e-02 | 33 |
| hsa0406633 | Breast | IDC | HIF-1 signaling pathway | 22/867 | 109/8465 | 1.36e-03 | 1.00e-02 | 7.50e-03 | 22 |
| hsa0517015 | Breast | IDC | Human immunodeficiency virus 1 infection | 33/867 | 212/8465 | 9.28e-03 | 4.37e-02 | 3.27e-02 | 33 |
| hsa0406642 | Breast | DCIS | HIF-1 signaling pathway | 22/846 | 109/8465 | 9.83e-04 | 7.05e-03 | 5.20e-03 | 22 |
| hsa0517024 | Breast | DCIS | Human immunodeficiency virus 1 infection | 33/846 | 212/8465 | 6.49e-03 | 3.22e-02 | 2.37e-02 | 33 |
| hsa0521123 | Breast | DCIS | Renal cell carcinoma | 14/846 | 69/8465 | 7.42e-03 | 3.48e-02 | 2.56e-02 | 14 |
| hsa0406652 | Breast | DCIS | HIF-1 signaling pathway | 22/846 | 109/8465 | 9.83e-04 | 7.05e-03 | 5.20e-03 | 22 |
| hsa0517034 | Breast | DCIS | Human immunodeficiency virus 1 infection | 33/846 | 212/8465 | 6.49e-03 | 3.22e-02 | 2.37e-02 | 33 |
| hsa0521133 | Breast | DCIS | Renal cell carcinoma | 14/846 | 69/8465 | 7.42e-03 | 3.48e-02 | 2.56e-02 | 14 |
| hsa0412014 | Cervix | CC | Ubiquitin mediated proteolysis | 49/1267 | 142/8465 | 4.26e-09 | 7.68e-08 | 4.54e-08 | 49 |
| hsa0517016 | Cervix | CC | Human immunodeficiency virus 1 infection | 55/1267 | 212/8465 | 1.80e-05 | 1.42e-04 | 8.40e-05 | 55 |
| hsa052119 | Cervix | CC | Renal cell carcinoma | 20/1267 | 69/8465 | 2.07e-03 | 8.17e-03 | 4.83e-03 | 20 |
| hsa0406618 | Cervix | CC | HIF-1 signaling pathway | 27/1267 | 109/8465 | 4.72e-03 | 1.64e-02 | 9.72e-03 | 27 |
| hsa0412015 | Cervix | CC | Ubiquitin mediated proteolysis | 49/1267 | 142/8465 | 4.26e-09 | 7.68e-08 | 4.54e-08 | 49 |
| hsa0517017 | Cervix | CC | Human immunodeficiency virus 1 infection | 55/1267 | 212/8465 | 1.80e-05 | 1.42e-04 | 8.40e-05 | 55 |
| hsa0521114 | Cervix | CC | Renal cell carcinoma | 20/1267 | 69/8465 | 2.07e-03 | 8.17e-03 | 4.83e-03 | 20 |
| hsa0406619 | Cervix | CC | HIF-1 signaling pathway | 27/1267 | 109/8465 | 4.72e-03 | 1.64e-02 | 9.72e-03 | 27 |
| Page: 1 2 3 4 5 6 |
Top |
Cell-cell communication analysis |
| Identification of potential cell-cell interactions between two cell types and their ligand-receptor pairs for different disease states |
| Ligand | Receptor | LRpair | Pathway | Tissue | Disease Stage |
| Page: 1 |
Top |
Single-cell gene regulatory network inference analysis |
| Find out the significant the regulons (TFs) and the target genes of each regulon across cell types for different disease states |
| TF | Cell Type | Tissue | Disease Stage | Target Gene | RSS | Regulon Activity |
| ∗The dot plots of a searched regulon are shown for all cell subpopulations in each disease state of each tissue based on the regulon specific score inferred using pySCENIC and by calculating the average expression. |
| Page: 1 |
Top |
Somatic mutation of malignant transformation related genes |
| Annotation of somatic variants for genes involved in malignant transformation |
| Hugo Symbol | Variant Class | Variant Classification | dbSNP RS | HGVSc | HGVSp | HGVSp Short | SWISSPROT | BIOTYPE | SIFT | PolyPhen | Tumor Sample Barcode | Tissue | Histology | Sex | Age | Stage | Therapy Types | Drugs | Outcome |
| ELOB | SNV | Missense_Mutation | novel | c.94G>C | p.Glu32Gln | p.E32Q | Q15370 | protein_coding | tolerated(0.2) | benign(0.078) | TCGA-D8-A4Z1-01 | Breast | breast invasive carcinoma | Female | >=65 | I/II | Hormone Therapy | tamoxiphen | SD |
| ELOB | SNV | Missense_Mutation | rs776112584 | c.202N>T | p.Arg68Trp | p.R68W | Q15370 | protein_coding | tolerated(0.06) | benign(0.043) | TCGA-A6-5665-01 | Colorectum | colon adenocarcinoma | Female | >=65 | I/II | Unknown | Unknown | PD |
| ELOB | SNV | Missense_Mutation | rs773606482 | c.377N>C | p.Met126Thr | p.M126T | Q15370 | protein_coding | deleterious_low_confidence(0.02) | benign(0) | TCGA-AA-3663-01 | Colorectum | colon adenocarcinoma | Male | <65 | I/II | Unknown | Unknown | SD |
| ELOB | SNV | Missense_Mutation | rs762947231 | c.161G>A | p.Gly54Asp | p.G54D | Q15370 | protein_coding | tolerated(0.31) | benign(0.115) | TCGA-G4-6628-01 | Colorectum | colon adenocarcinoma | Male | >=65 | I/II | Unknown | Unknown | SD |
| ELOB | SNV | Missense_Mutation | c.218C>T | p.Ala73Val | p.A73V | Q15370 | protein_coding | deleterious(0.01) | benign(0.201) | TCGA-NH-A5IV-01 | Colorectum | colon adenocarcinoma | Female | >=65 | I/II | Unknown | Unknown | SD | |
| ELOB | SNV | Missense_Mutation | c.380C>A | p.Ala127Asp | p.A127D | Q15370 | protein_coding | deleterious_low_confidence(0) | benign(0.055) | TCGA-AG-3890-01 | Colorectum | rectum adenocarcinoma | Male | <65 | I/II | Unknown | Unknown | SD | |
| ELOB | SNV | Missense_Mutation | rs533452752 | c.323N>T | p.Ser108Leu | p.S108L | Q15370 | protein_coding | tolerated(0.07) | benign(0.437) | TCGA-2E-A9G8-01 | Endometrium | uterine corpus endometrioid carcinoma | Female | <65 | III/IV | Chemotherapy | taxol | CR |
| ELOB | SNV | Missense_Mutation | novel | c.271G>A | p.Glu91Lys | p.E91K | Q15370 | protein_coding | tolerated(0.14) | benign(0.003) | TCGA-A5-A2K5-01 | Endometrium | uterine corpus endometrioid carcinoma | Female | >=65 | I/II | Unknown | Unknown | SD |
| ELOB | SNV | Missense_Mutation | c.329N>T | p.Ser110Ile | p.S110I | Q15370 | protein_coding | deleterious(0) | benign(0.386) | TCGA-AP-A0LM-01 | Endometrium | uterine corpus endometrioid carcinoma | Female | <65 | III/IV | Chemotherapy | cisplatin | SD | |
| ELOB | SNV | Missense_Mutation | novel | c.170T>C | p.Leu57Pro | p.L57P | Q15370 | protein_coding | deleterious(0) | probably_damaging(1) | TCGA-AP-A1DK-01 | Endometrium | uterine corpus endometrioid carcinoma | Female | <65 | I/II | Unknown | Unknown | SD |
| Page: 1 2 |
Top |
Related drugs of malignant transformation related genes |
| Identification of chemicals and drugs interact with genes involved in malignant transfromation |
| (DGIdb 4.0) |
| Entrez ID | Symbol | Category | Interaction Types | Drug Claim Name | Drug Name | PMIDs |
| Page: 1 |

Copyright 2023-Present -The University of Texas Health Science Center at Houston |