
|
|||||
|
 | |
| |
| |
| |
| |
| |
|
Gene: ELOA |
Gene summary for ELOA |
| Gene information | Species | Human | Gene symbol | ELOA | Gene ID | 6924 |
| Gene name | elongin A | |
| Gene Alias | SIII | |
| Cytomap | 1p36.11 | |
| Gene Type | protein-coding | GO ID | GO:0006139 | UniProtAcc | Q14241 |
Top |
Malignant transformation analysis |
| Identification of the aberrant gene expression in precancerous and cancerous lesions by comparing the gene expression of stem-like cells in diseased tissues with normal stem cells |
| Entrez ID | Symbol | Replicates | Species | Organ | Tissue | Adj P-value | Log2FC | Malignancy |
| 6924 | ELOA | HCC1 | Human | Liver | HCC | 1.16e-09 | 3.30e+00 | 0.5336 |
| 6924 | ELOA | HCC2 | Human | Liver | HCC | 2.99e-26 | 3.57e+00 | 0.5341 |
| 6924 | ELOA | S014 | Human | Liver | HCC | 4.09e-35 | 8.53e-01 | 0.2254 |
| 6924 | ELOA | S015 | Human | Liver | HCC | 1.82e-23 | 9.40e-01 | 0.2375 |
| 6924 | ELOA | S016 | Human | Liver | HCC | 6.09e-34 | 9.57e-01 | 0.2243 |
| 6924 | ELOA | S027 | Human | Liver | HCC | 1.17e-13 | 7.70e-01 | 0.2446 |
| 6924 | ELOA | S028 | Human | Liver | HCC | 3.21e-22 | 8.32e-01 | 0.2503 |
| 6924 | ELOA | S029 | Human | Liver | HCC | 7.98e-23 | 9.38e-01 | 0.2581 |
| 6924 | ELOA | male-WTA | Human | Thyroid | PTC | 6.38e-17 | 2.35e-01 | 0.1037 |
| 6924 | ELOA | PTC01 | Human | Thyroid | PTC | 5.71e-10 | 1.86e-01 | 0.1899 |
| 6924 | ELOA | PTC04 | Human | Thyroid | PTC | 5.95e-07 | 2.30e-01 | 0.1927 |
| 6924 | ELOA | PTC05 | Human | Thyroid | PTC | 1.26e-11 | 3.79e-01 | 0.2065 |
| 6924 | ELOA | PTC06 | Human | Thyroid | PTC | 2.85e-20 | 4.88e-01 | 0.2057 |
| 6924 | ELOA | PTC07 | Human | Thyroid | PTC | 2.11e-25 | 3.91e-01 | 0.2044 |
| 6924 | ELOA | ATC09 | Human | Thyroid | ATC | 6.18e-03 | 1.75e-01 | 0.2871 |
| 6924 | ELOA | ATC11 | Human | Thyroid | ATC | 7.49e-03 | 2.55e-01 | 0.3386 |
| 6924 | ELOA | ATC12 | Human | Thyroid | ATC | 1.90e-14 | 3.11e-01 | 0.34 |
| 6924 | ELOA | ATC13 | Human | Thyroid | ATC | 1.46e-36 | 5.37e-01 | 0.34 |
| 6924 | ELOA | ATC1 | Human | Thyroid | ATC | 2.78e-04 | 2.20e-01 | 0.2878 |
| 6924 | ELOA | ATC3 | Human | Thyroid | ATC | 6.53e-05 | 2.68e-01 | 0.338 |
| Page: 1 2 |
| Tissue | Expression Dynamics | Abbreviation |
| Liver | 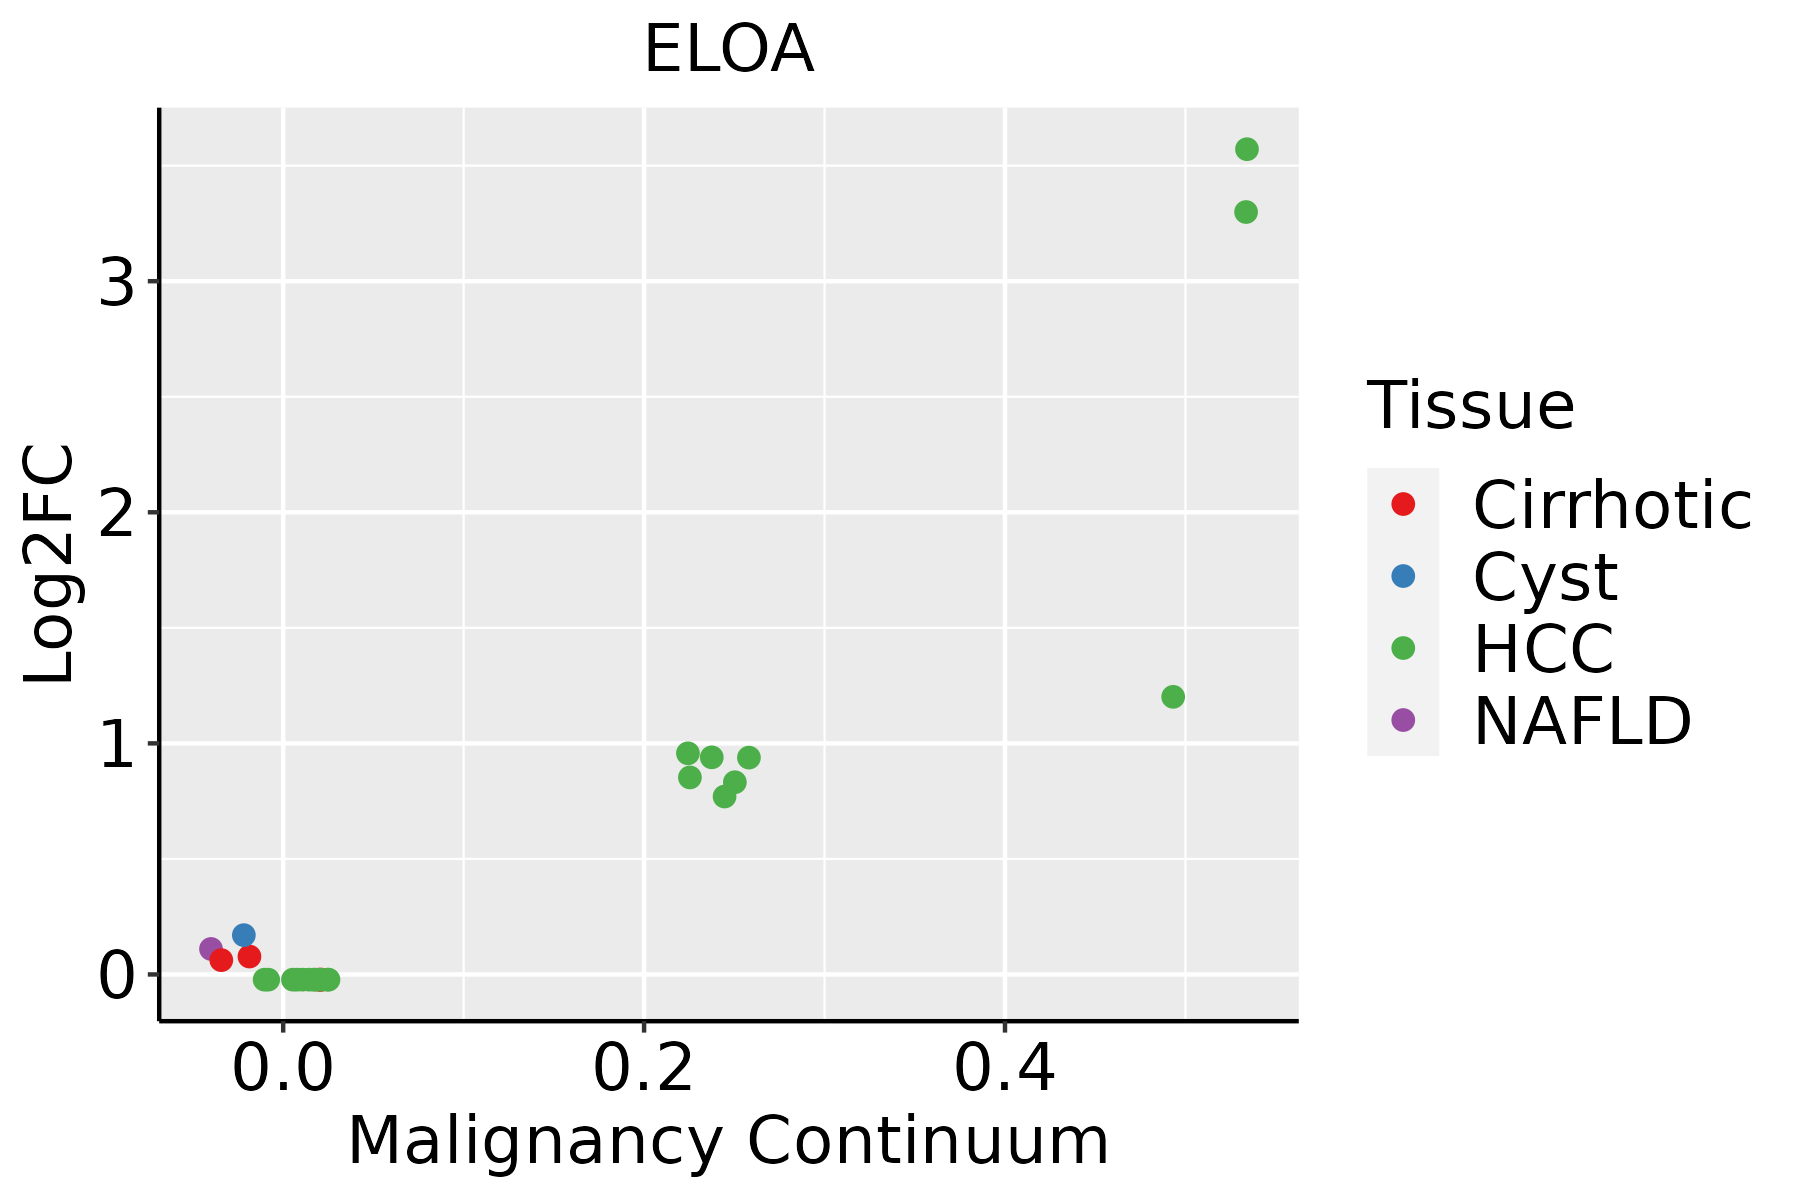 | HCC: Hepatocellular carcinoma |
| NAFLD: Non-alcoholic fatty liver disease | ||
| Thyroid |  | ATC: Anaplastic thyroid cancer |
| HT: Hashimoto's thyroiditis | ||
| PTC: Papillary thyroid cancer |
| ∗log2FC in expression of this searched gene in stem-like cells from each diseased tissue sample relative to stem-like cells in normal samples in each tissue plotted against the malignancy continuum. Samples are colored based on if they are from different disease stage. |
Top |
Malignant transformation related pathway analysis |
| Find out the enriched GO biological processes and KEGG pathways involved in transition from healthy to precancer to cancer |
| Tissue | Disease Stage | Enriched GO biological Processes |
| Colorectum | AD |  |
| Colorectum | SER |  |
| Colorectum | MSS |  |
| Colorectum | MSI-H |  |
| Colorectum | FAP |  |
| ∗Top 15 enriched GO BP terms are showed in the bar plot of each disease state in each tissue. Each row represents a significant GO biological process which is colored according to the -log10(p.adjust). |
| Page: 1 2 3 4 5 6 7 8 9 |
| GO ID | Tissue | Disease Stage | Description | Gene Ratio | Bg Ratio | pvalue | p.adjust | Count |
| GO:000635411 | Liver | HCC | DNA-templated transcription, elongation | 64/7958 | 91/18723 | 7.00e-08 | 1.44e-06 | 64 |
| GO:000636811 | Liver | HCC | transcription elongation from RNA polymerase II promoter | 50/7958 | 69/18723 | 4.32e-07 | 7.22e-06 | 50 |
| GO:000635416 | Thyroid | PTC | DNA-templated transcription, elongation | 62/5968 | 91/18723 | 1.30e-12 | 5.91e-11 | 62 |
| GO:000636816 | Thyroid | PTC | transcription elongation from RNA polymerase II promoter | 48/5968 | 69/18723 | 1.43e-10 | 4.81e-09 | 48 |
| GO:000635421 | Thyroid | ATC | DNA-templated transcription, elongation | 63/6293 | 91/18723 | 3.89e-12 | 1.55e-10 | 63 |
| GO:000636822 | Thyroid | ATC | transcription elongation from RNA polymerase II promoter | 49/6293 | 69/18723 | 2.32e-10 | 6.72e-09 | 49 |
| Page: 1 |
| Pathway ID | Tissue | Disease Stage | Description | Gene Ratio | Bg Ratio | pvalue | p.adjust | qvalue | Count |
| Page: 1 |
Top |
Cell-cell communication analysis |
| Identification of potential cell-cell interactions between two cell types and their ligand-receptor pairs for different disease states |
| Ligand | Receptor | LRpair | Pathway | Tissue | Disease Stage |
| Page: 1 |
Top |
Single-cell gene regulatory network inference analysis |
| Find out the significant the regulons (TFs) and the target genes of each regulon across cell types for different disease states |
| TF | Cell Type | Tissue | Disease Stage | Target Gene | RSS | Regulon Activity |
| ∗The dot plots of a searched regulon are shown for all cell subpopulations in each disease state of each tissue based on the regulon specific score inferred using pySCENIC and by calculating the average expression. |
| Page: 1 |
Top |
Somatic mutation of malignant transformation related genes |
| Annotation of somatic variants for genes involved in malignant transformation |
| Hugo Symbol | Variant Class | Variant Classification | dbSNP RS | HGVSc | HGVSp | HGVSp Short | SWISSPROT | BIOTYPE | SIFT | PolyPhen | Tumor Sample Barcode | Tissue | Histology | Sex | Age | Stage | Therapy Types | Drugs | Outcome |
| ELOA | SNV | Missense_Mutation | c.1996C>T | p.Arg666Trp | p.R666W | Q14241 | protein_coding | deleterious(0.01) | probably_damaging(1) | TCGA-A8-A06O-01 | Breast | breast invasive carcinoma | Female | <65 | I/II | Hormone Therapy | letrozole | SD | |
| ELOA | SNV | Missense_Mutation | c.1166N>G | p.Glu389Gly | p.E389G | Q14241 | protein_coding | tolerated(0.05) | benign(0.003) | TCGA-A8-A09Z-01 | Breast | breast invasive carcinoma | Female | >=65 | I/II | Unknown | Unknown | SD | |
| ELOA | SNV | Missense_Mutation | c.2074N>A | p.Val692Ile | p.V692I | Q14241 | protein_coding | tolerated(0.06) | probably_damaging(0.998) | TCGA-BH-A0HF-01 | Breast | breast invasive carcinoma | Female | >=65 | I/II | Hormone Therapy | arimidex | SD | |
| ELOA | SNV | Missense_Mutation | c.559N>G | p.Met187Val | p.M187V | Q14241 | protein_coding | tolerated(0.49) | benign(0) | TCGA-BH-A0W4-01 | Breast | breast invasive carcinoma | Female | <65 | I/II | Unknown | Unknown | SD | |
| ELOA | insertion | Frame_Shift_Ins | novel | c.1152_1153insC | p.Lys386GlnfsTer8 | p.K386Qfs*8 | Q14241 | protein_coding | TCGA-E2-A156-01 | Breast | breast invasive carcinoma | Female | <65 | I/II | Hormone Therapy | arimidex | SD | ||
| ELOA | SNV | Missense_Mutation | c.1167N>C | p.Glu389Asp | p.E389D | Q14241 | protein_coding | tolerated(0.08) | benign(0.006) | TCGA-C5-A1MJ-01 | Cervix | cervical & endocervical cancer | Female | <65 | I/II | Unknown | Unknown | SD | |
| ELOA | SNV | Missense_Mutation | rs377449904 | c.1364C>T | p.Thr455Met | p.T455M | Q14241 | protein_coding | tolerated(0.08) | benign(0.288) | TCGA-DS-A1OB-01 | Cervix | cervical & endocervical cancer | Female | <65 | I/II | Chemotherapy | carboplatin | PD |
| ELOA | SNV | Missense_Mutation | c.1223G>A | p.Arg408Lys | p.R408K | Q14241 | protein_coding | tolerated(0.72) | benign(0) | TCGA-EK-A2PG-01 | Cervix | cervical & endocervical cancer | Female | >=65 | I/II | Unknown | Unknown | SD | |
| ELOA | deletion | Frame_Shift_Del | novel | c.632_644delNNNNNNNNNNNNN | p.Pro212ThrfsTer50 | p.P212Tfs*50 | Q14241 | protein_coding | TCGA-R2-A69V-01 | Cervix | cervical & endocervical cancer | Female | <65 | I/II | Chemotherapy | cisplatin | SD | ||
| ELOA | SNV | Missense_Mutation | c.1850N>A | p.Arg617His | p.R617H | Q14241 | protein_coding | tolerated(0.07) | probably_damaging(0.978) | TCGA-A6-6780-01 | Colorectum | colon adenocarcinoma | Male | >=65 | I/II | Unknown | Unknown | SD |
| Page: 1 2 3 4 5 6 7 |
Top |
Related drugs of malignant transformation related genes |
| Identification of chemicals and drugs interact with genes involved in malignant transfromation |
| (DGIdb 4.0) |
| Entrez ID | Symbol | Category | Interaction Types | Drug Claim Name | Drug Name | PMIDs |
| Page: 1 |

Copyright 2023-Present -The University of Texas Health Science Center at Houston |