
|
|||||
|
 | |
| |
| |
| |
| |
| |
|
Gene: ELMOD2 |
Gene summary for ELMOD2 |
| Gene information | Species | Human | Gene symbol | ELMOD2 | Gene ID | 255520 |
| Gene name | ELMO domain containing 2 | |
| Gene Alias | 9830169G11Rik | |
| Cytomap | 4q31.1 | |
| Gene Type | protein-coding | GO ID | GO:0002376 | UniProtAcc | Q8IZ81 |
Top |
Malignant transformation analysis |
| Identification of the aberrant gene expression in precancerous and cancerous lesions by comparing the gene expression of stem-like cells in diseased tissues with normal stem cells |
| Entrez ID | Symbol | Replicates | Species | Organ | Tissue | Adj P-value | Log2FC | Malignancy |
| 255520 | ELMOD2 | HCC1_Meng | Human | Liver | HCC | 1.89e-44 | 5.23e-02 | 0.0246 |
| 255520 | ELMOD2 | HCC2_Meng | Human | Liver | HCC | 4.15e-21 | 8.31e-02 | 0.0107 |
| 255520 | ELMOD2 | HCC1 | Human | Liver | HCC | 6.29e-03 | 2.31e+00 | 0.5336 |
| 255520 | ELMOD2 | HCC2 | Human | Liver | HCC | 9.57e-07 | 2.84e+00 | 0.5341 |
| 255520 | ELMOD2 | Pt14.a | Human | Liver | HCC | 8.87e-03 | 2.51e-01 | 0.0169 |
| 255520 | ELMOD2 | S015 | Human | Liver | HCC | 9.92e-09 | 4.67e-01 | 0.2375 |
| 255520 | ELMOD2 | S016 | Human | Liver | HCC | 2.30e-07 | 2.63e-01 | 0.2243 |
| 255520 | ELMOD2 | S028 | Human | Liver | HCC | 6.71e-14 | 4.93e-01 | 0.2503 |
| 255520 | ELMOD2 | S029 | Human | Liver | HCC | 8.39e-13 | 5.10e-01 | 0.2581 |
| 255520 | ELMOD2 | C04 | Human | Oral cavity | OSCC | 6.44e-11 | 3.96e-01 | 0.2633 |
| 255520 | ELMOD2 | C21 | Human | Oral cavity | OSCC | 5.85e-28 | 7.86e-01 | 0.2678 |
| 255520 | ELMOD2 | C30 | Human | Oral cavity | OSCC | 1.53e-12 | 5.70e-01 | 0.3055 |
| 255520 | ELMOD2 | C43 | Human | Oral cavity | OSCC | 2.27e-07 | 1.52e-01 | 0.1704 |
| 255520 | ELMOD2 | C46 | Human | Oral cavity | OSCC | 1.04e-12 | 2.65e-01 | 0.1673 |
| 255520 | ELMOD2 | C51 | Human | Oral cavity | OSCC | 1.28e-05 | 3.14e-01 | 0.2674 |
| 255520 | ELMOD2 | C57 | Human | Oral cavity | OSCC | 1.34e-12 | 3.01e-01 | 0.1679 |
| 255520 | ELMOD2 | C06 | Human | Oral cavity | OSCC | 3.87e-07 | 7.71e-01 | 0.2699 |
| 255520 | ELMOD2 | C08 | Human | Oral cavity | OSCC | 7.20e-21 | 4.65e-01 | 0.1919 |
| 255520 | ELMOD2 | LN46 | Human | Oral cavity | OSCC | 4.50e-06 | 1.77e-01 | 0.1666 |
| 255520 | ELMOD2 | SYSMH1 | Human | Oral cavity | OSCC | 1.32e-04 | 9.31e-02 | 0.1127 |
| Page: 1 2 |
| Tissue | Expression Dynamics | Abbreviation |
| Liver | 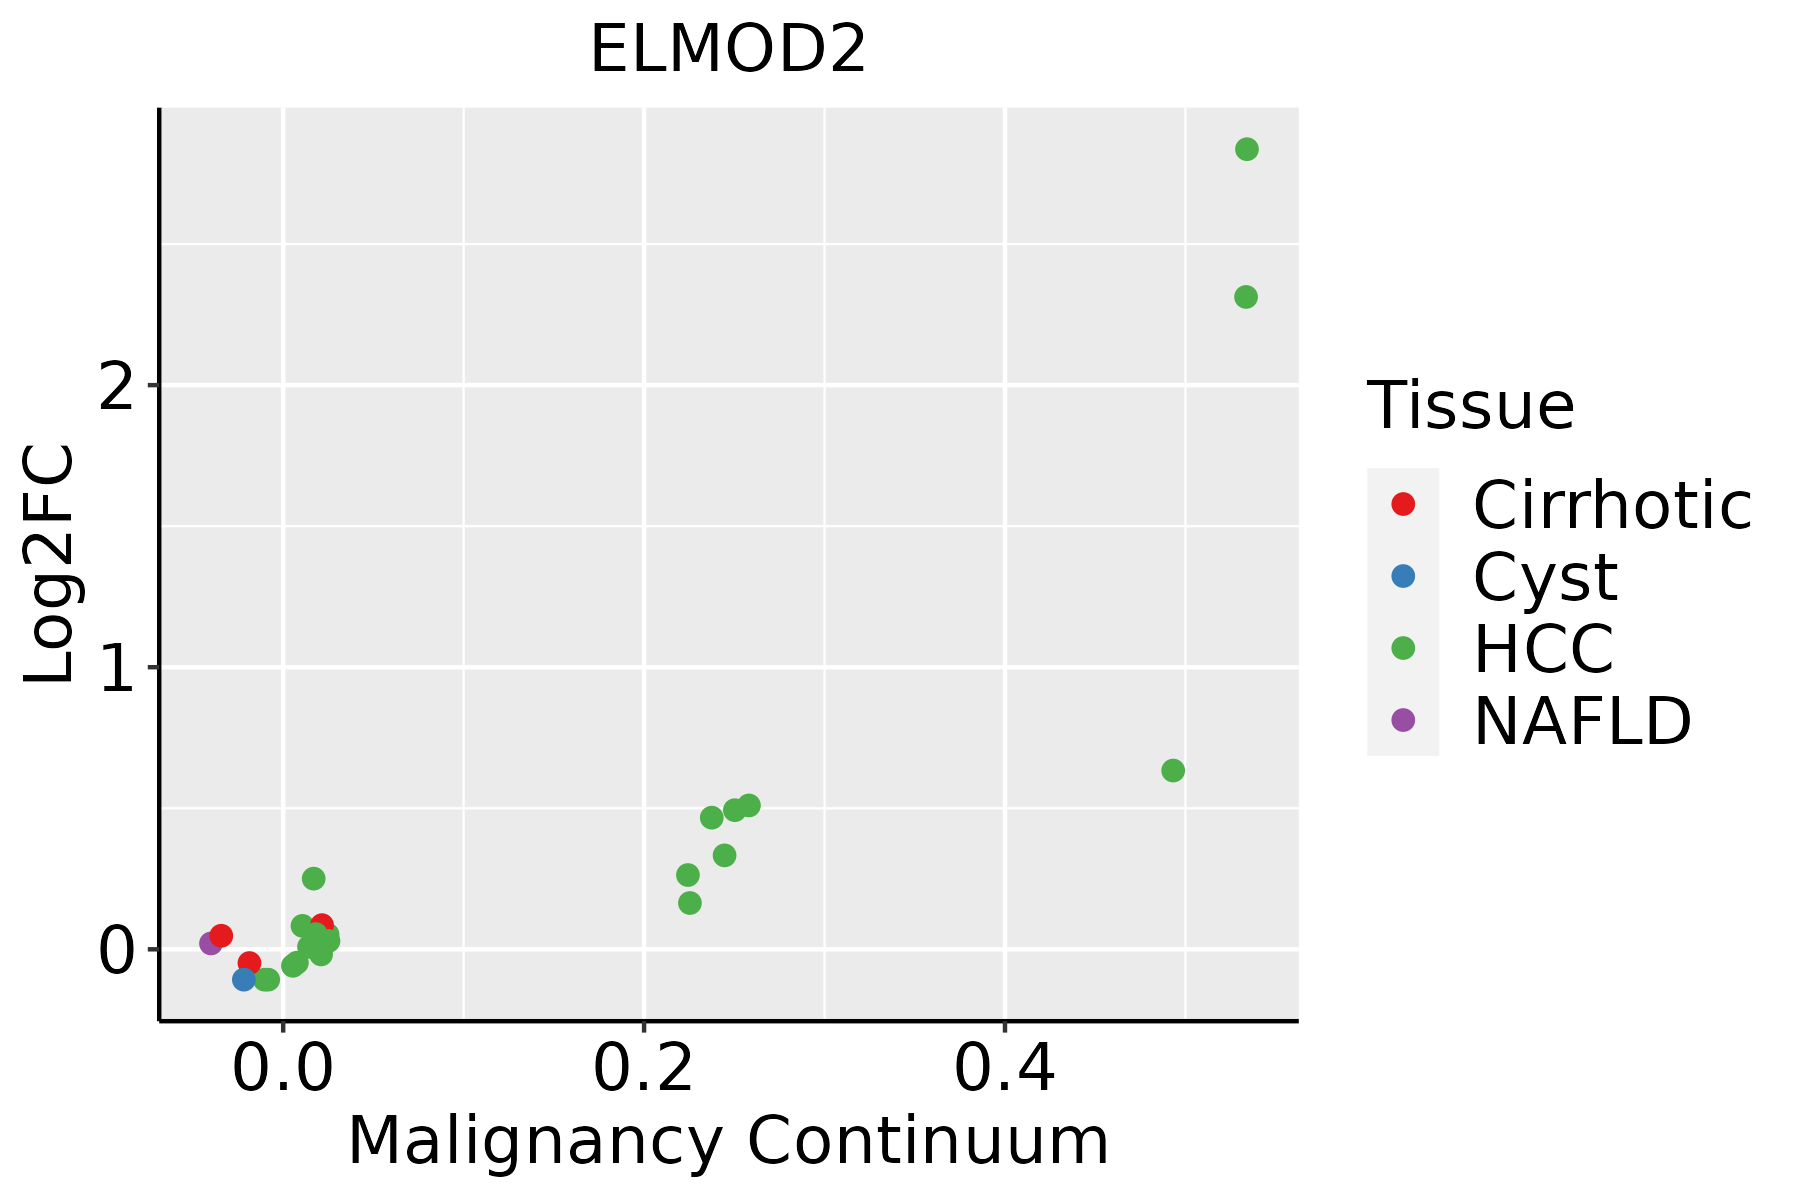 | HCC: Hepatocellular carcinoma |
| NAFLD: Non-alcoholic fatty liver disease | ||
| Oral Cavity | 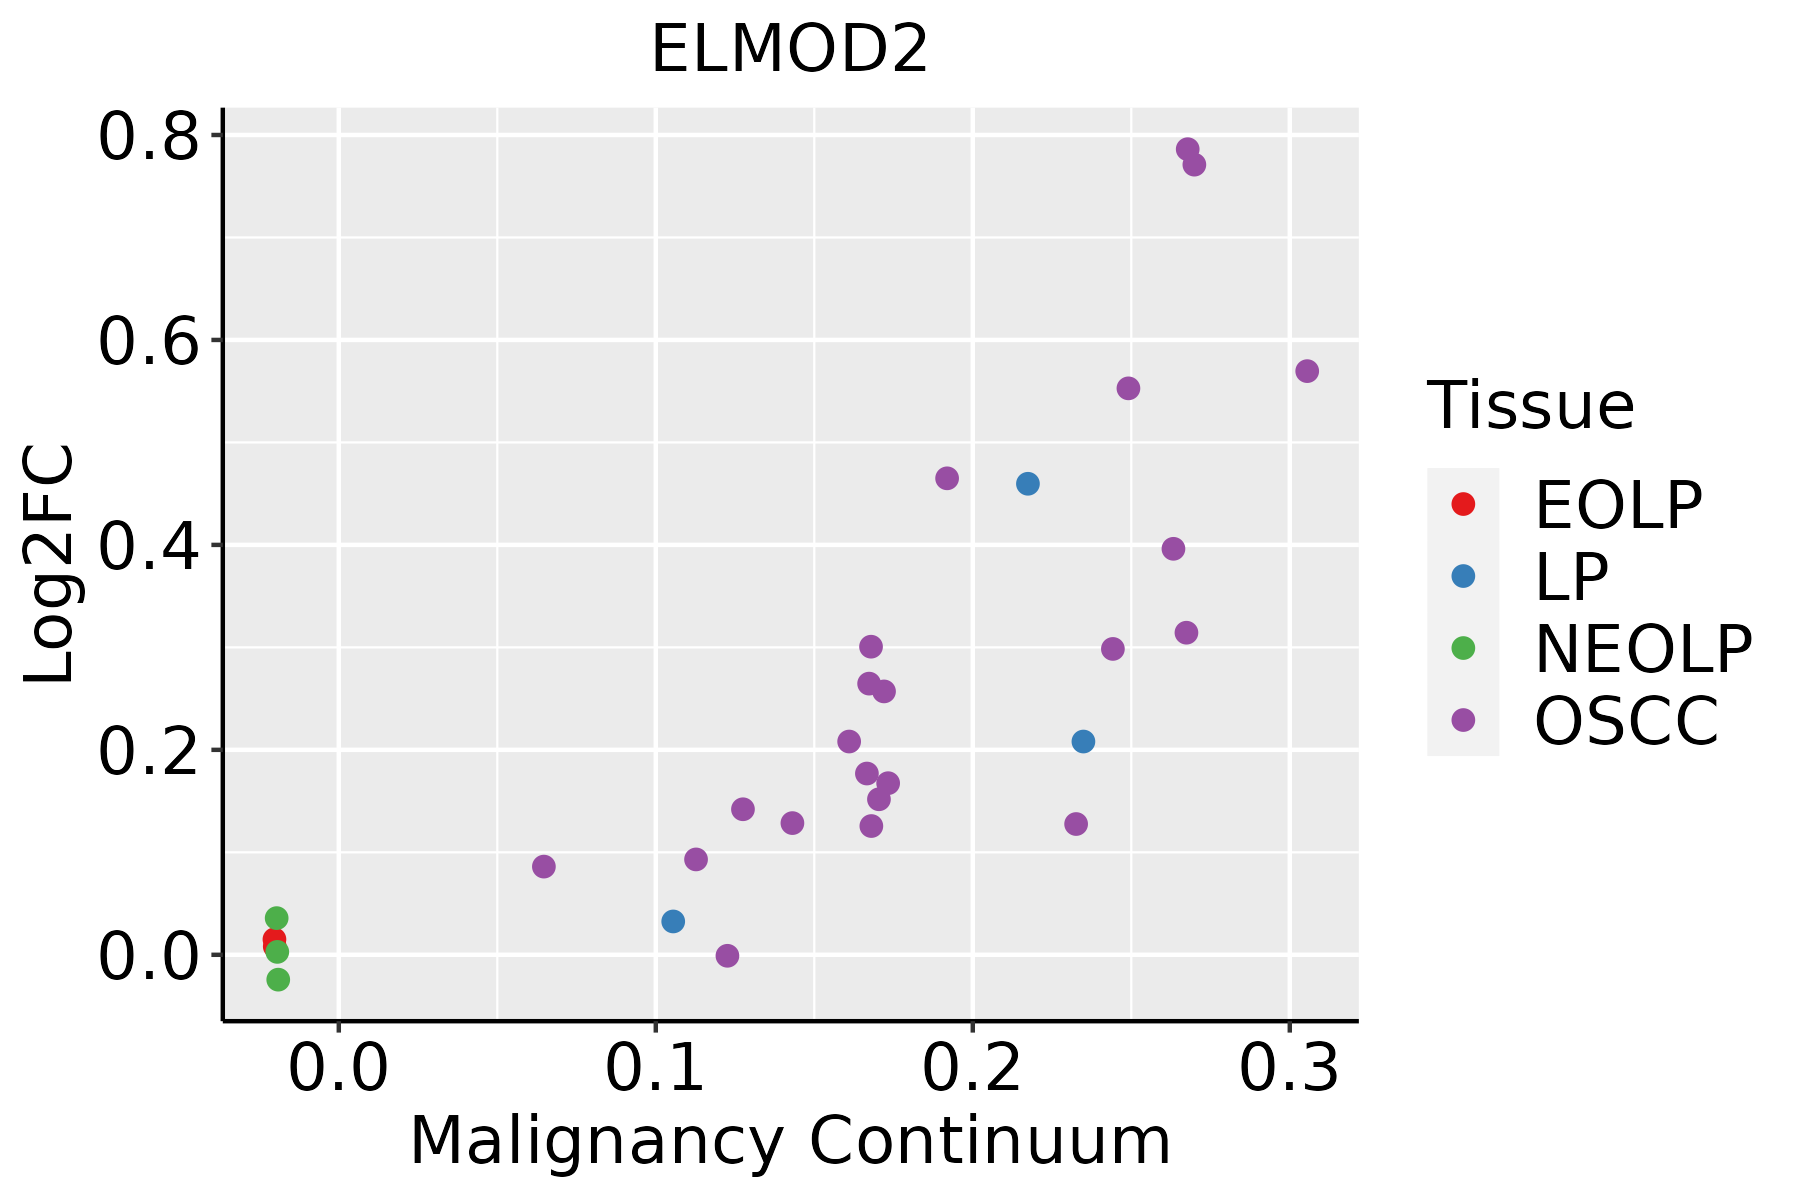 | EOLP: Erosive Oral lichen planus |
| LP: leukoplakia | ||
| NEOLP: Non-erosive oral lichen planus | ||
| OSCC: Oral squamous cell carcinoma |
| ∗log2FC in expression of this searched gene in stem-like cells from each diseased tissue sample relative to stem-like cells in normal samples in each tissue plotted against the malignancy continuum. Samples are colored based on if they are from different disease stage. |
Top |
Malignant transformation related pathway analysis |
| Find out the enriched GO biological processes and KEGG pathways involved in transition from healthy to precancer to cancer |
| Tissue | Disease Stage | Enriched GO biological Processes |
| Colorectum | AD |  |
| Colorectum | SER |  |
| Colorectum | MSS |  |
| Colorectum | MSI-H |  |
| Colorectum | FAP |  |
| ∗Top 15 enriched GO BP terms are showed in the bar plot of each disease state in each tissue. Each row represents a significant GO biological process which is colored according to the -log10(p.adjust). |
| Page: 1 2 3 4 5 6 7 8 9 |
| GO ID | Tissue | Disease Stage | Description | Gene Ratio | Bg Ratio | pvalue | p.adjust | Count |
| GO:000961511 | Liver | HCC | response to virus | 210/7958 | 367/18723 | 7.32e-09 | 1.86e-07 | 210 |
| GO:00516071 | Liver | HCC | defense response to virus | 151/7958 | 265/18723 | 1.27e-06 | 1.85e-05 | 151 |
| GO:01405461 | Liver | HCC | defense response to symbiont | 151/7958 | 265/18723 | 1.27e-06 | 1.85e-05 | 151 |
| GO:00028312 | Liver | HCC | regulation of response to biotic stimulus | 173/7958 | 327/18723 | 8.55e-05 | 7.48e-04 | 173 |
| GO:0050688 | Liver | HCC | regulation of defense response to virus | 41/7958 | 69/18723 | 3.38e-03 | 1.54e-02 | 41 |
| GO:000961515 | Oral cavity | OSCC | response to virus | 215/7305 | 367/18723 | 1.63e-14 | 9.41e-13 | 215 |
| GO:00516074 | Oral cavity | OSCC | defense response to virus | 154/7305 | 265/18723 | 1.96e-10 | 5.63e-09 | 154 |
| GO:01405464 | Oral cavity | OSCC | defense response to symbiont | 154/7305 | 265/18723 | 1.96e-10 | 5.63e-09 | 154 |
| GO:00028317 | Oral cavity | OSCC | regulation of response to biotic stimulus | 177/7305 | 327/18723 | 1.73e-08 | 3.43e-07 | 177 |
| GO:00506883 | Oral cavity | OSCC | regulation of defense response to virus | 42/7305 | 69/18723 | 1.92e-04 | 1.29e-03 | 42 |
| GO:004308710 | Oral cavity | OSCC | regulation of GTPase activity | 165/7305 | 348/18723 | 7.94e-04 | 4.27e-03 | 165 |
| Page: 1 |
| Pathway ID | Tissue | Disease Stage | Description | Gene Ratio | Bg Ratio | pvalue | p.adjust | qvalue | Count |
| Page: 1 |
Top |
Cell-cell communication analysis |
| Identification of potential cell-cell interactions between two cell types and their ligand-receptor pairs for different disease states |
| Ligand | Receptor | LRpair | Pathway | Tissue | Disease Stage |
| Page: 1 |
Top |
Single-cell gene regulatory network inference analysis |
| Find out the significant the regulons (TFs) and the target genes of each regulon across cell types for different disease states |
| TF | Cell Type | Tissue | Disease Stage | Target Gene | RSS | Regulon Activity |
| ∗The dot plots of a searched regulon are shown for all cell subpopulations in each disease state of each tissue based on the regulon specific score inferred using pySCENIC and by calculating the average expression. |
| Page: 1 |
Top |
Somatic mutation of malignant transformation related genes |
| Annotation of somatic variants for genes involved in malignant transformation |
| Hugo Symbol | Variant Class | Variant Classification | dbSNP RS | HGVSc | HGVSp | HGVSp Short | SWISSPROT | BIOTYPE | SIFT | PolyPhen | Tumor Sample Barcode | Tissue | Histology | Sex | Age | Stage | Therapy Types | Drugs | Outcome |
| ELMOD2 | SNV | Missense_Mutation | c.106N>A | p.Asp36Asn | p.D36N | Q8IZ81 | protein_coding | tolerated(0.81) | benign(0.115) | TCGA-BH-A18J-01 | Breast | breast invasive carcinoma | Female | <65 | III/IV | Unknown | Unknown | PD | |
| ELMOD2 | SNV | Missense_Mutation | c.31N>T | p.Gly11Trp | p.G11W | Q8IZ81 | protein_coding | tolerated(0.2) | possibly_damaging(0.71) | TCGA-C5-A1ML-01 | Cervix | cervical & endocervical cancer | Female | <65 | I/II | Unknown | Unknown | PD | |
| ELMOD2 | SNV | Missense_Mutation | c.32N>T | p.Gly11Val | p.G11V | Q8IZ81 | protein_coding | tolerated(0.49) | benign(0.038) | TCGA-C5-A1ML-01 | Cervix | cervical & endocervical cancer | Female | <65 | I/II | Unknown | Unknown | PD | |
| ELMOD2 | SNV | Missense_Mutation | rs373389261 | c.422C>T | p.Thr141Met | p.T141M | Q8IZ81 | protein_coding | tolerated(0.07) | possibly_damaging(0.59) | TCGA-AA-3811-01 | Colorectum | colon adenocarcinoma | Female | >=65 | III/IV | Unknown | Unknown | PD |
| ELMOD2 | SNV | Missense_Mutation | c.359N>G | p.Tyr120Cys | p.Y120C | Q8IZ81 | protein_coding | deleterious(0) | probably_damaging(0.934) | TCGA-CK-4951-01 | Colorectum | colon adenocarcinoma | Female | >=65 | I/II | Unknown | Unknown | PD | |
| ELMOD2 | SNV | Missense_Mutation | novel | c.619G>A | p.Val207Ile | p.V207I | Q8IZ81 | protein_coding | deleterious(0) | probably_damaging(0.997) | TCGA-A5-A0G2-01 | Endometrium | uterine corpus endometrioid carcinoma | Female | <65 | III/IV | Unknown | Unknown | SD |
| ELMOD2 | SNV | Missense_Mutation | rs150918381 | c.98N>A | p.Arg33Gln | p.R33Q | Q8IZ81 | protein_coding | deleterious(0) | probably_damaging(0.994) | TCGA-AJ-A3EL-01 | Endometrium | uterine corpus endometrioid carcinoma | Female | <65 | I/II | Unknown | Unknown | SD |
| ELMOD2 | SNV | Missense_Mutation | novel | c.11N>A | p.Ser4Tyr | p.S4Y | Q8IZ81 | protein_coding | tolerated(1) | benign(0) | TCGA-AJ-A5DW-01 | Endometrium | uterine corpus endometrioid carcinoma | Female | <65 | I/II | Unknown | Unknown | SD |
| ELMOD2 | SNV | Missense_Mutation | rs150918381 | c.98N>A | p.Arg33Gln | p.R33Q | Q8IZ81 | protein_coding | deleterious(0) | probably_damaging(0.994) | TCGA-AP-A056-01 | Endometrium | uterine corpus endometrioid carcinoma | Female | <65 | I/II | Unknown | Unknown | SD |
| ELMOD2 | SNV | Missense_Mutation | rs375756274 | c.185N>T | p.Ala62Val | p.A62V | Q8IZ81 | protein_coding | tolerated(0.29) | possibly_damaging(0.829) | TCGA-AP-A059-01 | Endometrium | uterine corpus endometrioid carcinoma | Female | >=65 | I/II | Unknown | Unknown | SD |
| Page: 1 2 3 |
Top |
Related drugs of malignant transformation related genes |
| Identification of chemicals and drugs interact with genes involved in malignant transfromation |
| (DGIdb 4.0) |
| Entrez ID | Symbol | Category | Interaction Types | Drug Claim Name | Drug Name | PMIDs |
| Page: 1 |

Copyright 2023-Present -The University of Texas Health Science Center at Houston |