
|
|||||
|
 | |
| |
| |
| |
| |
| |
|
Gene: ELMO3 |
Gene summary for ELMO3 |
| Gene information | Species | Human | Gene symbol | ELMO3 | Gene ID | 79767 |
| Gene name | engulfment and cell motility 3 | |
| Gene Alias | CED-12 | |
| Cytomap | 16q22.1 | |
| Gene Type | protein-coding | GO ID | GO:0006810 | UniProtAcc | Q96BJ8 |
Top |
Malignant transformation analysis |
| Identification of the aberrant gene expression in precancerous and cancerous lesions by comparing the gene expression of stem-like cells in diseased tissues with normal stem cells |
| Entrez ID | Symbol | Replicates | Species | Organ | Tissue | Adj P-value | Log2FC | Malignancy |
| 79767 | ELMO3 | LZE4T | Human | Esophagus | ESCC | 3.50e-10 | 3.10e-01 | 0.0811 |
| 79767 | ELMO3 | LZE7T | Human | Esophagus | ESCC | 1.13e-10 | 3.60e-01 | 0.0667 |
| 79767 | ELMO3 | LZE8T | Human | Esophagus | ESCC | 1.23e-03 | 1.73e-01 | 0.067 |
| 79767 | ELMO3 | LZE20T | Human | Esophagus | ESCC | 1.17e-05 | 1.05e-01 | 0.0662 |
| 79767 | ELMO3 | LZE22D1 | Human | Esophagus | HGIN | 3.25e-02 | 1.11e-01 | 0.0595 |
| 79767 | ELMO3 | LZE24T | Human | Esophagus | ESCC | 3.81e-13 | 5.12e-01 | 0.0596 |
| 79767 | ELMO3 | LZE21T | Human | Esophagus | ESCC | 8.38e-04 | 2.73e-01 | 0.0655 |
| 79767 | ELMO3 | P1T-E | Human | Esophagus | ESCC | 1.15e-10 | 5.57e-01 | 0.0875 |
| 79767 | ELMO3 | P2T-E | Human | Esophagus | ESCC | 1.24e-21 | 1.17e-01 | 0.1177 |
| 79767 | ELMO3 | P4T-E | Human | Esophagus | ESCC | 3.45e-22 | 3.94e-01 | 0.1323 |
| 79767 | ELMO3 | P5T-E | Human | Esophagus | ESCC | 2.69e-16 | 3.67e-01 | 0.1327 |
| 79767 | ELMO3 | P8T-E | Human | Esophagus | ESCC | 5.16e-22 | 4.06e-01 | 0.0889 |
| 79767 | ELMO3 | P9T-E | Human | Esophagus | ESCC | 7.97e-06 | 1.89e-01 | 0.1131 |
| 79767 | ELMO3 | P10T-E | Human | Esophagus | ESCC | 5.87e-11 | 7.83e-02 | 0.116 |
| 79767 | ELMO3 | P11T-E | Human | Esophagus | ESCC | 1.45e-06 | 5.37e-01 | 0.1426 |
| 79767 | ELMO3 | P12T-E | Human | Esophagus | ESCC | 1.84e-16 | 2.14e-01 | 0.1122 |
| 79767 | ELMO3 | P15T-E | Human | Esophagus | ESCC | 3.56e-16 | 2.75e-01 | 0.1149 |
| 79767 | ELMO3 | P16T-E | Human | Esophagus | ESCC | 5.09e-10 | 8.84e-02 | 0.1153 |
| 79767 | ELMO3 | P17T-E | Human | Esophagus | ESCC | 2.30e-08 | 4.51e-01 | 0.1278 |
| 79767 | ELMO3 | P20T-E | Human | Esophagus | ESCC | 1.05e-20 | 4.62e-01 | 0.1124 |
| Page: 1 2 3 4 5 |
| Tissue | Expression Dynamics | Abbreviation |
| Esophagus |  | ESCC: Esophageal squamous cell carcinoma |
| HGIN: High-grade intraepithelial neoplasias | ||
| LGIN: Low-grade intraepithelial neoplasias | ||
| Oral Cavity |  | EOLP: Erosive Oral lichen planus |
| LP: leukoplakia | ||
| NEOLP: Non-erosive oral lichen planus | ||
| OSCC: Oral squamous cell carcinoma | ||
| Skin | 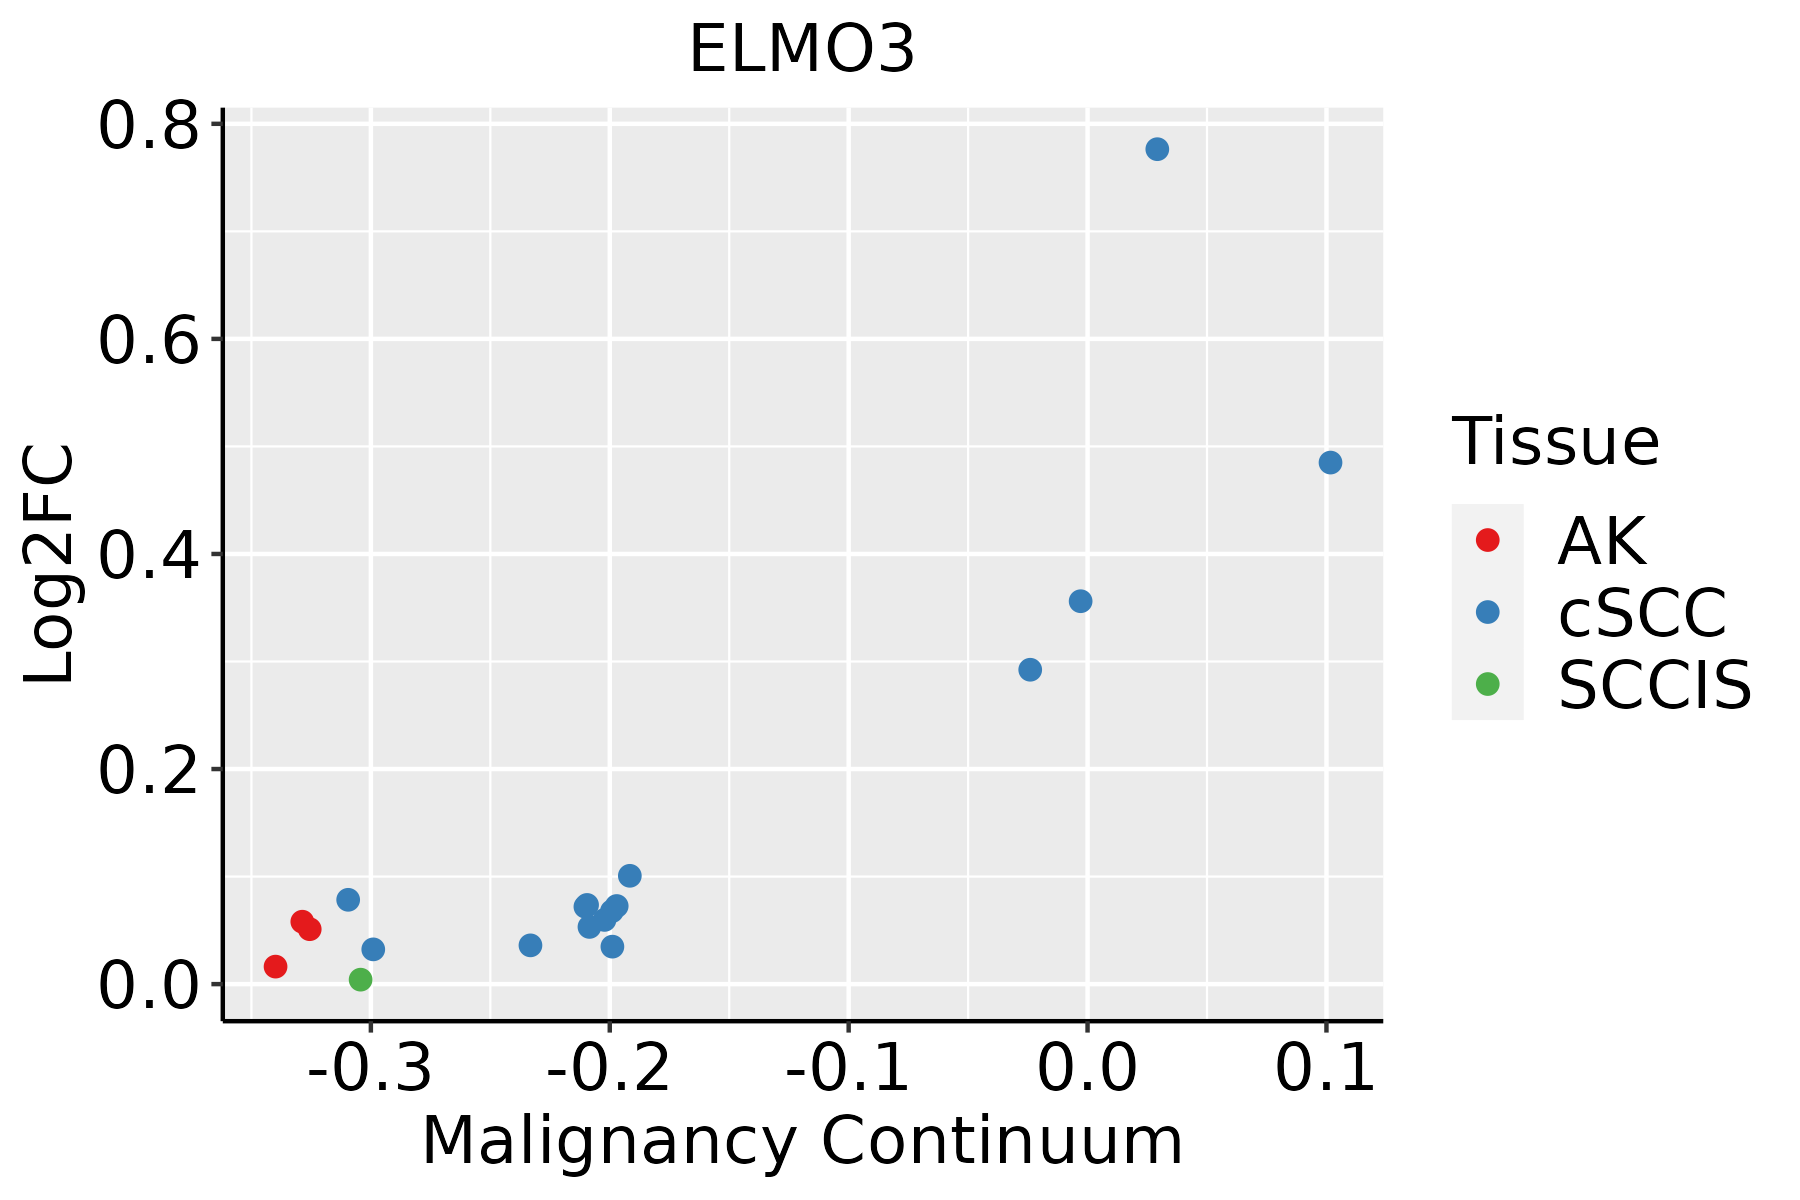 | AK: Actinic keratosis |
| cSCC: Cutaneous squamous cell carcinoma | ||
| SCCIS:squamous cell carcinoma in situ |
| ∗log2FC in expression of this searched gene in stem-like cells from each diseased tissue sample relative to stem-like cells in normal samples in each tissue plotted against the malignancy continuum. Samples are colored based on if they are from different disease stage. |
Top |
Malignant transformation related pathway analysis |
| Find out the enriched GO biological processes and KEGG pathways involved in transition from healthy to precancer to cancer |
| Tissue | Disease Stage | Enriched GO biological Processes |
| Colorectum | AD |  |
| Colorectum | SER |  |
| Colorectum | MSS |  |
| Colorectum | MSI-H |  |
| Colorectum | FAP |  |
| ∗Top 15 enriched GO BP terms are showed in the bar plot of each disease state in each tissue. Each row represents a significant GO biological process which is colored according to the -log10(p.adjust). |
| Page: 1 2 3 4 5 6 7 8 9 |
| GO ID | Tissue | Disease Stage | Description | Gene Ratio | Bg Ratio | pvalue | p.adjust | Count |
| GO:000701527 | Esophagus | ESCC | actin filament organization | 259/8552 | 442/18723 | 2.37e-08 | 4.50e-07 | 259 |
| GO:000701520 | Oral cavity | OSCC | actin filament organization | 230/7305 | 442/18723 | 1.37e-08 | 2.77e-07 | 230 |
| GO:0007015110 | Oral cavity | LP | actin filament organization | 143/4623 | 442/18723 | 1.44e-04 | 1.65e-03 | 143 |
| GO:000701529 | Skin | cSCC | actin filament organization | 156/4864 | 442/18723 | 7.37e-06 | 1.02e-04 | 156 |
| Page: 1 |
| Pathway ID | Tissue | Disease Stage | Description | Gene Ratio | Bg Ratio | pvalue | p.adjust | qvalue | Count |
| hsa0510039 | Esophagus | HGIN | Bacterial invasion of epithelial cells | 30/1383 | 77/8465 | 1.49e-06 | 2.31e-05 | 1.84e-05 | 30 |
| hsa05100114 | Esophagus | HGIN | Bacterial invasion of epithelial cells | 30/1383 | 77/8465 | 1.49e-06 | 2.31e-05 | 1.84e-05 | 30 |
| hsa05100211 | Esophagus | ESCC | Bacterial invasion of epithelial cells | 59/4205 | 77/8465 | 1.05e-06 | 6.76e-06 | 3.46e-06 | 59 |
| hsa05100310 | Esophagus | ESCC | Bacterial invasion of epithelial cells | 59/4205 | 77/8465 | 1.05e-06 | 6.76e-06 | 3.46e-06 | 59 |
| hsa0510030 | Oral cavity | OSCC | Bacterial invasion of epithelial cells | 48/3704 | 77/8465 | 7.51e-04 | 2.19e-03 | 1.11e-03 | 48 |
| hsa05100113 | Oral cavity | OSCC | Bacterial invasion of epithelial cells | 48/3704 | 77/8465 | 7.51e-04 | 2.19e-03 | 1.11e-03 | 48 |
| hsa05100210 | Oral cavity | LP | Bacterial invasion of epithelial cells | 39/2418 | 77/8465 | 3.34e-05 | 2.22e-04 | 1.43e-04 | 39 |
| hsa0510038 | Oral cavity | LP | Bacterial invasion of epithelial cells | 39/2418 | 77/8465 | 3.34e-05 | 2.22e-04 | 1.43e-04 | 39 |
| Page: 1 |
Top |
Cell-cell communication analysis |
| Identification of potential cell-cell interactions between two cell types and their ligand-receptor pairs for different disease states |
| Ligand | Receptor | LRpair | Pathway | Tissue | Disease Stage |
| Page: 1 |
Top |
Single-cell gene regulatory network inference analysis |
| Find out the significant the regulons (TFs) and the target genes of each regulon across cell types for different disease states |
| TF | Cell Type | Tissue | Disease Stage | Target Gene | RSS | Regulon Activity |
| ∗The dot plots of a searched regulon are shown for all cell subpopulations in each disease state of each tissue based on the regulon specific score inferred using pySCENIC and by calculating the average expression. |
| Page: 1 |
Top |
Somatic mutation of malignant transformation related genes |
| Annotation of somatic variants for genes involved in malignant transformation |
| Hugo Symbol | Variant Class | Variant Classification | dbSNP RS | HGVSc | HGVSp | HGVSp Short | SWISSPROT | BIOTYPE | SIFT | PolyPhen | Tumor Sample Barcode | Tissue | Histology | Sex | Age | Stage | Therapy Types | Drugs | Outcome |
| ELMO3 | SNV | Missense_Mutation | c.28N>C | p.Glu10Gln | p.E10Q | Q96BJ8 | protein_coding | deleterious_low_confidence(0) | benign(0.084) | TCGA-AC-A23H-01 | Breast | breast invasive carcinoma | Female | >=65 | I/II | Unknown | Unknown | PD | |
| ELMO3 | deletion | Frame_Shift_Del | novel | c.252delC | p.Ala85LeufsTer3 | p.A85Lfs*3 | Q96BJ8 | protein_coding | TCGA-EW-A2FV-01 | Breast | breast invasive carcinoma | Female | <65 | III/IV | Chemotherapy | docetaxel | SD | ||
| ELMO3 | SNV | Missense_Mutation | c.1186G>C | p.Glu396Gln | p.E396Q | Q96BJ8 | protein_coding | deleterious(0.04) | probably_damaging(0.998) | TCGA-DR-A0ZM-01 | Cervix | cervical & endocervical cancer | Female | <65 | III/IV | Unspecific | Cisplatin | SD | |
| ELMO3 | SNV | Missense_Mutation | rs200461796 | c.2216N>A | p.Arg739His | p.R739H | Q96BJ8 | protein_coding | deleterious(0) | possibly_damaging(0.762) | TCGA-A6-6653-01 | Colorectum | colon adenocarcinoma | Male | >=65 | I/II | Unknown | Unknown | SD |
| ELMO3 | SNV | Missense_Mutation | c.1249N>A | p.Gly417Ser | p.G417S | Q96BJ8 | protein_coding | deleterious(0.02) | probably_damaging(0.975) | TCGA-AA-3492-01 | Colorectum | colon adenocarcinoma | Female | >=65 | I/II | Unknown | Unknown | SD | |
| ELMO3 | SNV | Missense_Mutation | rs765459031 | c.1238N>A | p.Arg413His | p.R413H | Q96BJ8 | protein_coding | tolerated(0.07) | benign(0.085) | TCGA-AA-3864-01 | Colorectum | colon adenocarcinoma | Male | >=65 | I/II | Unknown | Unknown | SD |
| ELMO3 | SNV | Missense_Mutation | novel | c.637N>C | p.Ser213Pro | p.S213P | Q96BJ8 | protein_coding | deleterious(0.03) | probably_damaging(0.965) | TCGA-AA-3939-01 | Colorectum | colon adenocarcinoma | Male | >=65 | I/II | Unknown | Unknown | SD |
| ELMO3 | SNV | Missense_Mutation | c.304T>C | p.Tyr102His | p.Y102H | Q96BJ8 | protein_coding | deleterious(0) | probably_damaging(0.999) | TCGA-AZ-6601-01 | Colorectum | colon adenocarcinoma | Male | >=65 | I/II | Unknown | Unknown | PD | |
| ELMO3 | SNV | Missense_Mutation | rs750093350 | c.2251N>T | p.Arg751Trp | p.R751W | Q96BJ8 | protein_coding | deleterious(0.02) | benign(0.409) | TCGA-D5-6530-01 | Colorectum | colon adenocarcinoma | Male | <65 | I/II | Unknown | Unknown | SD |
| ELMO3 | SNV | Missense_Mutation | c.475N>T | p.Arg159Cys | p.R159C | Q96BJ8 | protein_coding | deleterious(0.02) | possibly_damaging(0.491) | TCGA-DM-A1HB-01 | Colorectum | colon adenocarcinoma | Male | >=65 | III/IV | Unknown | Unknown | SD |
| Page: 1 2 3 4 5 6 |
Top |
Related drugs of malignant transformation related genes |
| Identification of chemicals and drugs interact with genes involved in malignant transfromation |
| (DGIdb 4.0) |
| Entrez ID | Symbol | Category | Interaction Types | Drug Claim Name | Drug Name | PMIDs |
| Page: 1 |

Copyright 2023-Present -The University of Texas Health Science Center at Houston |