
|
|||||
|
 | |
| |
| |
| |
| |
| |
|
Gene: ELMO2 |
Gene summary for ELMO2 |
| Gene information | Species | Human | Gene symbol | ELMO2 | Gene ID | 63916 |
| Gene name | engulfment and cell motility 2 | |
| Gene Alias | CED-12 | |
| Cytomap | 20q13.12 | |
| Gene Type | protein-coding | GO ID | GO:0006810 | UniProtAcc | Q96JJ3 |
Top |
Malignant transformation analysis |
| Identification of the aberrant gene expression in precancerous and cancerous lesions by comparing the gene expression of stem-like cells in diseased tissues with normal stem cells |
| Entrez ID | Symbol | Replicates | Species | Organ | Tissue | Adj P-value | Log2FC | Malignancy |
| 63916 | ELMO2 | HCC1 | Human | Liver | HCC | 9.18e-04 | 2.49e+00 | 0.5336 |
| 63916 | ELMO2 | HCC2 | Human | Liver | HCC | 2.35e-10 | 2.32e+00 | 0.5341 |
| 63916 | ELMO2 | S014 | Human | Liver | HCC | 6.82e-09 | 2.32e-01 | 0.2254 |
| 63916 | ELMO2 | S015 | Human | Liver | HCC | 4.27e-11 | 3.35e-01 | 0.2375 |
| 63916 | ELMO2 | S016 | Human | Liver | HCC | 3.11e-10 | 2.67e-01 | 0.2243 |
| 63916 | ELMO2 | S028 | Human | Liver | HCC | 1.07e-13 | 3.80e-01 | 0.2503 |
| 63916 | ELMO2 | S029 | Human | Liver | HCC | 2.66e-06 | 2.49e-01 | 0.2581 |
| Page: 1 |
| Tissue | Expression Dynamics | Abbreviation |
| Liver | 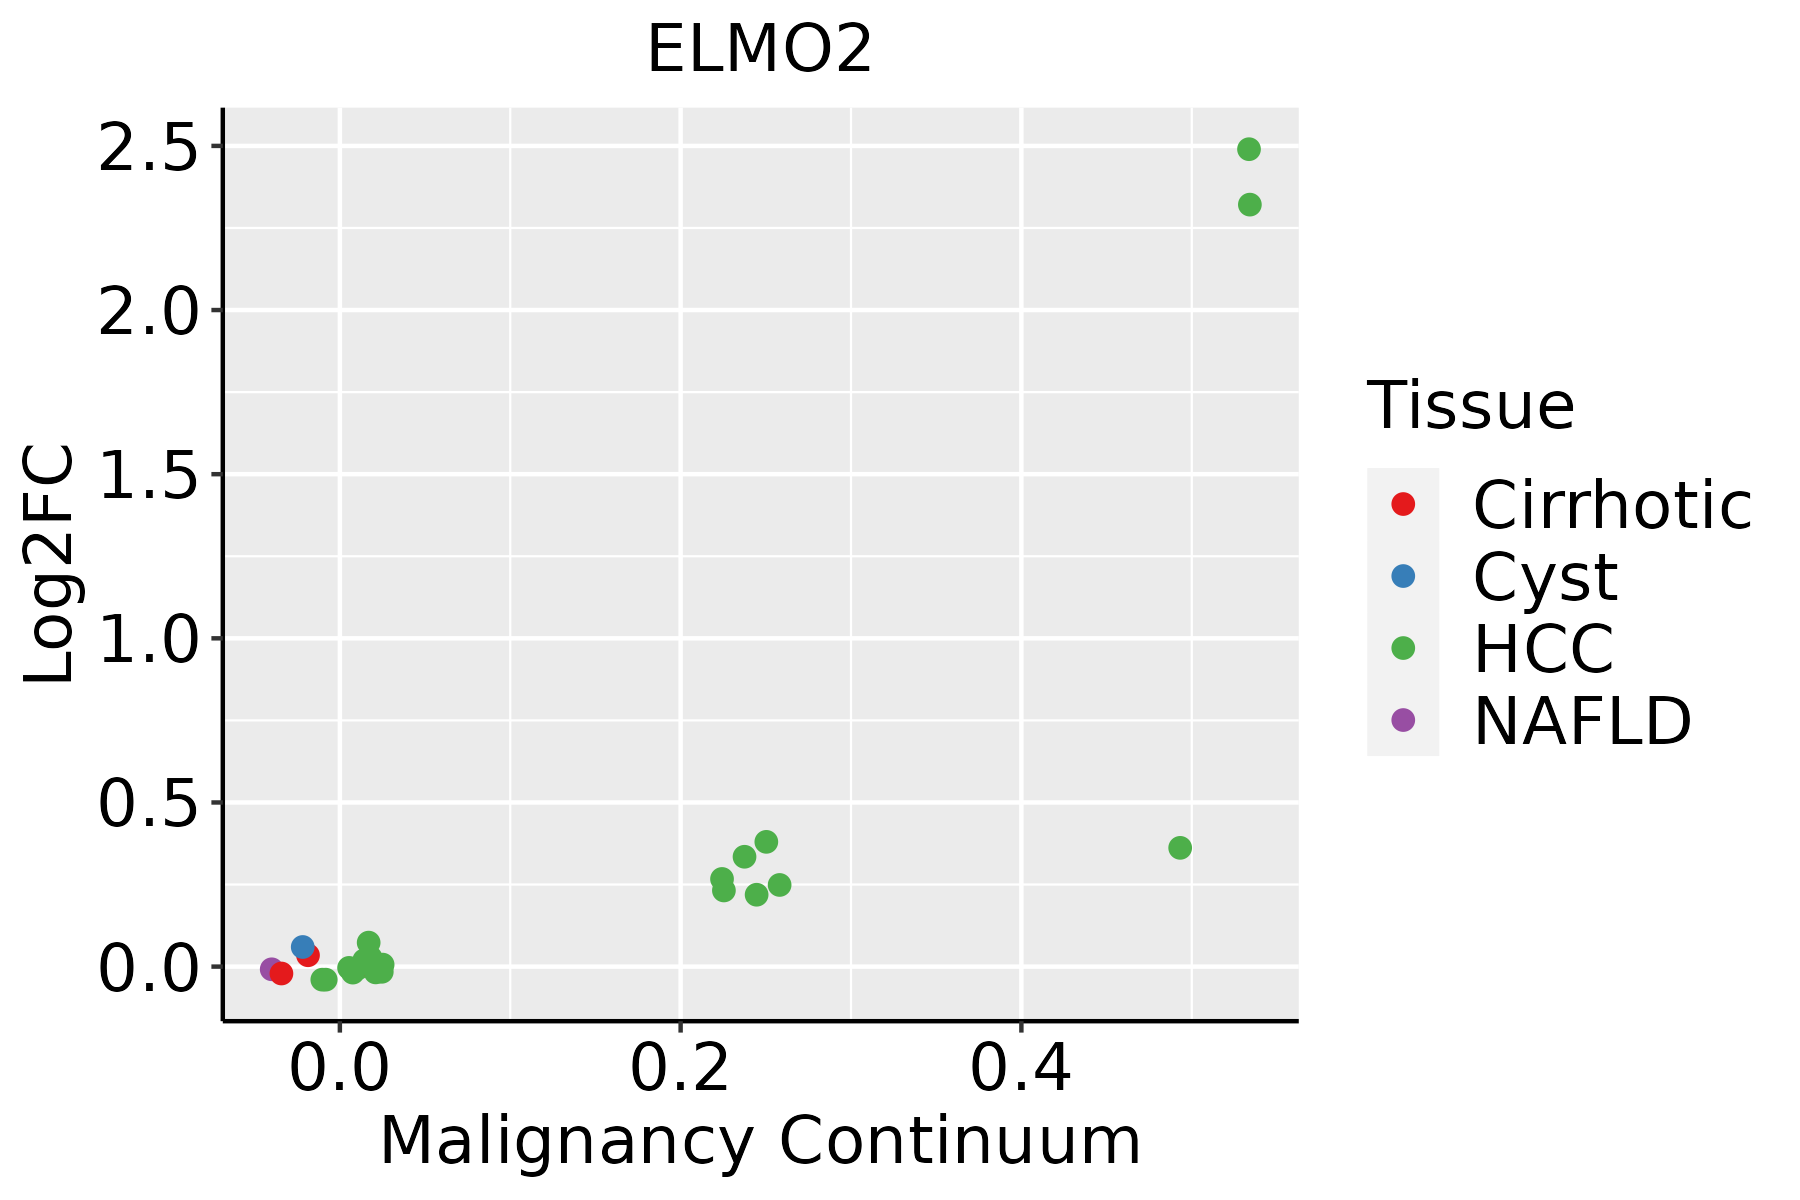 | HCC: Hepatocellular carcinoma |
| NAFLD: Non-alcoholic fatty liver disease |
| ∗log2FC in expression of this searched gene in stem-like cells from each diseased tissue sample relative to stem-like cells in normal samples in each tissue plotted against the malignancy continuum. Samples are colored based on if they are from different disease stage. |
Top |
Malignant transformation related pathway analysis |
| Find out the enriched GO biological processes and KEGG pathways involved in transition from healthy to precancer to cancer |
| Tissue | Disease Stage | Enriched GO biological Processes |
| Colorectum | AD |  |
| Colorectum | SER |  |
| Colorectum | MSS |  |
| Colorectum | MSI-H |  |
| Colorectum | FAP |  |
| ∗Top 15 enriched GO BP terms are showed in the bar plot of each disease state in each tissue. Each row represents a significant GO biological process which is colored according to the -log10(p.adjust). |
| Page: 1 2 3 4 5 6 7 8 9 |
| GO ID | Tissue | Disease Stage | Description | Gene Ratio | Bg Ratio | pvalue | p.adjust | Count |
| GO:000701522 | Liver | HCC | actin filament organization | 252/7958 | 442/18723 | 3.83e-10 | 1.25e-08 | 252 |
| Page: 1 |
| Pathway ID | Tissue | Disease Stage | Description | Gene Ratio | Bg Ratio | pvalue | p.adjust | qvalue | Count |
| hsa0513242 | Liver | HCC | Salmonella infection | 178/4020 | 249/8465 | 5.90e-15 | 1.98e-13 | 1.10e-13 | 178 |
| hsa0513542 | Liver | HCC | Yersinia infection | 92/4020 | 137/8465 | 2.25e-06 | 2.19e-05 | 1.22e-05 | 92 |
| hsa0513142 | Liver | HCC | Shigellosis | 150/4020 | 247/8465 | 1.53e-05 | 1.04e-04 | 5.81e-05 | 150 |
| hsa0513252 | Liver | HCC | Salmonella infection | 178/4020 | 249/8465 | 5.90e-15 | 1.98e-13 | 1.10e-13 | 178 |
| hsa0513552 | Liver | HCC | Yersinia infection | 92/4020 | 137/8465 | 2.25e-06 | 2.19e-05 | 1.22e-05 | 92 |
| hsa0513152 | Liver | HCC | Shigellosis | 150/4020 | 247/8465 | 1.53e-05 | 1.04e-04 | 5.81e-05 | 150 |
| Page: 1 |
Top |
Cell-cell communication analysis |
| Identification of potential cell-cell interactions between two cell types and their ligand-receptor pairs for different disease states |
| Ligand | Receptor | LRpair | Pathway | Tissue | Disease Stage |
| Page: 1 |
Top |
Single-cell gene regulatory network inference analysis |
| Find out the significant the regulons (TFs) and the target genes of each regulon across cell types for different disease states |
| TF | Cell Type | Tissue | Disease Stage | Target Gene | RSS | Regulon Activity |
| ∗The dot plots of a searched regulon are shown for all cell subpopulations in each disease state of each tissue based on the regulon specific score inferred using pySCENIC and by calculating the average expression. |
| Page: 1 |
Top |
Somatic mutation of malignant transformation related genes |
| Annotation of somatic variants for genes involved in malignant transformation |
| Hugo Symbol | Variant Class | Variant Classification | dbSNP RS | HGVSc | HGVSp | HGVSp Short | SWISSPROT | BIOTYPE | SIFT | PolyPhen | Tumor Sample Barcode | Tissue | Histology | Sex | Age | Stage | Therapy Types | Drugs | Outcome |
| ELMO2 | SNV | Missense_Mutation | c.868C>G | p.Gln290Glu | p.Q290E | Q96JJ3 | protein_coding | deleterious(0) | probably_damaging(0.999) | TCGA-AC-A23H-01 | Breast | breast invasive carcinoma | Female | >=65 | I/II | Unknown | Unknown | PD | |
| ELMO2 | SNV | Missense_Mutation | rs774822992 | c.1507N>C | p.Ser503Arg | p.S503R | Q96JJ3 | protein_coding | deleterious(0.01) | possibly_damaging(0.695) | TCGA-BH-A18G-01 | Breast | breast invasive carcinoma | Female | >=65 | I/II | Unknown | Unknown | SD |
| ELMO2 | SNV | Missense_Mutation | novel | c.2011N>C | p.Ser671Pro | p.S671P | Q96JJ3 | protein_coding | tolerated(0.17) | benign(0) | TCGA-2W-A8YY-01 | Cervix | cervical & endocervical cancer | Female | <65 | I/II | Chemotherapy | cisplatin | CR |
| ELMO2 | SNV | Missense_Mutation | novel | c.1312N>C | p.Phe438Leu | p.F438L | Q96JJ3 | protein_coding | deleterious(0.03) | benign(0.405) | TCGA-2W-A8YY-01 | Cervix | cervical & endocervical cancer | Female | <65 | I/II | Chemotherapy | cisplatin | CR |
| ELMO2 | SNV | Missense_Mutation | rs763326281 | c.752N>A | p.Arg251Gln | p.R251Q | Q96JJ3 | protein_coding | deleterious(0) | possibly_damaging(0.687) | TCGA-2W-A8YY-01 | Cervix | cervical & endocervical cancer | Female | <65 | I/II | Chemotherapy | cisplatin | CR |
| ELMO2 | SNV | Missense_Mutation | c.37N>C | p.Glu13Gln | p.E13Q | Q96JJ3 | protein_coding | tolerated(0.52) | benign(0.061) | TCGA-EK-A3GK-01 | Cervix | cervical & endocervical cancer | Female | <65 | I/II | Unknown | Unknown | SD | |
| ELMO2 | SNV | Missense_Mutation | c.985G>C | p.Asp329His | p.D329H | Q96JJ3 | protein_coding | deleterious(0.02) | possibly_damaging(0.897) | TCGA-JX-A3Q0-01 | Cervix | cervical & endocervical cancer | Female | <65 | III/IV | Unknown | Unknown | SD | |
| ELMO2 | SNV | Missense_Mutation | rs776816963 | c.1292N>A | p.Arg431His | p.R431H | Q96JJ3 | protein_coding | deleterious(0) | benign(0.212) | TCGA-AA-3864-01 | Colorectum | colon adenocarcinoma | Male | >=65 | I/II | Unknown | Unknown | SD |
| ELMO2 | SNV | Missense_Mutation | c.1394C>T | p.Ala465Val | p.A465V | Q96JJ3 | protein_coding | deleterious(0) | probably_damaging(0.992) | TCGA-AA-A010-01 | Colorectum | colon adenocarcinoma | Female | <65 | I/II | Chemotherapy | folinic | CR | |
| ELMO2 | SNV | Missense_Mutation | c.178T>C | p.Tyr60His | p.Y60H | Q96JJ3 | protein_coding | deleterious(0) | probably_damaging(0.984) | TCGA-CM-5861-01 | Colorectum | colon adenocarcinoma | Female | <65 | I/II | Unknown | Unknown | PD |
| Page: 1 2 3 4 5 6 |
Top |
Related drugs of malignant transformation related genes |
| Identification of chemicals and drugs interact with genes involved in malignant transfromation |
| (DGIdb 4.0) |
| Entrez ID | Symbol | Category | Interaction Types | Drug Claim Name | Drug Name | PMIDs |
| Page: 1 |

Copyright 2023-Present -The University of Texas Health Science Center at Houston |