
|
|||||
|
 | |
| |
| |
| |
| |
| |
|
Gene: ELL2 |
Gene summary for ELL2 |
| Gene information | Species | Human | Gene symbol | ELL2 | Gene ID | 22936 |
| Gene name | elongation factor for RNA polymerase II 2 | |
| Gene Alias | MRCCAT1 | |
| Cytomap | 5q15 | |
| Gene Type | protein-coding | GO ID | GO:0006139 | UniProtAcc | O00472 |
Top |
Malignant transformation analysis |
| Identification of the aberrant gene expression in precancerous and cancerous lesions by comparing the gene expression of stem-like cells in diseased tissues with normal stem cells |
| Entrez ID | Symbol | Replicates | Species | Organ | Tissue | Adj P-value | Log2FC | Malignancy |
| 22936 | ELL2 | CA_HPV_1 | Human | Cervix | CC | 2.33e-04 | -2.16e-01 | 0.0264 |
| 22936 | ELL2 | CA_HPV_2 | Human | Cervix | CC | 9.58e-05 | 4.01e-01 | 0.0391 |
| 22936 | ELL2 | CCI_2 | Human | Cervix | CC | 3.77e-03 | 6.82e-01 | 0.5249 |
| 22936 | ELL2 | CCI_3 | Human | Cervix | CC | 3.93e-10 | 1.12e+00 | 0.516 |
| 22936 | ELL2 | HTA11_3410_2000001011 | Human | Colorectum | AD | 2.93e-12 | -5.13e-01 | 0.0155 |
| 22936 | ELL2 | HTA11_2487_2000001011 | Human | Colorectum | SER | 6.71e-03 | -4.11e-01 | -0.1808 |
| 22936 | ELL2 | HTA11_3361_2000001011 | Human | Colorectum | AD | 2.39e-03 | -4.77e-01 | -0.1207 |
| 22936 | ELL2 | HTA11_696_2000001011 | Human | Colorectum | AD | 9.59e-08 | -3.68e-01 | -0.1464 |
| 22936 | ELL2 | HTA11_866_2000001011 | Human | Colorectum | AD | 6.38e-04 | -3.40e-01 | -0.1001 |
| 22936 | ELL2 | HTA11_866_3004761011 | Human | Colorectum | AD | 4.97e-11 | -5.17e-01 | 0.096 |
| 22936 | ELL2 | HTA11_10711_2000001011 | Human | Colorectum | AD | 8.77e-04 | -4.65e-01 | 0.0338 |
| 22936 | ELL2 | HTA11_7696_3000711011 | Human | Colorectum | AD | 8.09e-12 | -4.55e-01 | 0.0674 |
| 22936 | ELL2 | HTA11_6818_2000001021 | Human | Colorectum | AD | 1.98e-03 | -4.92e-01 | 0.0588 |
| 22936 | ELL2 | HTA11_99999970781_79442 | Human | Colorectum | MSS | 1.46e-15 | -4.78e-01 | 0.294 |
| 22936 | ELL2 | HTA11_99999971662_82457 | Human | Colorectum | MSS | 2.42e-09 | -3.65e-01 | 0.3859 |
| 22936 | ELL2 | HTA11_99999973899_84307 | Human | Colorectum | MSS | 5.69e-03 | -5.04e-01 | 0.2585 |
| 22936 | ELL2 | HTA11_99999974143_84620 | Human | Colorectum | MSS | 3.56e-23 | -5.51e-01 | 0.3005 |
| 22936 | ELL2 | F007 | Human | Colorectum | FAP | 1.66e-02 | -3.20e-01 | 0.1176 |
| 22936 | ELL2 | A002-C-010 | Human | Colorectum | FAP | 5.87e-09 | -3.16e-01 | 0.242 |
| 22936 | ELL2 | A001-C-207 | Human | Colorectum | FAP | 3.10e-07 | -3.55e-01 | 0.1278 |
| Page: 1 2 3 4 5 6 7 8 9 10 11 12 |
| Tissue | Expression Dynamics | Abbreviation |
| Cervix | 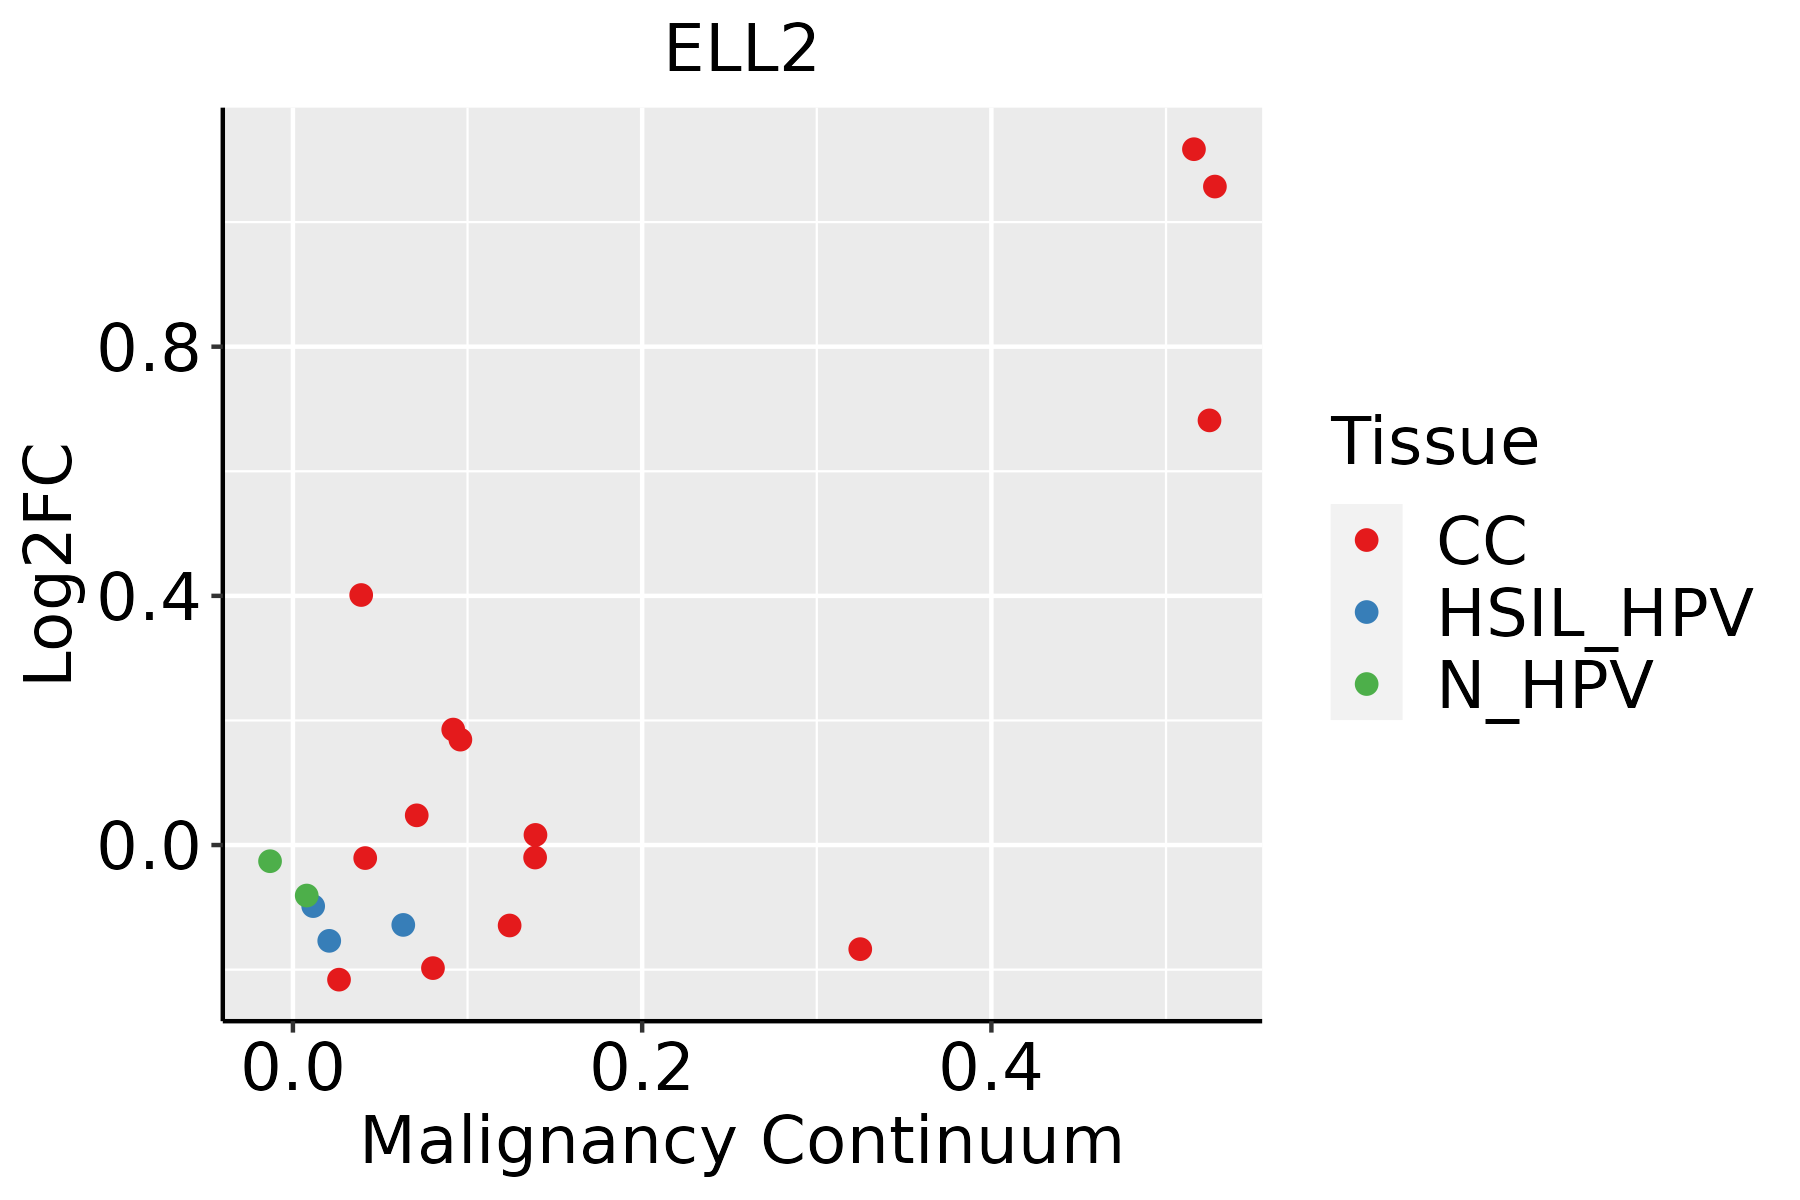 | CC: Cervix cancer |
| HSIL_HPV: HPV-infected high-grade squamous intraepithelial lesions | ||
| N_HPV: HPV-infected normal cervix | ||
| Colorectum (GSE201348) |  | FAP: Familial adenomatous polyposis |
| CRC: Colorectal cancer | ||
| Colorectum (HTA11) |  | AD: Adenomas |
| SER: Sessile serrated lesions | ||
| MSI-H: Microsatellite-high colorectal cancer | ||
| MSS: Microsatellite stable colorectal cancer | ||
| Endometrium |  | AEH: Atypical endometrial hyperplasia |
| EEC: Endometrioid Cancer | ||
| Esophagus |  | ESCC: Esophageal squamous cell carcinoma |
| HGIN: High-grade intraepithelial neoplasias | ||
| LGIN: Low-grade intraepithelial neoplasias | ||
| Liver |  | HCC: Hepatocellular carcinoma |
| NAFLD: Non-alcoholic fatty liver disease | ||
| Lung | 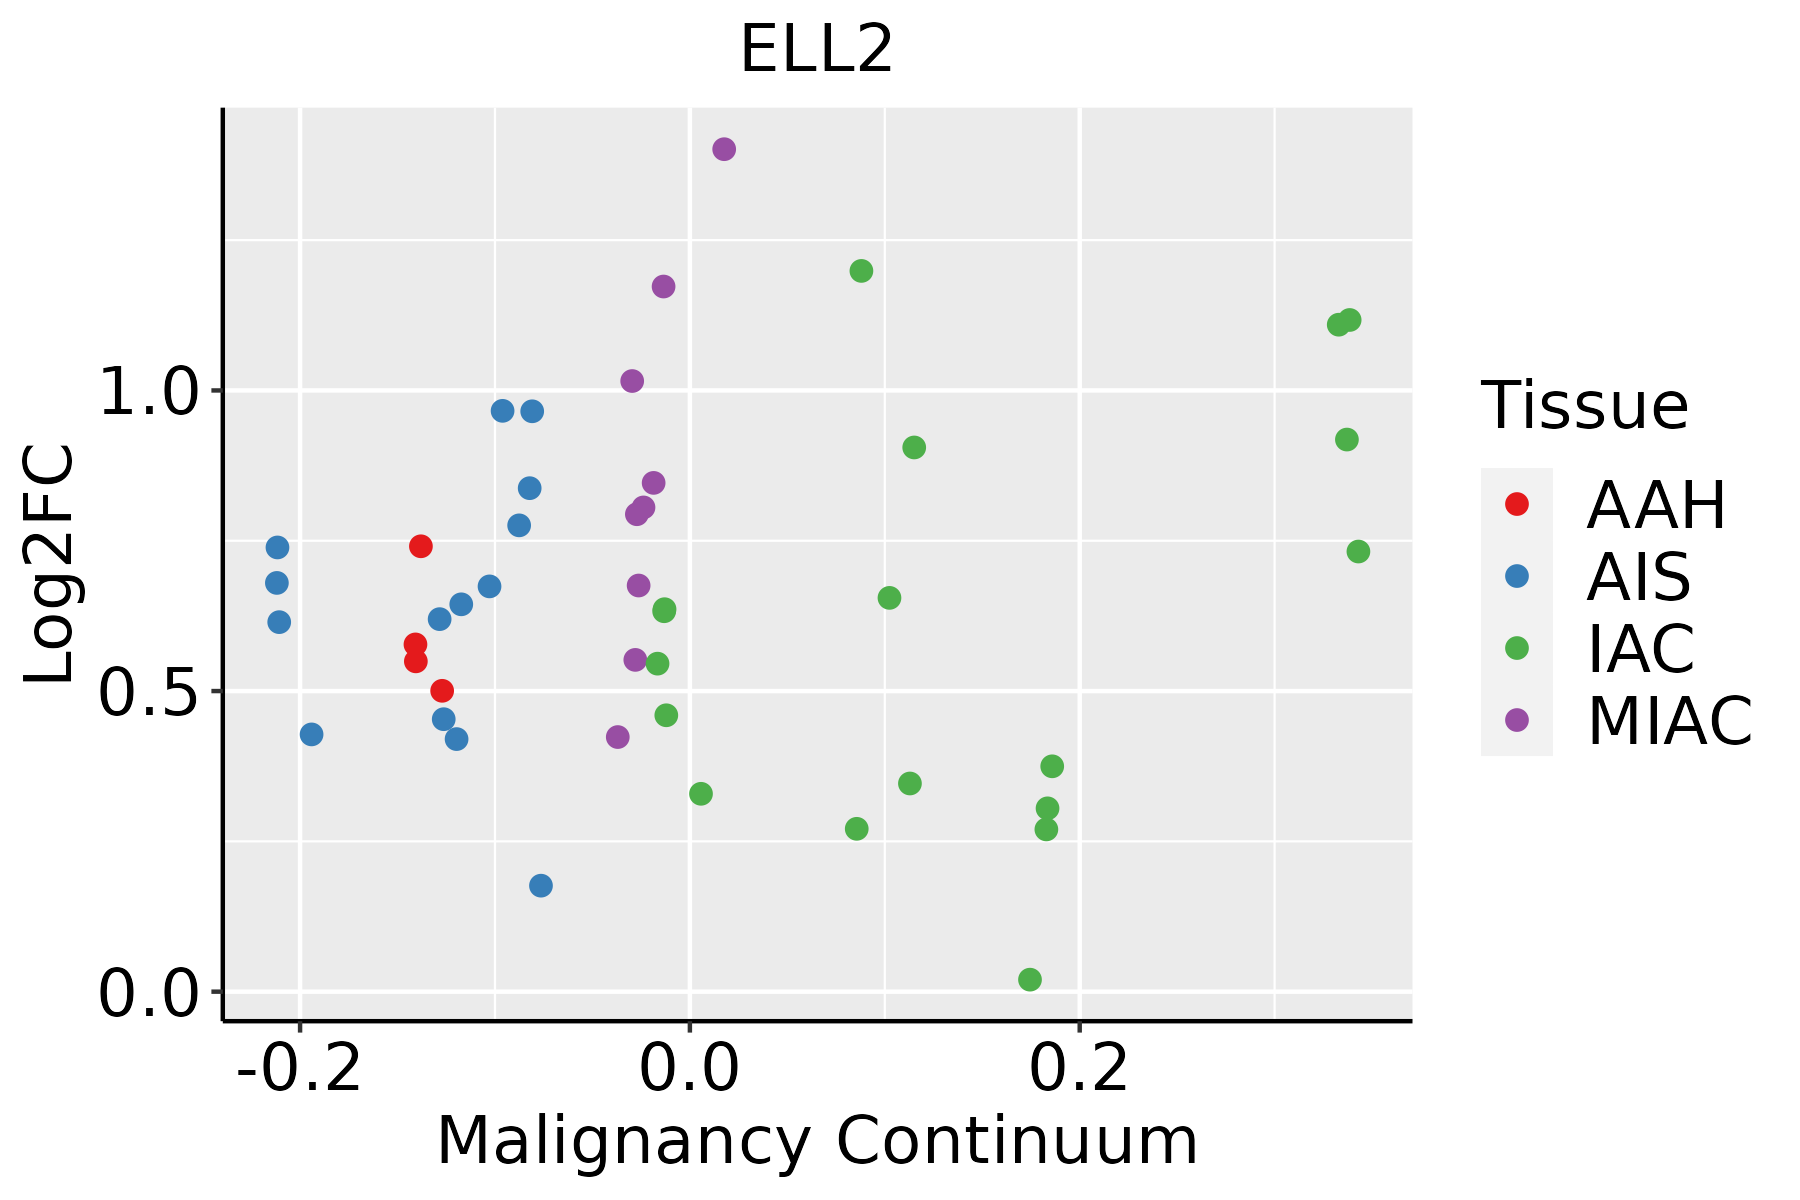 | AAH: Atypical adenomatous hyperplasia |
| AIS: Adenocarcinoma in situ | ||
| IAC: Invasive lung adenocarcinoma | ||
| MIA: Minimally invasive adenocarcinoma | ||
| Oral Cavity |  | EOLP: Erosive Oral lichen planus |
| LP: leukoplakia | ||
| NEOLP: Non-erosive oral lichen planus | ||
| OSCC: Oral squamous cell carcinoma | ||
| Prostate | 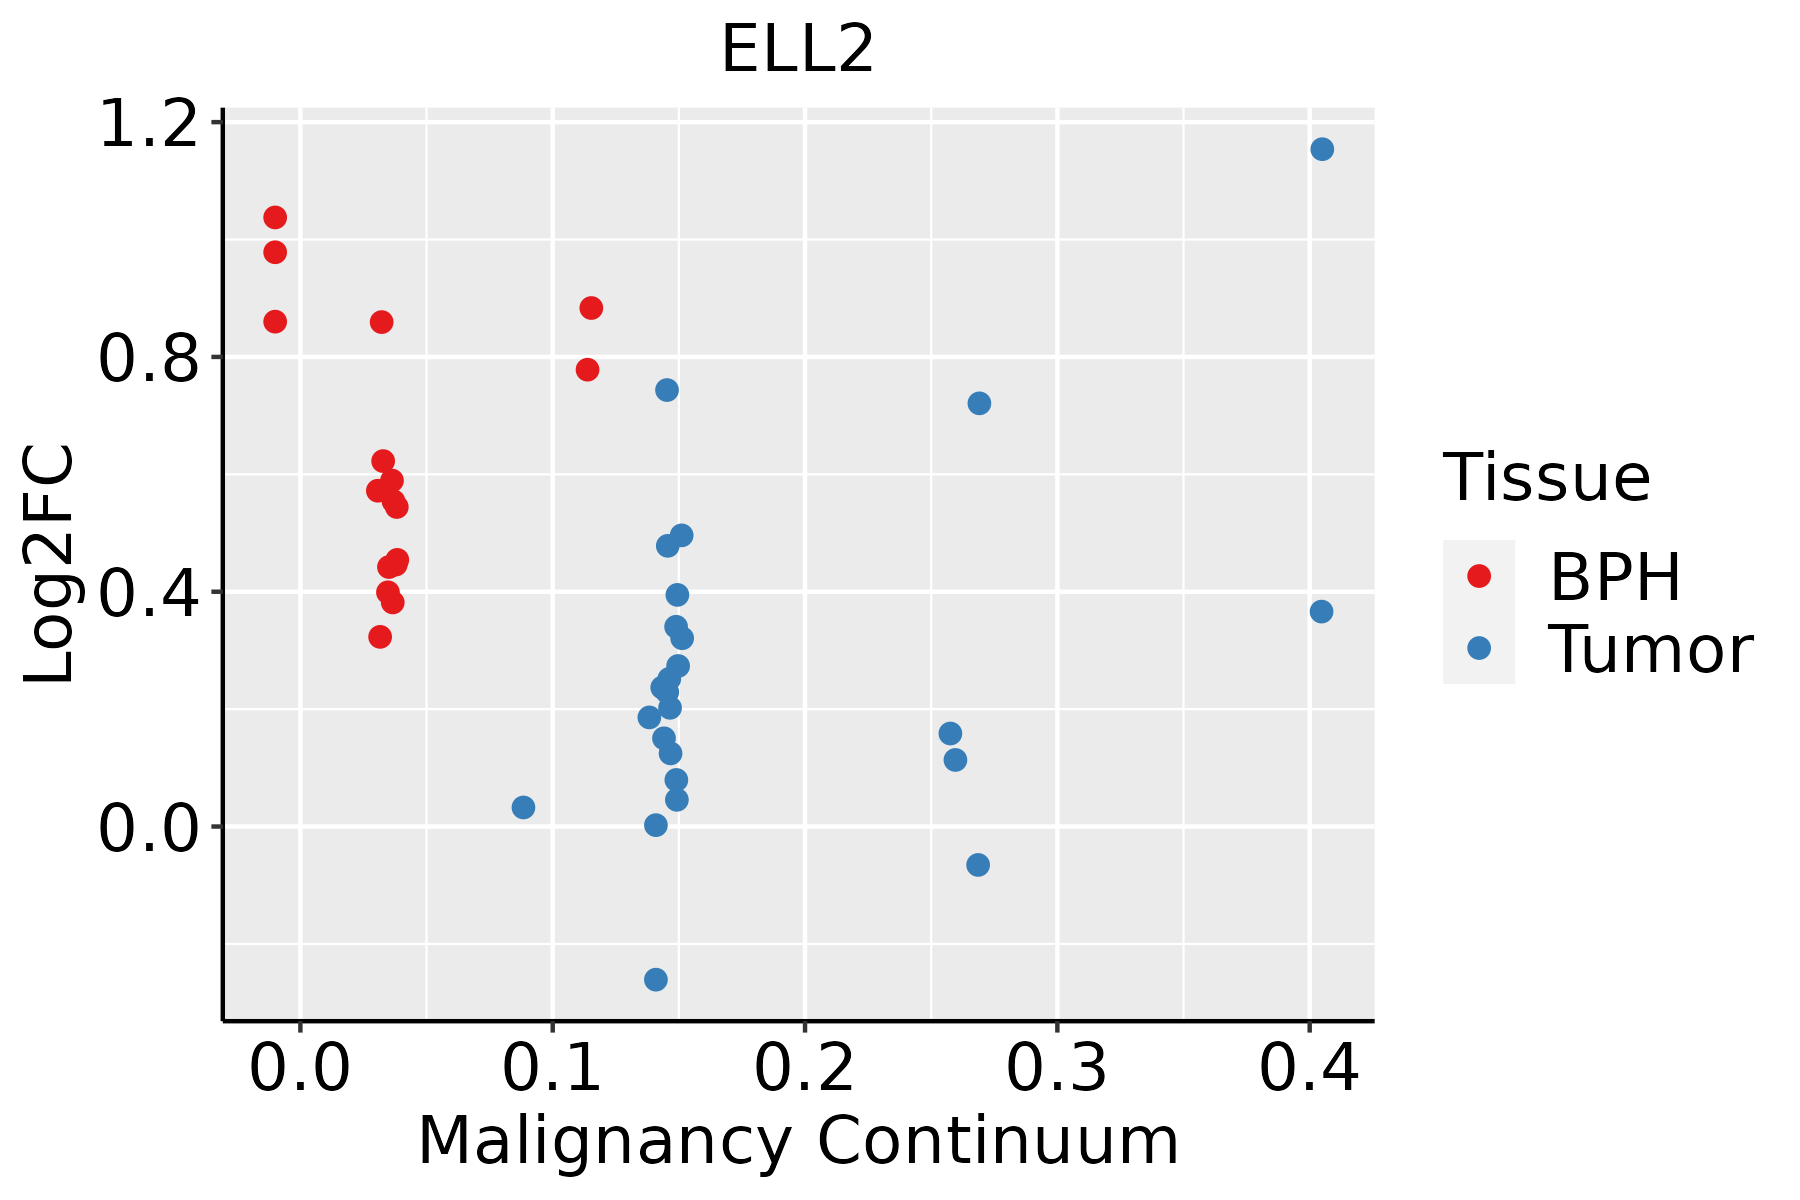 | BPH: Benign Prostatic Hyperplasia |
| Skin | 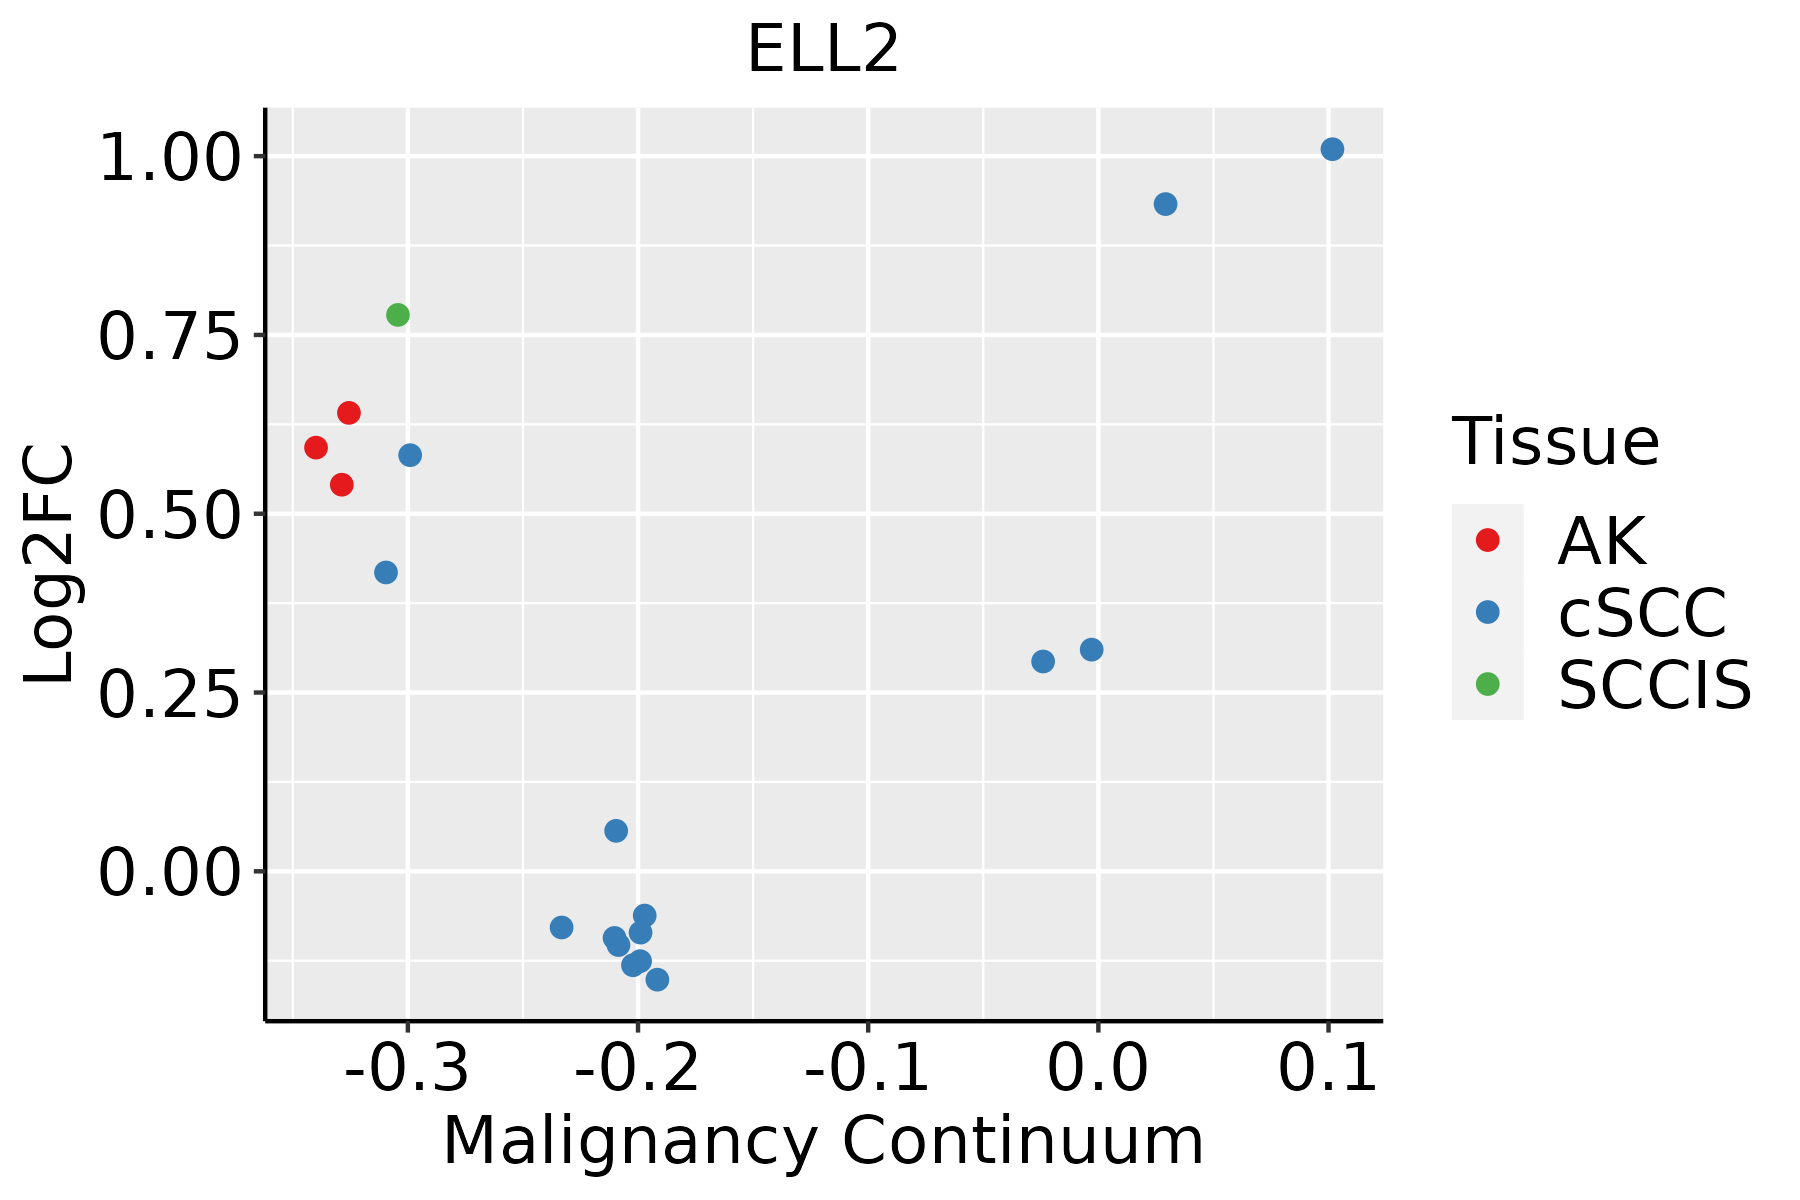 | AK: Actinic keratosis |
| cSCC: Cutaneous squamous cell carcinoma | ||
| SCCIS:squamous cell carcinoma in situ | ||
| Thyroid |  | ATC: Anaplastic thyroid cancer |
| HT: Hashimoto's thyroiditis | ||
| PTC: Papillary thyroid cancer |
| ∗log2FC in expression of this searched gene in stem-like cells from each diseased tissue sample relative to stem-like cells in normal samples in each tissue plotted against the malignancy continuum. Samples are colored based on if they are from different disease stage. |
Top |
Malignant transformation related pathway analysis |
| Find out the enriched GO biological processes and KEGG pathways involved in transition from healthy to precancer to cancer |
| Tissue | Disease Stage | Enriched GO biological Processes |
| Colorectum | AD |  |
| Colorectum | SER |  |
| Colorectum | MSS |  |
| Colorectum | MSI-H |  |
| Colorectum | FAP |  |
| ∗Top 15 enriched GO BP terms are showed in the bar plot of each disease state in each tissue. Each row represents a significant GO biological process which is colored according to the -log10(p.adjust). |
| Page: 1 2 3 4 5 6 7 8 9 |
| GO ID | Tissue | Disease Stage | Description | Gene Ratio | Bg Ratio | pvalue | p.adjust | Count |
| GO:00063684 | Cervix | CC | transcription elongation from RNA polymerase II promoter | 17/2311 | 69/18723 | 3.65e-03 | 2.33e-02 | 17 |
| GO:00063545 | Cervix | CC | DNA-templated transcription, elongation | 20/2311 | 91/18723 | 6.88e-03 | 3.74e-02 | 20 |
| GO:0006354 | Colorectum | AD | DNA-templated transcription, elongation | 31/3918 | 91/18723 | 2.46e-03 | 1.90e-02 | 31 |
| GO:0006368 | Colorectum | AD | transcription elongation from RNA polymerase II promoter | 24/3918 | 69/18723 | 5.35e-03 | 3.52e-02 | 24 |
| GO:00063541 | Colorectum | MSS | DNA-templated transcription, elongation | 29/3467 | 91/18723 | 1.52e-03 | 1.39e-02 | 29 |
| GO:00063681 | Colorectum | MSS | transcription elongation from RNA polymerase II promoter | 22/3467 | 69/18723 | 5.31e-03 | 3.62e-02 | 22 |
| GO:00063682 | Colorectum | FAP | transcription elongation from RNA polymerase II promoter | 20/2622 | 69/18723 | 9.25e-04 | 9.26e-03 | 20 |
| GO:00063542 | Colorectum | FAP | DNA-templated transcription, elongation | 24/2622 | 91/18723 | 1.32e-03 | 1.22e-02 | 24 |
| GO:00063543 | Colorectum | CRC | DNA-templated transcription, elongation | 19/2078 | 91/18723 | 4.74e-03 | 3.67e-02 | 19 |
| GO:000635414 | Esophagus | ESCC | DNA-templated transcription, elongation | 76/8552 | 91/18723 | 8.35e-14 | 4.11e-12 | 76 |
| GO:000636814 | Esophagus | ESCC | transcription elongation from RNA polymerase II promoter | 56/8552 | 69/18723 | 1.40e-09 | 3.30e-08 | 56 |
| GO:003158919 | Esophagus | ESCC | cell-substrate adhesion | 221/8552 | 363/18723 | 3.06e-09 | 6.62e-08 | 221 |
| GO:001081020 | Esophagus | ESCC | regulation of cell-substrate adhesion | 144/8552 | 221/18723 | 3.55e-09 | 7.45e-08 | 144 |
| GO:004578527 | Esophagus | ESCC | positive regulation of cell adhesion | 255/8552 | 437/18723 | 5.07e-08 | 9.11e-07 | 255 |
| GO:003109818 | Esophagus | ESCC | stress-activated protein kinase signaling cascade | 154/8552 | 247/18723 | 8.53e-08 | 1.44e-06 | 154 |
| GO:00987812 | Esophagus | ESCC | ncRNA transcription | 45/8552 | 56/18723 | 1.05e-07 | 1.72e-06 | 45 |
| GO:001081126 | Esophagus | ESCC | positive regulation of cell-substrate adhesion | 84/8552 | 123/18723 | 3.18e-07 | 4.50e-06 | 84 |
| GO:005140318 | Esophagus | ESCC | stress-activated MAPK cascade | 147/8552 | 239/18723 | 5.43e-07 | 7.18e-06 | 147 |
| GO:007030217 | Esophagus | ESCC | regulation of stress-activated protein kinase signaling cascade | 119/8552 | 195/18723 | 1.07e-05 | 1.01e-04 | 119 |
| GO:003287217 | Esophagus | ESCC | regulation of stress-activated MAPK cascade | 116/8552 | 192/18723 | 2.63e-05 | 2.21e-04 | 116 |
| Page: 1 2 3 4 |
| Pathway ID | Tissue | Disease Stage | Description | Gene Ratio | Bg Ratio | pvalue | p.adjust | qvalue | Count |
| hsa03250 | Colorectum | MSS | Viral life cycle - HIV-1 | 23/1875 | 63/8465 | 6.55e-03 | 2.64e-02 | 1.62e-02 | 23 |
| hsa032501 | Colorectum | MSS | Viral life cycle - HIV-1 | 23/1875 | 63/8465 | 6.55e-03 | 2.64e-02 | 1.62e-02 | 23 |
| hsa032509 | Esophagus | ESCC | Viral life cycle - HIV-1 | 54/4205 | 63/8465 | 2.01e-09 | 2.17e-08 | 1.11e-08 | 54 |
| hsa0325014 | Esophagus | ESCC | Viral life cycle - HIV-1 | 54/4205 | 63/8465 | 2.01e-09 | 2.17e-08 | 1.11e-08 | 54 |
| hsa032502 | Liver | HCC | Viral life cycle - HIV-1 | 46/4020 | 63/8465 | 3.25e-05 | 1.88e-04 | 1.04e-04 | 46 |
| hsa0325011 | Liver | HCC | Viral life cycle - HIV-1 | 46/4020 | 63/8465 | 3.25e-05 | 1.88e-04 | 1.04e-04 | 46 |
| hsa032508 | Oral cavity | OSCC | Viral life cycle - HIV-1 | 45/3704 | 63/8465 | 7.62e-06 | 3.59e-05 | 1.83e-05 | 45 |
| hsa0325013 | Oral cavity | OSCC | Viral life cycle - HIV-1 | 45/3704 | 63/8465 | 7.62e-06 | 3.59e-05 | 1.83e-05 | 45 |
| hsa0325041 | Oral cavity | EOLP | Viral life cycle - HIV-1 | 16/1218 | 63/8465 | 1.46e-02 | 3.77e-02 | 2.22e-02 | 16 |
| hsa032505 | Oral cavity | EOLP | Viral life cycle - HIV-1 | 16/1218 | 63/8465 | 1.46e-02 | 3.77e-02 | 2.22e-02 | 16 |
| hsa032506 | Oral cavity | NEOLP | Viral life cycle - HIV-1 | 16/1112 | 63/8465 | 6.21e-03 | 2.33e-02 | 1.46e-02 | 16 |
| hsa032507 | Oral cavity | NEOLP | Viral life cycle - HIV-1 | 16/1112 | 63/8465 | 6.21e-03 | 2.33e-02 | 1.46e-02 | 16 |
| hsa032504 | Prostate | BPH | Viral life cycle - HIV-1 | 24/1718 | 63/8465 | 8.32e-04 | 3.98e-03 | 2.46e-03 | 24 |
| hsa0325012 | Prostate | BPH | Viral life cycle - HIV-1 | 24/1718 | 63/8465 | 8.32e-04 | 3.98e-03 | 2.46e-03 | 24 |
| hsa0325021 | Prostate | Tumor | Viral life cycle - HIV-1 | 25/1791 | 63/8465 | 6.13e-04 | 3.07e-03 | 1.91e-03 | 25 |
| hsa032503 | Prostate | Tumor | Viral life cycle - HIV-1 | 25/1791 | 63/8465 | 6.13e-04 | 3.07e-03 | 1.91e-03 | 25 |
| Page: 1 |
Top |
Cell-cell communication analysis |
| Identification of potential cell-cell interactions between two cell types and their ligand-receptor pairs for different disease states |
| Ligand | Receptor | LRpair | Pathway | Tissue | Disease Stage |
| Page: 1 |
Top |
Single-cell gene regulatory network inference analysis |
| Find out the significant the regulons (TFs) and the target genes of each regulon across cell types for different disease states |
| TF | Cell Type | Tissue | Disease Stage | Target Gene | RSS | Regulon Activity |
| ∗The dot plots of a searched regulon are shown for all cell subpopulations in each disease state of each tissue based on the regulon specific score inferred using pySCENIC and by calculating the average expression. |
| Page: 1 |
Top |
Somatic mutation of malignant transformation related genes |
| Annotation of somatic variants for genes involved in malignant transformation |
| Hugo Symbol | Variant Class | Variant Classification | dbSNP RS | HGVSc | HGVSp | HGVSp Short | SWISSPROT | BIOTYPE | SIFT | PolyPhen | Tumor Sample Barcode | Tissue | Histology | Sex | Age | Stage | Therapy Types | Drugs | Outcome |
| ELL2 | SNV | Missense_Mutation | c.885G>C | p.Gln295His | p.Q295H | O00472 | protein_coding | deleterious(0.02) | probably_damaging(0.979) | TCGA-A2-A0CM-01 | Breast | breast invasive carcinoma | Female | <65 | I/II | Chemotherapy | adriamycin | PD | |
| ELL2 | SNV | Missense_Mutation | c.1007N>A | p.Arg336Gln | p.R336Q | O00472 | protein_coding | deleterious(0) | probably_damaging(0.992) | TCGA-AN-A046-01 | Breast | breast invasive carcinoma | Female | >=65 | I/II | Unknown | Unknown | SD | |
| ELL2 | SNV | Missense_Mutation | c.1468C>A | p.Leu490Ile | p.L490I | O00472 | protein_coding | tolerated(0.34) | benign(0) | TCGA-AR-A24Q-01 | Breast | breast invasive carcinoma | Female | <65 | I/II | Chemotherapy | doxorubicin | SD | |
| ELL2 | SNV | Missense_Mutation | c.1174N>A | p.Val392Ile | p.V392I | O00472 | protein_coding | tolerated(0.39) | benign(0.003) | TCGA-BH-A0HF-01 | Breast | breast invasive carcinoma | Female | >=65 | I/II | Hormone Therapy | arimidex | SD | |
| ELL2 | SNV | Missense_Mutation | c.1626G>C | p.Gln542His | p.Q542H | O00472 | protein_coding | deleterious(0) | probably_damaging(0.996) | TCGA-D8-A13Y-01 | Breast | breast invasive carcinoma | Female | <65 | I/II | Chemotherapy | doxorubicin | SD | |
| ELL2 | SNV | Missense_Mutation | c.556A>G | p.Met186Val | p.M186V | O00472 | protein_coding | tolerated(0.64) | benign(0.009) | TCGA-D8-A1Y0-01 | Breast | breast invasive carcinoma | Female | >=65 | III/IV | Chemotherapy | cyclophosphamide+methotrexatum+fluorouracillum | SD | |
| ELL2 | SNV | Missense_Mutation | novel | c.1059N>A | p.Asn353Lys | p.N353K | O00472 | protein_coding | tolerated(0.39) | benign(0.037) | TCGA-EW-A3U0-01 | Breast | breast invasive carcinoma | Female | <65 | III/IV | Chemotherapy | cisplatin | CR |
| ELL2 | insertion | Nonsense_Mutation | novel | c.795_796insGGGGAAAATGGATTTACAATCAACAAATAA | p.Phe265_Lys266insGlyGluAsnGlyPheThrIleAsnLysTer | p.F265_K266insGENGFTINK* | O00472 | protein_coding | TCGA-A8-A07U-01 | Breast | breast invasive carcinoma | Female | >=65 | III/IV | Chemotherapy | 5-fluorouracil | SD | ||
| ELL2 | insertion | In_Frame_Ins | novel | c.750_751insAAAAAAGCCCGAATATCTCACCTGACGAACAGAGTACCACCA | p.Asn250_Leu251insLysLysAlaArgIleSerHisLeuThrAsnArgValProPro | p.N250_L251insKKARISHLTNRVPP | O00472 | protein_coding | TCGA-AN-A03X-01 | Breast | breast invasive carcinoma | Female | >=65 | I/II | Unknown | Unknown | SD | ||
| ELL2 | SNV | Missense_Mutation | c.1303C>G | p.Leu435Val | p.L435V | O00472 | protein_coding | tolerated(0.3) | benign(0) | TCGA-DG-A2KK-01 | Cervix | cervical & endocervical cancer | Female | <65 | III/IV | Chemotherapy | cisplatin | SD |
| Page: 1 2 3 4 5 6 7 8 |
Top |
Related drugs of malignant transformation related genes |
| Identification of chemicals and drugs interact with genes involved in malignant transfromation |
| (DGIdb 4.0) |
| Entrez ID | Symbol | Category | Interaction Types | Drug Claim Name | Drug Name | PMIDs |
| Page: 1 |

Copyright 2023-Present -The University of Texas Health Science Center at Houston |