
|
|||||
|
 | |
| |
| |
| |
| |
| |
|
Gene: ELL |
Gene summary for ELL |
| Gene information | Species | Human | Gene symbol | ELL | Gene ID | 8178 |
| Gene name | elongation factor for RNA polymerase II | |
| Gene Alias | C19orf17 | |
| Cytomap | 19p13.11 | |
| Gene Type | protein-coding | GO ID | GO:0001701 | UniProtAcc | P55199 |
Top |
Malignant transformation analysis |
| Identification of the aberrant gene expression in precancerous and cancerous lesions by comparing the gene expression of stem-like cells in diseased tissues with normal stem cells |
| Entrez ID | Symbol | Replicates | Species | Organ | Tissue | Adj P-value | Log2FC | Malignancy |
| 8178 | ELL | LZE4T | Human | Esophagus | ESCC | 2.00e-04 | 1.07e-01 | 0.0811 |
| 8178 | ELL | LZE7T | Human | Esophagus | ESCC | 1.56e-02 | 1.26e-01 | 0.0667 |
| 8178 | ELL | LZE20T | Human | Esophagus | ESCC | 2.13e-03 | 4.79e-02 | 0.0662 |
| 8178 | ELL | LZE24T | Human | Esophagus | ESCC | 9.26e-15 | 3.33e-01 | 0.0596 |
| 8178 | ELL | P1T-E | Human | Esophagus | ESCC | 1.26e-05 | 3.74e-01 | 0.0875 |
| 8178 | ELL | P2T-E | Human | Esophagus | ESCC | 1.39e-10 | 4.83e-02 | 0.1177 |
| 8178 | ELL | P4T-E | Human | Esophagus | ESCC | 7.54e-04 | 1.04e-01 | 0.1323 |
| 8178 | ELL | P5T-E | Human | Esophagus | ESCC | 9.45e-15 | 1.26e-01 | 0.1327 |
| 8178 | ELL | P8T-E | Human | Esophagus | ESCC | 8.67e-11 | 1.31e-01 | 0.0889 |
| 8178 | ELL | P9T-E | Human | Esophagus | ESCC | 1.00e-15 | 2.80e-01 | 0.1131 |
| 8178 | ELL | P10T-E | Human | Esophagus | ESCC | 1.32e-16 | 1.32e-01 | 0.116 |
| 8178 | ELL | P11T-E | Human | Esophagus | ESCC | 8.82e-07 | 4.68e-01 | 0.1426 |
| 8178 | ELL | P12T-E | Human | Esophagus | ESCC | 1.78e-12 | 2.78e-01 | 0.1122 |
| 8178 | ELL | P15T-E | Human | Esophagus | ESCC | 2.00e-16 | 2.20e-01 | 0.1149 |
| 8178 | ELL | P16T-E | Human | Esophagus | ESCC | 8.39e-05 | 7.27e-03 | 0.1153 |
| 8178 | ELL | P17T-E | Human | Esophagus | ESCC | 2.22e-05 | 2.24e-01 | 0.1278 |
| 8178 | ELL | P19T-E | Human | Esophagus | ESCC | 7.27e-03 | 1.77e-01 | 0.1662 |
| 8178 | ELL | P20T-E | Human | Esophagus | ESCC | 1.75e-11 | 2.80e-01 | 0.1124 |
| 8178 | ELL | P21T-E | Human | Esophagus | ESCC | 6.19e-19 | 3.68e-01 | 0.1617 |
| 8178 | ELL | P22T-E | Human | Esophagus | ESCC | 6.17e-15 | 6.82e-02 | 0.1236 |
| Page: 1 2 3 |
| Tissue | Expression Dynamics | Abbreviation |
| Esophagus | 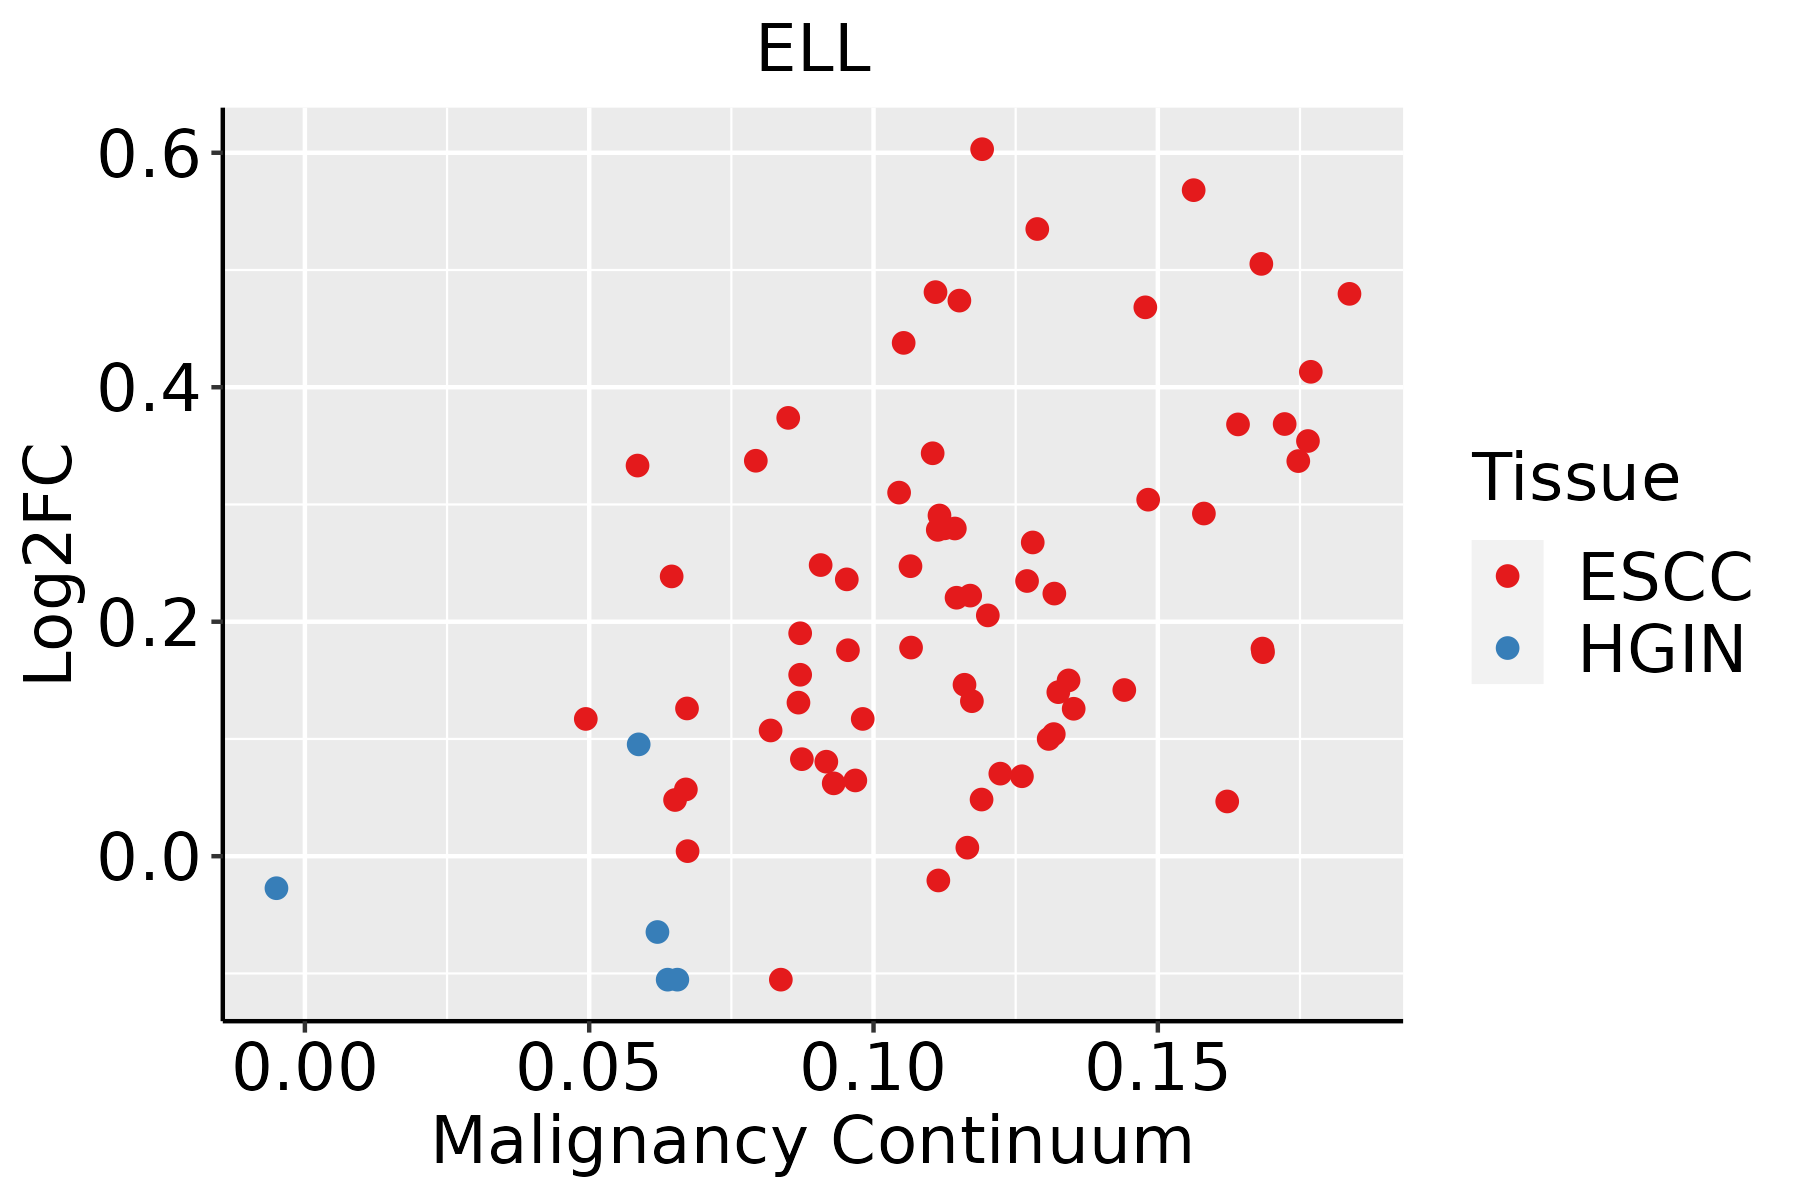 | ESCC: Esophageal squamous cell carcinoma |
| HGIN: High-grade intraepithelial neoplasias | ||
| LGIN: Low-grade intraepithelial neoplasias |
| ∗log2FC in expression of this searched gene in stem-like cells from each diseased tissue sample relative to stem-like cells in normal samples in each tissue plotted against the malignancy continuum. Samples are colored based on if they are from different disease stage. |
Top |
Malignant transformation related pathway analysis |
| Find out the enriched GO biological processes and KEGG pathways involved in transition from healthy to precancer to cancer |
| Tissue | Disease Stage | Enriched GO biological Processes |
| Colorectum | AD |  |
| Colorectum | SER |  |
| Colorectum | MSS |  |
| Colorectum | MSI-H |  |
| Colorectum | FAP |  |
| ∗Top 15 enriched GO BP terms are showed in the bar plot of each disease state in each tissue. Each row represents a significant GO biological process which is colored according to the -log10(p.adjust). |
| Page: 1 2 3 4 5 6 7 8 9 |
| GO ID | Tissue | Disease Stage | Description | Gene Ratio | Bg Ratio | pvalue | p.adjust | Count |
| GO:00063684 | Cervix | CC | transcription elongation from RNA polymerase II promoter | 17/2311 | 69/18723 | 3.65e-03 | 2.33e-02 | 17 |
| GO:00063545 | Cervix | CC | DNA-templated transcription, elongation | 20/2311 | 91/18723 | 6.88e-03 | 3.74e-02 | 20 |
| GO:0006354 | Colorectum | AD | DNA-templated transcription, elongation | 31/3918 | 91/18723 | 2.46e-03 | 1.90e-02 | 31 |
| GO:0006368 | Colorectum | AD | transcription elongation from RNA polymerase II promoter | 24/3918 | 69/18723 | 5.35e-03 | 3.52e-02 | 24 |
| GO:00063541 | Colorectum | MSS | DNA-templated transcription, elongation | 29/3467 | 91/18723 | 1.52e-03 | 1.39e-02 | 29 |
| GO:00063681 | Colorectum | MSS | transcription elongation from RNA polymerase II promoter | 22/3467 | 69/18723 | 5.31e-03 | 3.62e-02 | 22 |
| GO:00063682 | Colorectum | FAP | transcription elongation from RNA polymerase II promoter | 20/2622 | 69/18723 | 9.25e-04 | 9.26e-03 | 20 |
| GO:00063542 | Colorectum | FAP | DNA-templated transcription, elongation | 24/2622 | 91/18723 | 1.32e-03 | 1.22e-02 | 24 |
| GO:00063543 | Colorectum | CRC | DNA-templated transcription, elongation | 19/2078 | 91/18723 | 4.74e-03 | 3.67e-02 | 19 |
| GO:00514039 | Endometrium | AEH | stress-activated MAPK cascade | 50/2100 | 239/18723 | 9.33e-06 | 2.18e-04 | 50 |
| GO:00310989 | Endometrium | AEH | stress-activated protein kinase signaling cascade | 51/2100 | 247/18723 | 1.12e-05 | 2.52e-04 | 51 |
| GO:00328728 | Endometrium | AEH | regulation of stress-activated MAPK cascade | 42/2100 | 192/18723 | 1.53e-05 | 3.23e-04 | 42 |
| GO:00380665 | Endometrium | AEH | p38MAPK cascade | 18/2100 | 55/18723 | 1.77e-05 | 3.65e-04 | 18 |
| GO:00434105 | Endometrium | AEH | positive regulation of MAPK cascade | 84/2100 | 480/18723 | 2.19e-05 | 4.25e-04 | 84 |
| GO:00703028 | Endometrium | AEH | regulation of stress-activated protein kinase signaling cascade | 42/2100 | 195/18723 | 2.27e-05 | 4.35e-04 | 42 |
| GO:19007443 | Endometrium | AEH | regulation of p38MAPK cascade | 15/2100 | 47/18723 | 1.21e-04 | 1.67e-03 | 15 |
| GO:19007452 | Endometrium | AEH | positive regulation of p38MAPK cascade | 10/2100 | 32/18723 | 1.94e-03 | 1.52e-02 | 10 |
| GO:00328743 | Endometrium | AEH | positive regulation of stress-activated MAPK cascade | 25/2100 | 126/18723 | 3.18e-03 | 2.24e-02 | 25 |
| GO:00703044 | Endometrium | AEH | positive regulation of stress-activated protein kinase signaling cascade | 25/2100 | 128/18723 | 3.95e-03 | 2.65e-02 | 25 |
| GO:003806612 | Endometrium | EEC | p38MAPK cascade | 21/2168 | 55/18723 | 3.30e-07 | 1.33e-05 | 21 |
| Page: 1 2 3 4 5 6 7 8 9 10 11 12 |
| Pathway ID | Tissue | Disease Stage | Description | Gene Ratio | Bg Ratio | pvalue | p.adjust | qvalue | Count |
| hsa032509 | Esophagus | ESCC | Viral life cycle - HIV-1 | 54/4205 | 63/8465 | 2.01e-09 | 2.17e-08 | 1.11e-08 | 54 |
| hsa0325014 | Esophagus | ESCC | Viral life cycle - HIV-1 | 54/4205 | 63/8465 | 2.01e-09 | 2.17e-08 | 1.11e-08 | 54 |
| Page: 1 |
Top |
Cell-cell communication analysis |
| Identification of potential cell-cell interactions between two cell types and their ligand-receptor pairs for different disease states |
| Ligand | Receptor | LRpair | Pathway | Tissue | Disease Stage |
| Page: 1 |
Top |
Single-cell gene regulatory network inference analysis |
| Find out the significant the regulons (TFs) and the target genes of each regulon across cell types for different disease states |
| TF | Cell Type | Tissue | Disease Stage | Target Gene | RSS | Regulon Activity |
| ∗The dot plots of a searched regulon are shown for all cell subpopulations in each disease state of each tissue based on the regulon specific score inferred using pySCENIC and by calculating the average expression. |
| Page: 1 |
Top |
Somatic mutation of malignant transformation related genes |
| Annotation of somatic variants for genes involved in malignant transformation |
| Hugo Symbol | Variant Class | Variant Classification | dbSNP RS | HGVSc | HGVSp | HGVSp Short | SWISSPROT | BIOTYPE | SIFT | PolyPhen | Tumor Sample Barcode | Tissue | Histology | Sex | Age | Stage | Therapy Types | Drugs | Outcome |
| ELL | SNV | Missense_Mutation | c.719A>G | p.Asp240Gly | p.D240G | P55199 | protein_coding | deleterious(0.01) | probably_damaging(0.999) | TCGA-A1-A0SQ-01 | Breast | breast invasive carcinoma | Female | <65 | I/II | Chemotherapy | ac | SD | |
| ELL | SNV | Missense_Mutation | rs538570775 | c.1634N>A | p.Arg545His | p.R545H | P55199 | protein_coding | tolerated(0.21) | possibly_damaging(0.517) | TCGA-A7-A4SE-01 | Breast | breast invasive carcinoma | Female | <65 | I/II | Chemotherapy | adriamycin | CR |
| ELL | SNV | Missense_Mutation | c.189C>G | p.Ile63Met | p.I63M | P55199 | protein_coding | deleterious(0.04) | probably_damaging(0.999) | TCGA-A8-A06Q-01 | Breast | breast invasive carcinoma | Female | <65 | III/IV | Unknown | Unknown | SD | |
| ELL | SNV | Missense_Mutation | novel | c.343N>A | p.Gln115Lys | p.Q115K | P55199 | protein_coding | deleterious(0) | probably_damaging(0.987) | TCGA-AC-A8OR-01 | Breast | breast invasive carcinoma | Female | >=65 | I/II | Unknown | Unknown | SD |
| ELL | SNV | Missense_Mutation | c.1183N>T | p.Asp395Tyr | p.D395Y | P55199 | protein_coding | deleterious(0) | probably_damaging(0.976) | TCGA-C8-A12T-01 | Breast | breast invasive carcinoma | Female | <65 | I/II | Unknown | Unknown | SD | |
| ELL | SNV | Missense_Mutation | c.956N>G | p.Ser319Trp | p.S319W | P55199 | protein_coding | deleterious(0) | possibly_damaging(0.818) | TCGA-C8-A1HM-01 | Breast | breast invasive carcinoma | Female | >=65 | I/II | Chemotherapy | doxorubicin | CR | |
| ELL | deletion | Frame_Shift_Del | novel | c.1845delN | p.Gln616SerfsTer30 | p.Q616Sfs*30 | P55199 | protein_coding | TCGA-D8-A27V-01 | Breast | breast invasive carcinoma | Female | <65 | I/II | Hormone Therapy | tamoxiphen | SD | ||
| ELL | SNV | Missense_Mutation | novel | c.1273N>A | p.Leu425Ile | p.L425I | P55199 | protein_coding | tolerated(0.16) | possibly_damaging(0.492) | TCGA-2W-A8YY-01 | Cervix | cervical & endocervical cancer | Female | <65 | I/II | Chemotherapy | cisplatin | CR |
| ELL | SNV | Missense_Mutation | rs759973204 | c.940N>T | p.Arg314Cys | p.R314C | P55199 | protein_coding | deleterious(0.05) | benign(0.007) | TCGA-2W-A8YY-01 | Cervix | cervical & endocervical cancer | Female | <65 | I/II | Chemotherapy | cisplatin | CR |
| ELL | SNV | Missense_Mutation | novel | c.131G>A | p.Arg44Lys | p.R44K | P55199 | protein_coding | tolerated(0.53) | benign(0.007) | TCGA-C5-A2LZ-01 | Cervix | cervical & endocervical cancer | Female | >=65 | III/IV | Unknown | Unknown | PD |
| Page: 1 2 3 4 5 6 |
Top |
Related drugs of malignant transformation related genes |
| Identification of chemicals and drugs interact with genes involved in malignant transfromation |
| (DGIdb 4.0) |
| Entrez ID | Symbol | Category | Interaction Types | Drug Claim Name | Drug Name | PMIDs |
| Page: 1 |

Copyright 2023-Present -The University of Texas Health Science Center at Houston |