
|
|||||
|
 | |
| |
| |
| |
| |
| |
|
Gene: ELK3 |
Gene summary for ELK3 |
| Gene information | Species | Human | Gene symbol | ELK3 | Gene ID | 2004 |
| Gene name | ETS transcription factor ELK3 | |
| Gene Alias | ERP | |
| Cytomap | 12q23.1 | |
| Gene Type | protein-coding | GO ID | GO:0000122 | UniProtAcc | A0A024RBE2 |
Top |
Malignant transformation analysis |
| Identification of the aberrant gene expression in precancerous and cancerous lesions by comparing the gene expression of stem-like cells in diseased tissues with normal stem cells |
| Entrez ID | Symbol | Replicates | Species | Organ | Tissue | Adj P-value | Log2FC | Malignancy |
| 2004 | ELK3 | LZE20T | Human | Esophagus | ESCC | 8.02e-04 | 1.37e-02 | 0.0662 |
| 2004 | ELK3 | LZE24T | Human | Esophagus | ESCC | 1.23e-10 | 6.16e-02 | 0.0596 |
| 2004 | ELK3 | LZE6T | Human | Esophagus | ESCC | 3.27e-03 | 5.34e-02 | 0.0845 |
| 2004 | ELK3 | P1T-E | Human | Esophagus | ESCC | 3.93e-02 | 1.63e-01 | 0.0875 |
| 2004 | ELK3 | P2T-E | Human | Esophagus | ESCC | 4.24e-15 | 3.47e-01 | 0.1177 |
| 2004 | ELK3 | P4T-E | Human | Esophagus | ESCC | 1.94e-07 | 1.22e-01 | 0.1323 |
| 2004 | ELK3 | P5T-E | Human | Esophagus | ESCC | 1.69e-12 | 2.80e-01 | 0.1327 |
| 2004 | ELK3 | P8T-E | Human | Esophagus | ESCC | 1.57e-14 | 2.26e-01 | 0.0889 |
| 2004 | ELK3 | P10T-E | Human | Esophagus | ESCC | 2.07e-03 | 1.75e-02 | 0.116 |
| 2004 | ELK3 | P11T-E | Human | Esophagus | ESCC | 1.76e-13 | 3.76e-01 | 0.1426 |
| 2004 | ELK3 | P12T-E | Human | Esophagus | ESCC | 7.03e-07 | 2.67e-02 | 0.1122 |
| 2004 | ELK3 | P15T-E | Human | Esophagus | ESCC | 2.33e-08 | 1.90e-01 | 0.1149 |
| 2004 | ELK3 | P16T-E | Human | Esophagus | ESCC | 5.56e-06 | -1.82e-03 | 0.1153 |
| 2004 | ELK3 | P17T-E | Human | Esophagus | ESCC | 2.14e-03 | 3.05e-01 | 0.1278 |
| 2004 | ELK3 | P19T-E | Human | Esophagus | ESCC | 1.86e-04 | 6.84e-01 | 0.1662 |
| 2004 | ELK3 | P20T-E | Human | Esophagus | ESCC | 2.58e-11 | 1.96e-01 | 0.1124 |
| 2004 | ELK3 | P21T-E | Human | Esophagus | ESCC | 1.49e-13 | 2.71e-01 | 0.1617 |
| 2004 | ELK3 | P22T-E | Human | Esophagus | ESCC | 1.81e-09 | -1.86e-02 | 0.1236 |
| 2004 | ELK3 | P23T-E | Human | Esophagus | ESCC | 3.17e-11 | 4.86e-01 | 0.108 |
| 2004 | ELK3 | P24T-E | Human | Esophagus | ESCC | 3.27e-05 | 1.49e-01 | 0.1287 |
| Page: 1 2 3 4 5 |
| Tissue | Expression Dynamics | Abbreviation |
| Esophagus |  | ESCC: Esophageal squamous cell carcinoma |
| HGIN: High-grade intraepithelial neoplasias | ||
| LGIN: Low-grade intraepithelial neoplasias | ||
| Oral Cavity |  | EOLP: Erosive Oral lichen planus |
| LP: leukoplakia | ||
| NEOLP: Non-erosive oral lichen planus | ||
| OSCC: Oral squamous cell carcinoma | ||
| Thyroid | 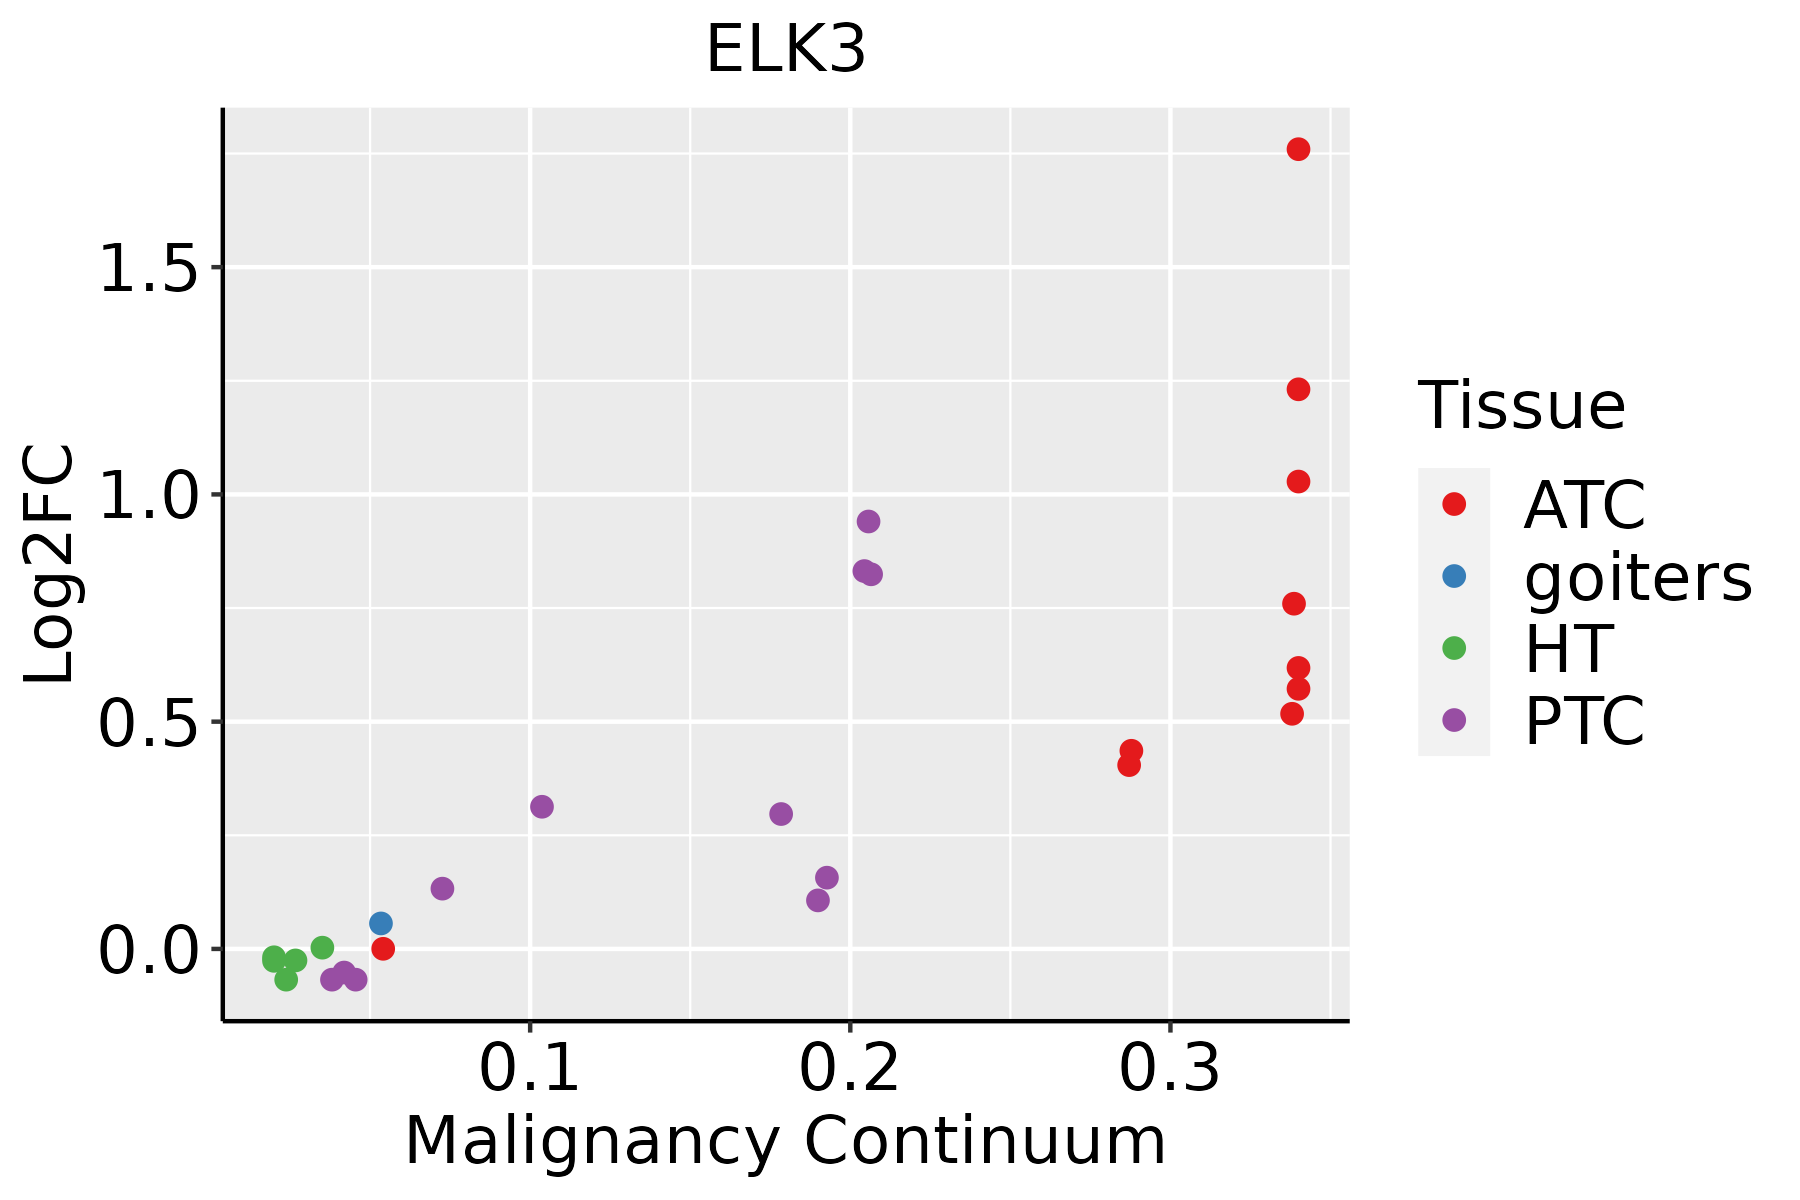 | ATC: Anaplastic thyroid cancer |
| HT: Hashimoto's thyroiditis | ||
| PTC: Papillary thyroid cancer |
| ∗log2FC in expression of this searched gene in stem-like cells from each diseased tissue sample relative to stem-like cells in normal samples in each tissue plotted against the malignancy continuum. Samples are colored based on if they are from different disease stage. |
Top |
Malignant transformation related pathway analysis |
| Find out the enriched GO biological processes and KEGG pathways involved in transition from healthy to precancer to cancer |
| Tissue | Disease Stage | Enriched GO biological Processes |
| Colorectum | AD |  |
| Colorectum | SER |  |
| Colorectum | MSS |  |
| Colorectum | MSI-H |  |
| Colorectum | FAP |  |
| ∗Top 15 enriched GO BP terms are showed in the bar plot of each disease state in each tissue. Each row represents a significant GO biological process which is colored according to the -log10(p.adjust). |
| Page: 1 2 3 4 5 6 7 8 9 |
| GO ID | Tissue | Disease Stage | Description | Gene Ratio | Bg Ratio | pvalue | p.adjust | Count |
| GO:004206027 | Esophagus | ESCC | wound healing | 243/8552 | 422/18723 | 4.62e-07 | 6.25e-06 | 243 |
| GO:004206020 | Oral cavity | OSCC | wound healing | 237/7305 | 422/18723 | 4.51e-13 | 2.18e-11 | 237 |
| GO:0042060110 | Oral cavity | LP | wound healing | 139/4623 | 422/18723 | 7.10e-05 | 9.48e-04 | 139 |
| GO:004206026 | Oral cavity | EOLP | wound healing | 99/2218 | 422/18723 | 1.18e-11 | 1.85e-09 | 99 |
| GO:004206033 | Oral cavity | NEOLP | wound healing | 106/2005 | 422/18723 | 1.93e-17 | 1.91e-14 | 106 |
| GO:0042060112 | Thyroid | PTC | wound healing | 190/5968 | 422/18723 | 7.72e-09 | 1.92e-07 | 190 |
| GO:004206034 | Thyroid | ATC | wound healing | 210/6293 | 422/18723 | 3.33e-12 | 1.37e-10 | 210 |
| Page: 1 |
| Pathway ID | Tissue | Disease Stage | Description | Gene Ratio | Bg Ratio | pvalue | p.adjust | qvalue | Count |
| Page: 1 |
Top |
Cell-cell communication analysis |
| Identification of potential cell-cell interactions between two cell types and their ligand-receptor pairs for different disease states |
| Ligand | Receptor | LRpair | Pathway | Tissue | Disease Stage |
| Page: 1 |
Top |
Single-cell gene regulatory network inference analysis |
| Find out the significant the regulons (TFs) and the target genes of each regulon across cell types for different disease states |
| TF | Cell Type | Tissue | Disease Stage | Target Gene | RSS | Regulon Activity |
| ELK3 | PLA | Liver | Healthy | TPT1-AS1,GAPT,TTC39C-AS1, etc. | 5.59e-01 |  |
| ∗The dot plots of a searched regulon are shown for all cell subpopulations in each disease state of each tissue based on the regulon specific score inferred using pySCENIC and by calculating the average expression. |
| Page: 1 |
Top |
Somatic mutation of malignant transformation related genes |
| Annotation of somatic variants for genes involved in malignant transformation |
| Hugo Symbol | Variant Class | Variant Classification | dbSNP RS | HGVSc | HGVSp | HGVSp Short | SWISSPROT | BIOTYPE | SIFT | PolyPhen | Tumor Sample Barcode | Tissue | Histology | Sex | Age | Stage | Therapy Types | Drugs | Outcome |
| ELK3 | insertion | Frame_Shift_Ins | rs769175197 | c.518_519insC | p.Val176ArgfsTer14 | p.V176Rfs*14 | P41970 | protein_coding | TCGA-A8-A09Z-01 | Breast | breast invasive carcinoma | Female | >=65 | I/II | Unknown | Unknown | SD | ||
| ELK3 | SNV | Missense_Mutation | c.668N>G | p.Ser223Cys | p.S223C | P41970 | protein_coding | tolerated(0.07) | probably_damaging(0.99) | TCGA-BI-A0VS-01 | Cervix | cervical & endocervical cancer | Female | <65 | I/II | Unknown | Unknown | SD | |
| ELK3 | SNV | Missense_Mutation | rs1064000 | c.488N>T | p.Thr163Met | p.T163M | P41970 | protein_coding | tolerated(0.27) | probably_damaging(0.985) | TCGA-5M-AAT6-01 | Colorectum | colon adenocarcinoma | Female | <65 | III/IV | Unknown | Unknown | PD |
| ELK3 | SNV | Missense_Mutation | c.1081C>T | p.Pro361Ser | p.P361S | P41970 | protein_coding | deleterious(0.03) | probably_damaging(0.994) | TCGA-AA-3492-01 | Colorectum | colon adenocarcinoma | Female | >=65 | I/II | Unknown | Unknown | SD | |
| ELK3 | SNV | Missense_Mutation | novel | c.69N>C | p.Leu23Phe | p.L23F | P41970 | protein_coding | deleterious(0) | probably_damaging(0.999) | TCGA-AA-3684-01 | Colorectum | colon adenocarcinoma | Female | >=65 | III/IV | Unknown | Unknown | SD |
| ELK3 | SNV | Missense_Mutation | c.446N>T | p.Asn149Ile | p.N149I | P41970 | protein_coding | deleterious(0) | benign(0.4) | TCGA-AA-3713-01 | Colorectum | colon adenocarcinoma | Male | >=65 | III/IV | Chemotherapy | 5-fluorouracil | PR | |
| ELK3 | SNV | Missense_Mutation | novel | c.14T>C | p.Ile5Thr | p.I5T | P41970 | protein_coding | deleterious(0) | probably_damaging(0.997) | TCGA-AA-3845-01 | Colorectum | colon adenocarcinoma | Female | >=65 | I/II | Unknown | Unknown | PD |
| ELK3 | SNV | Missense_Mutation | c.5N>T | p.Glu2Val | p.E2V | P41970 | protein_coding | deleterious(0) | possibly_damaging(0.796) | TCGA-AA-A01R-01 | Colorectum | colon adenocarcinoma | Male | <65 | III/IV | Chemotherapy | 5-fluorouracil | PD | |
| ELK3 | SNV | Missense_Mutation | novel | c.934N>A | p.Gly312Ser | p.G312S | P41970 | protein_coding | tolerated(1) | probably_damaging(0.952) | TCGA-AD-5900-01 | Colorectum | colon adenocarcinoma | Male | >=65 | I/II | Unknown | Unknown | SD |
| ELK3 | SNV | Missense_Mutation | novel | c.143N>A | p.Arg48Gln | p.R48Q | P41970 | protein_coding | deleterious(0) | probably_damaging(0.997) | TCGA-AZ-4315-01 | Colorectum | colon adenocarcinoma | Male | <65 | I/II | Unknown | Unknown | SD |
| Page: 1 2 3 4 5 6 |
Top |
Related drugs of malignant transformation related genes |
| Identification of chemicals and drugs interact with genes involved in malignant transfromation |
| (DGIdb 4.0) |
| Entrez ID | Symbol | Category | Interaction Types | Drug Claim Name | Drug Name | PMIDs |
| Page: 1 |

Copyright 2023-Present -The University of Texas Health Science Center at Houston |